The 1918 influenza epidemic was a major demographic event in the United States and worldwide. It is notable for its virulence (over 20 million deaths worldwide, approximately half a million in the United States); its maleness (a difference between male and female age-standardized death rates of 174 per 100,0001); and its W-shaped mortality age profile (death rates having a mode in the 25–34-year age group, strange for influenza, which usually has a U-shaped profile). This study presents a new finding from reexamination of published statistics on death: the 1918 influenza had a strong and fairly long-lasting effect on differential mortality by sex, diminishing the earlier female advantage. The mechanism we posit is a selection effect, whereby those with tuberculosis (TB) in 1918 were more likely than others to die of influenza. This outcome affected males more than females because TB morbidity was disproportionately male. The reduction of the pool of male TB cases lowered the male TB death rate in the years following 1918, and brought males' life expectancy closer to the longer female life expectancy.
Before going into detail about our reexamination, we briefly review some of the salient features of the 1918 influenza epidemic, which, in spite of its enormity, has not been a major focus of studies by demographers.
Background of the 1918 influenza pandemic
Influenza is caused by a virus, a member of the family Orthomyxoviridae. The genome of the influenza virus consists of eight single strands of RNA. Formation of new flu strains can occur when a host cell is infected by two existing viral strains. For this reason, there are many strains of influenza virus, which explains why, in the practice of modern medicine, new vaccines, based on surveillance of early cases, are recommended before each flu season. Four aspects that set the 1918 epidemic apart from other flu epidemics are the sheer magnitude of the epidemic, the high mortality rate, the aforementioned unusual W-shaped age profile of deaths, and recent molecular discoveries about the 1918 strain.
The first noteworthy aspect of the 1918 epidemic was how many people were affected. Crosby (1989) cites estimates that one-quarter of the American population had clinically recognizable cases of flu during the epidemic. The epidemic was truly global, leaving no continent untouched, and it spread very rapidly. The geographic origin of the epidemic is still debated, with viable North American and European hypotheses (Pyle 1986; Oxford et al. 1999). The “Spanish” attribution of the epidemic, common in the literature, is thought to be a result of the fact that the press in neutral Spain was not censored during World War I, and therefore some early printed reports of the flu originated from Spain. The epidemic began in spring 1918 and much of its impact was experienced during that calendar year. But the epidemic also persisted into 1919 (albeit less so in the United States), when it was most severe in the southern hemisphere, and also dogged the representatives at the Paris peace conference. By 1920, the epidemic's world tour was over; some cases but few fatalities were reported in 1921 in New Caledonia (in the southwest Pacific) after the island was released from maritime quarantine (Crosby 1989: 234).
The next noteworthy aspect of the 1918 influenza epidemic is the exceptionally high mortality associated with it. Crosby (1989) estimates that it took the lives of 550,000 Americans, a figure that he deems conservative. The estimated population of the United States on 1 July 1918 was some 103 million (Linder and Grove 1943), so approximately 0.5 percent of the US population died as a result of the epidemic. Worldwide, the death toll is generally put at 20 million. Given the rudimentary state of vital registration in most of what was then the colonized world, this is a rough estimate. Kingsley Davis (1951: 237) calculated that in colonial India alone there were some 18.5 million influenza deaths during 1918–19, and in one of his scenarios the total is 31 million. Thus, the worldwide death total could easily have been in the neighborhood of 40 million. Before the 1918 epidemic, one has to go back to the black death (bubonic plague) of 1346 to find a similarly devastating epidemic. Since 1918, only the AIDS epidemic comes close in terms of global mortality, but, when taking the time frames into account, AIDS has a slow burn compared to the explosion of the 1918 influenza epidemic.
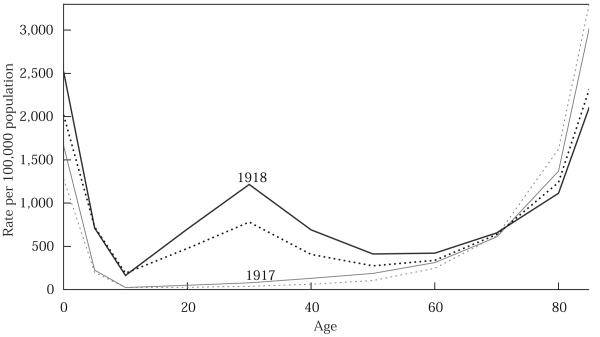
The mortality of the 1918 epidemic was exceptional not only quantitatively, but qualitatively as well. The W-shape of the mortality age profile is the most peculiar aspect of 1918 flu epidemic. Normally, influenza kills only the very young and the very old. For adults, flu means a bad case of cold and usually some time in bed, but rarely death from secondary pneumonia. Figure 1 presents death rates for influenza and pneumonia combined (except pneumonia of the newborn) by age and sex for 1917 and 1918 in the United States. In 1917 (the bottom two curves in the figure), death rates are high at the very youngest ages, drop to near zero later in childhood, then show a gradual increase throughout younger adulthood and a steeper increase above age 60. As in the age pattern of mortality for all causes combined, this is the classic U-shaped mortality pattern by age. In 1918, the pattern is radically different: we have a W-shape. At the youngest ages, influenza death rates in 1918 are about the same as in 1917. At the oldest ages, influenza death rates in 1918 are less than in 1917. In contrast, the middle ages, the age groups 15–24, 25–34, and 35–44, show a drastic departure from the norm. The death rates have a local maximum at these ages, such that adults in the prime of their lives experienced death rates from influenza comparable to those experienced by the elderly. Note also in Figure 1 that the male death rates in 1918 far exceed the female death rates among adults. Among the elderly in both years, there is a slight female excess death rate. Among children and adults, there is a slight male excess death rate in 1917. But in 1918, males were at a much greater disadvantage in terms of flu mortality.
FIGURE 1.
Age-specific death rates for influenza and pneumonia combined, males (solid) and females (dotted), 1917 and 1918
SOURCE: US Department of Health, Education, and Welfare 1956.
The search for the cause of the 1918 influenza epidemic originally centered on bacteria, specifically Pfeiffer's bacillus (Haemophilus influenzae). It was in his research on the putative etiologic agent of the 1918 flu that Alexander Fleming made his serendipitous discovery in 1929 of the antibiotic properties of Penicillium. In 1933, it was finally determined that influenza is caused by a virus. Recently, with the advent of techniques permitting creation of laboratory samples of genetic code from the most minute traces of virus (through polymerase chain reaction, or PCR), molecular biologists have taken a renewed interest in the 1918 epidemic. Reid et al. (1999, 2000) report genetic characterization of the 1918 virus from human bodies preserved in Alaskan permafrost and from autopsy tissue samples embedded in paraffin. These studies show that of all the mammalian flu strains, the 1918 strain is closest to the avian strains of influenza virus; the 1918 virus is also related to swine strains. The general zoonotic nature of influenza (i.e., its transmissibility from animals to humans) appears to have played a particular role in the exceptional 1918 epidemic. Frustratingly, these findings have not answered the question why the 1918 virus was so virulent, nor do they offer an explanation for the unusual age profile of deaths.
Changes in life expectancy
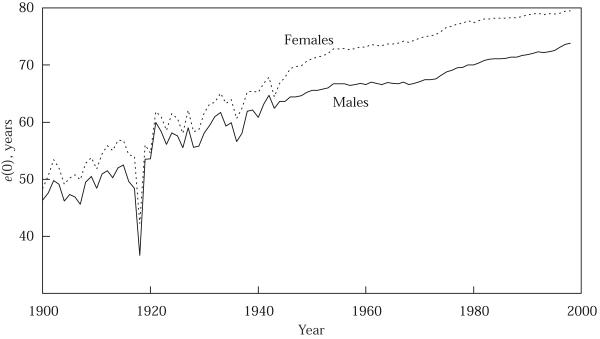
Life expectancy at birth, e(0), is a summary of mortality at a given time. It is the mean length of life that would be experienced by a birth cohort subject to the mortality rates of the reference period through the cohort's entire life span. The 1918 influenza epidemic affected life expectancy at birth in the United States, with the measure for each sex dropping by 11.8 years from 1917 to 1918.2 There was no lasting effect on e(0) values, however, as survivorship for both sexes rebounded quickly; indeed, e(0) for both sexes was greater in 1919 than in 1917.3 We now examine changes in the sex difference in e(0) before and after 1918. (On the merits of looking at absolute differences rather than ratios, see Sheps 1958 and 1959 and Keyfitz 1985: 60–62.)
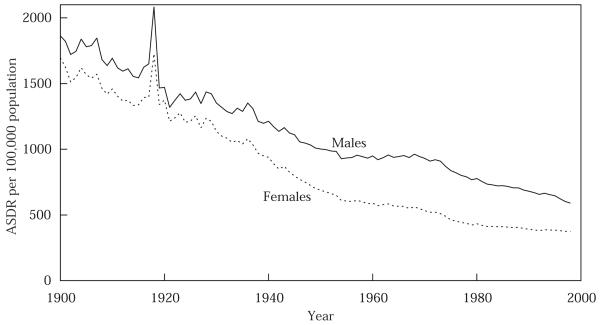
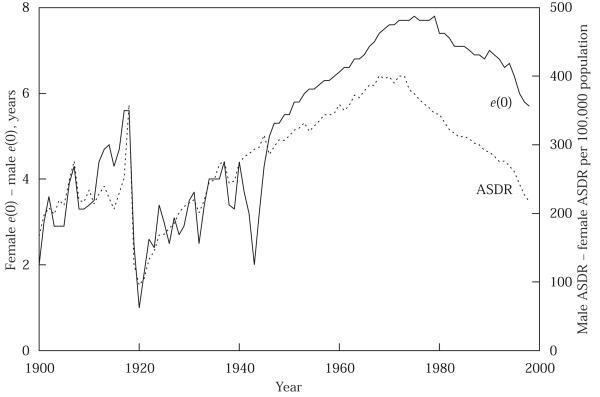
To provide a broad perspective on the impact of the 1918 flu epidemic, Figure 2 presents the evolution of life expectancy at birth, by sex, for 1900 to 1998. Figure 3 presents the evolution of the age-standardized death rate (ASDR), by sex, for the same years. The ASDR measures the crude death rate (deaths per 100,000 population) calculated by applying observed age-specific rates to the US standard population.4 Changes in e(0) need not track very closely changes in the ASDR.5 Figure 4 presents the absolute differences between male and female e(0) and ASDR for the same years. The results in Figure 4 are striking: by either measure, the 1918 influenza epidemic had a major impact on male-female differences in mortality. After 1918, the female mortality advantage in e(0) fell from 5.6 years to one year (the drop is the same whether comparing 1919 to 1917 or 1918); in ASDR the female advantage fell from over 350 per 100,000 to below 100. Females would not regain their pre-epidemic mortality advantage over males until the mid-1930s, or, if the reference point is the female advantage registered in 1917 and 1918, until the 1950s. The literature on sex differentials in mortality does not discuss this finding (see, for example, Retherford 1975; Preston 1976: 120–162, 1977; Berin, Stolnitz, and Tenenbein 1989).
FIGURE 2.
Expectation of life at birth, e(0), males and females, 1900–98
SOURCES: Grove and Hetzel 1968; Murphy 2000.
FIGURE 3.
Age-standardized death rate, ASDR (all causes), males and females, 1900–98
SOURCES: Grove and Hetzel 1968; Murphy 2000.
FIGURE 4.
Sex difference in expectation of life at birth, e(0) (left scale, female minus male), and sex difference in age-standardized death rate, ASDR (right scale, male minus female), 1900–98
To understand better the origin of these changes, we examined death rates by age and sex for 30 causes, representing around 80 percent of all registered deaths in the United States. The age-standardized death rate is useful here, because the ASDR for all causes is the sum of all cause-specific ASDRs.
The key role of tuberculosis
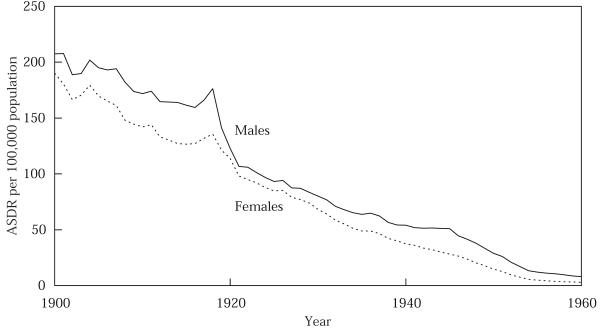
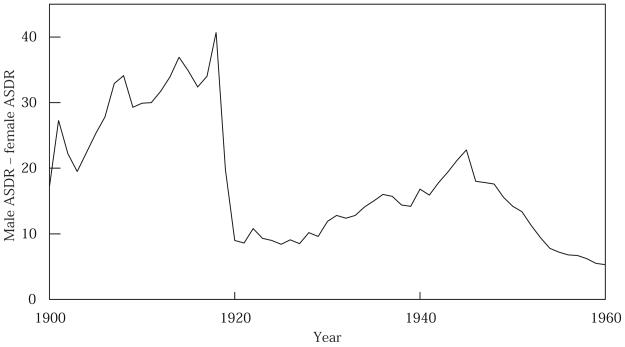
Figure 5 presents the age-standardized death rate for tuberculosis (all forms), by sex, for the United States, 1900–60; and Figure 6 presents the male–female absolute difference in ASDR for TB for the same time period. Two aspects of Figure 5 are already well known: TB death rates fell precipitously in the first half of the twentieth century; and males have higher TB death rates. (Note also that the 1918 epidemic interrupted the downward trend, causing a temporary upsurge in TB death rates.) When plotted by sex, the rates reveal a third major feature that has not previously been discussed in the literature: just after 1918, TB death rates experience their steepest decline of the century, and this decline is much more pronounced for males than for females. In 1921, the male ASDR for TB exceeded the female ASDR by only 8.6 per 100,000 (compared with a difference of 40.7 in 1918).
FIGURE 5.
Age-standardized death rate, ASDR, for tuberculosis (all forms), males and females, 1900–60
SOURCES: US Department of Health, Education, and Welfare 1956; Grove and Hetzel 1968.
FIGURE 6.
Sex difference in age-standardized death rate, ASDR, tuberculosis (all forms), 1900–60
SOURCE: Calculated from data in Figure 5.
Table 1 presents key data in numerical form, to complement the graphs. The raw data in the table are age-standardized death rates for males and females for several causes for the pre-epidemic year of 1917, for the epidemic year, and for 1921, when female mortality advantage began to rebound (as seen in Figure 4). The category “modified all causes” in Table 1 was calculated by subtracting violent causes and influenza and pneumonia from the data for all causes.6 Violence is excluded to concentrate on biological causes of death, and influenza and pneumonia are excluded in order to measure the indirect after effects of the 1918 epidemic. Including influenza and pneumonia, the sex difference in mortality fell after 1918 in part because the flu epidemic vanished. Between 1917 and 1921, the smoothed male-female differential of modified all causes fell from 92 to 25 per 100,000, a drop of 67 (Table 1). Tuberculosis alone dropped by 25 per 100,000, or 37 percent of the overall drop between 1917 and 1921 in the differential in age-standardized death rates, more than any other cause.
TABLE 1.
Age-standardized death rate per 100,000 population, males and females, selected causes
| 1917 |
1918 |
1921 |
Δ 1917–1921 |
|||||
|---|---|---|---|---|---|---|---|---|
| Raw | Smoothed | Raw | Smoothed | Raw | Smoothed | Raw | Smoothed | |
| All causes | ||||||||
| M | 1,650 | 1,540 | 2,085 | 1,504 | 1,318 | 1,432 | −332 | −107 |
| F | 1,398 | 1,398 | 1,727 | 1,393 | 1,213 | 1,264 | −185 | −134 |
| M – F | 252 | 214 | 358 | 173 | 105 | 111 | −147 | −103 |
| Influenza and pneumoniaa | ||||||||
| M | 193 | 207 | 672 | 235 | 108 | 154 | −85 | −53 |
| F | 156 | 184 | 498 | 216 | 96 | 144 | −60 | −39 |
| M – F | 38 | 21 | 174 | 18 | 12 | 12 | −26 | −9 |
| Violenceb | ||||||||
| M | 167 | 162 | 161 | 156 | 134 | 133 | −32 | −29 |
| F | 56 | 51 | 52 | 51 | 50 | 50 | −6 | −2 |
| M – F | 111 | 111 | 109 | 105 | 85 | 84 | −26 | −27 |
| Modified all causesc | ||||||||
| M | 1,290 | 1,283 | 1,252 | 1,248 | 1,076 | 1,091 | −215 | −192 |
| F | 1,186 | 1,184 | 1,177 | 1,171 | 1,067 | 1,067 | −119 | −117 |
| M – F | 104 | 92 | 75 | 67 | 8 | 25 | −95 | −67 |
| TBd | ||||||||
| M | 166 | 163 | 176 | 156 | 107 | 110 | −59 | −53 |
| F | 132 | 128 | 136 | 127 | 98 | 101 | −34 | −26 |
| M – F | 34 | 34 | 41 | 30 | 9 | 9 | −25 | −25 |
| Nephritise | ||||||||
| M | 137 | 133 | 125 | 125 | 105 | 112 | −32 | −21 |
| F | 110 | 103 | 101 | 101 | 96 | 99 | −14 | −4 |
| M – F | 27 | 27 | 25 | 24 | 10 | 13 | −18 | −14 |
| Strokef | ||||||||
| M | 126 | 123 | 120 | 120 | 114 | 118 | −12 | −4 |
| F | 125 | 123 | 123 | 123 | 121 | 123 | −5 | 1 |
| M – F | 1 | 1 | −3 | −3 | −7 | −6 | −7 | −7 |
| Heart diseaseg | ||||||||
| M | 229 | 224 | 221 | 219 | 205 | 211 | −24 | −13 |
| F | 200 | 200 | 204 | 200 | 192 | 199 | −8 | −2 |
| M – F | 29 | 21 | 17 | 16 | 12 | 13 | −16 | −9 |
| All otherh | ||||||||
| M | 632 | 629 | 609 | 609 | 545 | 545 | −87 | −84 |
| F | 619 | 619 | 614 | 609 | 561 | 561 | −59 | −59 |
| M – F | 13 | 5 | −5 | −5 | −16 | −9 | −29 | −14 |
NOTES: Raw data are age-standardized death rates per 100,000 population, from US Department of Health, Education, and Welfare 1956. Smoothed data were obtained by smoothing the entire dataset with the “3RSSH, twice” smoother (Tukey 1977). The M – F (male minus female) smoothed values are the smoothed differences, not the differences of the smoothed values.
Influenza and pneumonia combined, except pneumonia of newborn.
Motor vehicle accidents, other accidents, suicide, and homicide.
All causes, excluding violence and influenza and pneumonia (see text).
Tuberculosis, all forms.
Chronic nephritis (chronic and unspecified nephritis and other renal sclerosis).
Stroke (vascular lesions affecting central nervous system).
Diseases of the heart (does not include rheumatic fever).
Modified all causes, additionally excluding the above four causes.
Tuberculosis and influenza very likely interacted in 1918. Vital statistics cannot address this question well, because even if contributory causes are listed on the death certificate, a unique cause of death is recorded, a general problem that hinders cause-specific studies of death. Raymond >Pearl (1919) published individual-level data on influenza–TB co-infection in 1918 (the uniqueness of the 1918 virus makes it important to have contemporary data). We have reanalyzed these data using logistic regression, and found that TB infection was a significant risk factor for contracting influenza.7 This analysis was conducted among persons classified as having no other cases of influenza in the household, so it measures community-acquired influenza infection. The different rates of disease progression for the two pathogens minimize reverse causality. Pearl's dataset as published is not perfect: there are no controls for age, sex, or socioeconomic status, and the sampling frame is households with at least one case of tuberculosis (though data on all household members were collected). Only white households were surveyed. Despite these shortcomings, cautious use of Pearl's dataset is justified because it is the only source of contemporary microdata on TB and influenza that we have found after an extensive search.
We conjecture that many influenza deaths in 1918 took place among the tuberculous—persons with clinical disease or latent infection with Mycobacterium tuberculosis. That the 1918 influenza virus, known to be atypical, should interact pathologically with M. tuberculosis seems likely.8 Influenza and TB are not strongly linked in the medical literature, though there are some clinical references to interactions (e.g., Couch 1981). The age pattern of the 1918 flu means that TB and influenza overlapped much more than usual. Seemingly no one was invulnerable to the 1918 flu, and we know that TB prevalence was high in 1918, even among some ostensibly healthy individuals (if we include those in whom infection was latent). The influenza–tuberculosis interaction need not be a molecular phenomenon (i.e., involving some direct interaction between the TB bacillus and the influenza virus). The secondary pneumonia that occurs as a complication of influenza infection could be exacerbated by active tuberculosis or by tubercular lesions in the case of latency. Virtually all influenza deaths involved the lungs, an important site of pathology for tuberculosis.
An influenza–tuberculosis nexus is consistent with what is known about the 1918 epidemic, including the high fatality rate and the W-shaped mortality age profile, and it helps explain the sex differentials we observe. The deadliness of the epidemic seems less extreme if we consider that many victims also had TB. Excess male flu mortality is consistent with the differential incidence of TB by sex. The fact that flu deaths had a mode in the 25–34 age group is also strongly indicative of a TB interaction; TB is a disease of adulthood, not of old age.9 In the natural history of TB infection, progression to clinical disease may take place years after initial infection with the TB pathogen (Bloom and Murray 1992; Murray, Styblo, and Rouillon 1993). At any given time, there is a pool of active and latent TB cases from which future TB deaths are drawn. The diminution of this pool by a selective effect such as death from influenza will reduce the incidence of TB deaths in subsequent years.
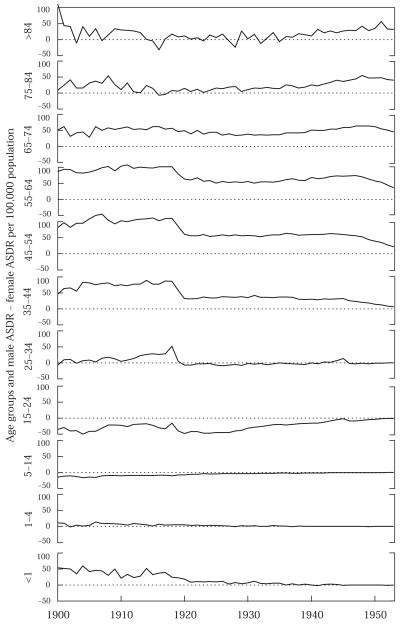
The age-standardized death rate alone is a blunt measure; a sufficiently large rate change in any age group could alter the ASDR. The selection hypothesis predicts that the narrowing of post-1918 male–female differences in TB mortality is due to drops in male TB death rates at the ages especially affected by the flu epidemic. Figure 7 shows sex differentials in TB death rates, with each panel of the figure representing a successive age group. This collection of graphs can be seen as a “rough cut” of a Lexis surface. The panels, each drawn with the same scale to permit comparison, represent a third dimension, the other two dimensions being period (the horizontal axes) and death rate (the vertical axes). Thus, in Figure 7 we have information by age and calendar year; true cohort data would be preferable but are unavailable. The decline in the male–female difference in TB death rates occurs only in the age range 15–64 years. Among those 65 years and older and below 15 years, there is very little change in the sex differential in TB mortality; the most pronounced effects are at ages 25–54. For age groups 15–64, we see a sudden and sustained drop in the sex differential of TB mortality after 1918, because male rates drop faster than female ones. Females have higher TB death rates at ages 5–24. However, males' drop relative to females' is not limited to age groups where their death rate from TB exceeds females'. Interestingly, following 1918, in the 25–34-year age group, among whom influenza death rates show a peak, men and women experienced near parity in TB death rates, as if starting with a clean slate (Figure 7). Changes in TB death rates below age five years reflect recent transmission of the bacillus, and are not illustrative of the effects we consider. The effects we observe are not driven by race: nonwhites have much higher TB death rates than whites, but qualitatively there is no difference in the observed patterns.
FIGURE 7.
Male minus female age-specific death rates, ASDR (per 100,000 population), for tuberculosis (all forms), 1900–53
NOTE: Each panel has identical scale.
SOURCE: US Department of Health, Education, and Welfare 1956.
There is a modest rise in males' excess TB mortality centered at 1945 (Figures 5 and 6). This effect is driven by changes in the 15–34-year age groups (Figure 7), which is consistent with the selection effect, since the corresponding cohorts were largely untouched by the 1918 epidemic. If the “normal” pattern by sex is for men to have higher TB mortality rates, then the effect observed around 1945 could be seen as a temporary return to the status quo ante, after the effects of the 1918 epidemic had worn off and before TB death rates declined to very low levels.10
For two years after 1918, pulmonary tuberculosis as a percent of all TB deaths among males declined, from 86.6 percent to 85.2 percent. This is a relatively small decline, but the denominators are large: over 50,000 male TB deaths each year. Importantly, the general trend is toward pulmonary TB becoming more prominent, and the percentage of pulmonary TB among women did not decline after 1918. Because this decline is a short-term (two-year) phenomenon, it is more difficult to assess whether this is another consequence of the 1918 flu epidemic. There were three nonpulmonary TB forms for which male death rates increased but female rates did not: tubercular meningitis, Pott's disease (tuberculosis of the vertebral column), and tuberculosis of other organs. The increased importance of nonpulmonary TB for males but not for females suggests that the lungs as a shared site of pathology for TB and influenza may have played a role in the diseases' interaction. Specifically, if pulmonary tuberculosis made one more likely to die from influenza-induced pneumonia, then having nonpulmonary TB would be less of a risk factor for flu death; consequently, in the years after 1918, death rates for nonpulmonary forms of TB as a proportion of all TB deaths would increase, even if this reverses the secular trend of pulmonary TB being increasingly important.
If the pre-1918 trends in male and female age-specific death rates from TB had continued through 1932, the death registration area of the United States would have observed 500,000 more TB deaths than it actually did. In this counterfactual analysis, we fitted a quadratic trend to age-specific TB death rates, 1900–17, for each age group above age five years. We projected these trends forward and calculated absolute numbers of deaths that would have resulted, which were then compared to the true death tallies. This exercise demonstrates that the magnitude of the post-1918 shift in the trend of TB death rates is not too large to have been caused by the 1918 influenza epidemic.11 That is, it would be surprising if the magnitude of the ostensible selection effect (the number of influenza deaths) did not have some concordance with the consequences (the shift in the TB trend).
Consider the above findings from the point of view of tuberculosis epidemiology as opposed to influenza epidemiology. The approximately 50,000 male TB deaths observed each year during the late 1910s correspond to approximately 300,000 male active TB cases in the United States at any given time (this estimate is based on data in Murray, Styblo, and Rouillon 1993: 238 and Lowell 1969: 17). Furthermore, the post-1918 reductions in the number of TB deaths, compared to extrapolation of the pre-1918 trend, do not need to be precisely accounted for by the toll of the 1918 influenza epidemic. This is because of the cumulative effect of the shrinking number of tuberculous persons in the population. Tuberculosis is spread by those who have tuberculosis, so the accounting work should be done in light of a declining, not fixed, population of tuberculous individuals. Given the fact that many men in this period must have gotten TB from other men, such as those in the workplace, the cumulative effect on TB mortality would have reinforced the selection effect. Thus, the cumulative effect is consistent with the hypothesis that the 1918 flu epidemic's excess male mortality was disproportionately among tuberculous males.12
From a biological perspective, the link between influenza and TB may include a third pathogen. Tuberculosis infection causes lung cavities to form, which become a breeding ground also for non-TB bacteria, including Staphylococcus aureus. This would have had the effect of priming tuberculous individuals for S. aureus superinfection in the event of co-infection with influenza. It is highly plausible that TB infection laid the ground for the massive secondary bacterial pneumonias that killed the victims of the flu in 1918.
The role of other causes of death
The role of nontuberculosis causes of death in the overall decline in the male–female mortality differential after 1918 is less clear. Throughout the first half of the twentieth century, infectious disease death rates fell toward zero for both sexes, and so there is necessarily a tendency for the sex differential in absolute terms to decline. At the same time, death rates for heart disease, a major determinant of the overall death rate, rose and became more masculine, so women did not lose their advantage in the longer term. It took until the 1930s for female mortality advantage to return to its pre-1918 level. As seen in Figure 4, females began regaining their pre-1918 mortality advantage in 1920. But it took over ten years to regain the level of advantage prevailing in the first decade of the century and well over 20 years to reach and surpass the advantage registered in 1917–18. The factor (or factors) that depressed females' mortality advantage post-1918 were not persistent, but represented a temporary shock.
The cause that accounts for the second-highest share in the decline of the male–female mortality differential between 1917 and 1921 (14 per 100,000 in Table 1, or 21 percent of the drop in the modified all causes category) is chronic nephritis, a notoriously inaccurate death code (Dublin and Kopf 1913; Preston 1976: 6). Even if coded correctly, there are multiple etiologies leading to death from this cause (including M. tuberculosis). Stroke accounts for 10 percent of the fall in that differential during the period (7 per 100,000 in Table 1), due to the peculiar fact that from 1918 to 1925 females had higher age-standardized death rates for stroke than males. After 1925, mortality from stroke among males again became higher than among females, as was the case prior to 1918.13 Heart disease accounts for 13 percent of the observed decline (9 per 100,000 in Table 1). This cause is concentrated in older ages, and both sexes experienced a temporary drop in death rates from heart disease, but the drop was greater among males than among females after 1918. It is plausible that 1918 flu deaths reduced subsequent heart disease deaths, again through a selection effect. The diminution of the magnitude of TB transmission after 1918 (observable, for example, in the drop in childhood TB death rates) may have had secondary effects also on other diseases. The posited key role of TB in reducing the post-1918 male–female mortality differential is strengthened when causes of death other than TB are also examined, because, unlike with TB, no clear pattern emerges from these causes of death.
We emphasize that the highly unusual mortality age pattern of the flu deaths in 1918 (Figure 1) not only corroborates the connection with tuberculosis, which, as noted above, was a disease of adulthood in 1918, but also rules out causal connections between flu deaths and most other causes of death. For example, stroke is overwhelmingly a cause of death among the elderly. It is highly unlikely that the 10 percent contribution of deaths from stroke to the drop in the total male–female differential of mortality between 1917 and 1921 is causally related to influenza, as those who died of flu in 1918 were not susceptible to stroke in the years immediately following the epidemic. The reverse is true with tuberculosis, where the middle of the W-shape of flu death rates (Figure 1) coincided with the peak ages of TB death rates in the years following 1918.
Conclusion
Some of the huge losses of life resulting from the 1918 influenza epidemic were, in some sense, borrowed against future deaths from tuberculosis. Although males suffered more than females from the heightened death rates during the flu epidemic, males' life expectancy rebounded faster in the two years immediately after 1918. This is a selection effect, or what Hobcraft, Menken, and Preston (1982) called a “cohort inversion” effect. Stated succinctly, the robustness of a cohort in the face of death can increase over age and time (up to a point), because of a shift in the unobserved heterogeneity among mortality risk factors. In the present case, the selecting mechanism was sex-differential mortality resulting from the 1918 influenza epidemic, and the unobserved (at the time) shift in risk factors was a decreased prevalence of tuberculosis infection, also differentially affecting males and females.
These results have much to teach us. The details of the epidemiologic transition (Omran 1971) are sex specific. Epidemiologic shocks can have long-term effects on mortality differentials by sex if they act as a selecting mechanism. A result of this kind has not previously been documented in the demographic literature. Our study does so for the United States; exploration of the effect elsewhere would be worthwhile. This requires accurate mortality data, detailed by age and sex and cause, from the period both before and after 1918. The non-belligerent European countries during World War I, as well as Canada, Japan, Australia, New Zealand, and South Africa, may provide fertile ground for further investigation.
If another pandemic of hyper-virulent influenza were to appear, it is possible that the United States, where since 1918 the prevalence of tuberculosis has been reduced dramatically, would not suffer as greatly as before. This is because some of the peculiar and intense middle-age mortality from influenza observed in 1918 appears to be related to prior tuberculosis infection. On the other hand, developing countries, where TB is still highly prevalent (Dye et al. 1999), would be vulnerable and very likely would subsequently experience appreciable changes in male–female mortality differentials.
Acknowledgments
The authors acknowledge the support of the Rockefeller Foundation, grant number HS-9810. David Bloom, Leo Goodman, Ulrich Mueller, Ndola Prata, George Rutherford, Ross Stolzenberg, and Kenneth Wachter provided useful comments.
Footnotes
The reference is to the male minus female difference in the age-standardized death rate for influenza and pneumonia combined (except pneumonia of the newborn). By comparison the difference was 38 per 100,000 in 1917 and 13 per 100,000 in 1919.
All data presented here come from published vital statistics volumes. See Grove and Hetzel (1968) and US Department of Health, Education, and Welfare (1956). Before 1932, mortality statistics refer to the death registration area, not the entire country; in 1918, about 77 percent of the population of the United States was included in the death registration area (Linder and Grove 1943: 998).
Overseas war deaths are excluded from both the numerator and denominator of vital rate calculations (Grove and Hetzel 1968: 50).
The US standard population is the enumerated population of 1940, both sexes, all races. It is given in Grove and Hetzel (1968: 37).
This was the case in the 1940s, for example. A change in age-specific mortality rates affects the life table population (from which e(0) is calculated) at that and all subsequent ages, so e(0) is more sensitive than the ASDR to young mortality, except in cases where the standard population is weighted toward young ages. In the 1940s in the United States, male death rates attributable to childhood diseases improved more than female death rates, with improvements in both sexes possibly resulting from the introduction of antibiotic drugs or from wartime food rationing, which is redistributive (Drèze and Sen 1989: 181). This change affected e(0) more than it did the ASDR.
Violent causes are: motor vehicle accidents, other accidents, suicide, and homicide. Influenza and pneumonia are listed as a single cause and exclude pneumonia of the newborn.
Analyzing Pearl's table 1, with influenza infection as the dependent variable, the logit coefficient for TB was 0.79 (odds ratio 2.2), controlling for household size (p<0.0005). In other words, among those living in a household with at least one case of active tuberculosis, the odds of getting influenza (i.e., the probability of getting influenza divided by the probability of not getting influenza) were 2.2 times higher for actively tuberculous individuals, compared to nontuberculous individuals in the household. A random sample of households would be preferable to a sample in which each household has at least one known case of TB. However, Pearl did not design the study from the ground up; he was trying to make use of some routine data collected about tuberculous persons.
The analysis of Pearl's dataset is consistent with an interaction inside the body between the two pathogens. However, there are alternative explanations for the risk factor demonstrated in that analysis, such as occupational exposure to many other people and thus the increased likelihood of having contracted TB in the past as well as contracting influenza in 1918. Tuberculosis kills slowly, and in spite of public health campaigns not all those infected would have stayed away from work.
This was particularly true in the period we consider. In 1905, 1908, 1910–12, and 1915–20, TB death rates peaked at ages 25–34. In 1906–07 and 1909, non-infant TB death rates peaked in the 25–34 age group; in 1913–14, TB death rates peaked in the 35–44 age group. And in 1921–34, TB death rates had a mode in the 25–34 age group. After 1934, reflecting the changing epidemiology and demography of TB, death rates shifted to a unimodal profile, peaking at older ages.
One caveat is the possible effect on TB death rates of American involvement, 1941–45, in World War II. This is hard to assess. Overseas servicemen, as noted earlier, are not included in the vital statistics system of the United States, and TB deaths can take place years after infection.
The exact agreement of excess TB deaths in the analysis with the estimates of the number dead in the 1918 epidemic might be a coincidence, but it is interesting to note that the two figures have the same order of magnitude.
The observation by Drolet (1942: A47), that in rural areas of the United States the sex differential of TB mortality was smaller than in urbanized areas, also points to the importance of transmission in the workplace.
Although the reversal in sign of the male–female ASDR differential for stroke lasted from 1918 to 1925, male rates were barely above female rates for stroke in 1917, whereas in 1916 and before men had a consistently higher ASDR for stroke. Whatever happened to the male–female differential in stroke death rates began in 1917, not in the year of the influenza epidemic.
References
- Berin BN, Stolnitz GJ, Tenebein A. Mortality trends of males and females over the ages. Transactions of the Society of Actuaries. 1989;41:1–19. [Google Scholar]
- Bloom BR, Murray CJL. Tuberculosis: Commentary on a reemergent killer. Science. 1992;257(5073):1055–1064. doi: 10.1126/science.257.5073.1055. [DOI] [PubMed] [Google Scholar]
- Couch RB. The effects of influenza on host defenses. Journal of Infectious Diseases. 1981;144(3):284–291. doi: 10.1093/infdis/144.3.284. [DOI] [PubMed] [Google Scholar]
- Crosby A. America's Forgotten Pandemic: The Influenza of 1918. Cambridge University Press; Cambridge: 1989. [Google Scholar]
- Davis K. The Population of India and Pakistan. Princeton University Press; Princeton: 1951. [Google Scholar]
- Drèze J, Sen A. Hunger and Public Action. Clarendon Press; Oxford: 1989. [Google Scholar]
- Drolet GJ. Epidemiology of tuberculosis. In: Goldberg B, editor. Clinical Tuberculosis. F. A. Davis; Philadelphia: 1942. pp. A3–A70. [Google Scholar]
- Dublin LI, Kopf EW. An experiment in the compilation of mortality statistics. Publications of the American Statistical Association. 1913;13:639–647. [Google Scholar]
- Dye C, et al. Global burden of tuberculosis: Estimated incidence, prevalence, and mortality by country. Journal of the American Medical Association. 1999;282(7):677–686. doi: 10.1001/jama.282.7.677. [DOI] [PubMed] [Google Scholar]
- Grove RD, Hetzel AM. Vital Statistics Rates in the United States, 1940–1960. National Center for Health Statistics; Washington, DC: 1968. [Google Scholar]
- Hobcraft J, Menken J, Preston S. Age, period, and cohort effects in demography: A review. Population Index. 1982;48(1):4–43. [PubMed] [Google Scholar]
- Keyfitz N. Applied Mathematical Demography. Second edition Springer-Verlag; New York: 1985. [Google Scholar]
- Linder FE, Grove RD. Vital Statistics Rates in the United States, 1900–1940. US Government Printing Office; Washington, DC: 1943. [Google Scholar]
- Lowell AM. Tuberculosis morbidity and mortality and its control. In: Lowell AM, Edwards LB, Palmer CE, editors. Tuberculosis. Harvard University Press; Cambridge, MA: 1969. pp. 1–121. [Google Scholar]
- Murphy SL. Deaths: Final data for 1998. National Vital Statistics Reports. 2000;48(11):1–108. [PubMed] [Google Scholar]
- Murray C, Styblo K, Rouillon A. Tuberculosis. In: Jamison DT, et al., editors. Disease Control Priorities in Developing Countries. Oxford University Press; Oxford: 1993. pp. 233–259. [Google Scholar]
- Omran AR. The epidemiologic transition: A theory of the epidemiology of population change. Milbank Memorial Fund Quarterly. 1971;XLIX(4 part 1):509–538. [PubMed] [Google Scholar]
- Oxford JS, et al. Who's that lady? Nature Medicine. 1999;5(12):1351–1352. doi: 10.1038/70913. [DOI] [PubMed] [Google Scholar]
- Pearl R. Preliminary note on the incidence of epidemic influenza among the actively tuberculous. Publications of the American Statistical Association. 1919;16(128):536–540. [Google Scholar]
- Preston SH. Mortality Patterns in National Populations: With Special Reference to Recorded Causes of Death. Academic Press; New York: 1976. [Google Scholar]
- Preston SH. Mortality trends. Annual Review of Sociology. 1977;3:163–178. [Google Scholar]
- Pyle GF. The Diffusion of Influenza: Patterns and Paradigms. Rowman & Littlefield; Totowa, NJ: 1986. [Google Scholar]
- Reid AH, Fanning TG, Hultin JV, Taubenberger JK. Origin and evolution of the 1918 ‘Spanish’ influenza virus hemagglutinin gene. Proceedings of the National Academy of Sciences of the USA. 1999;96(4):1651–1656. doi: 10.1073/pnas.96.4.1651. [DOI] [PMC free article] [PubMed] [Google Scholar]
- Reid AH, Fanning TG, Janczewski TA, Taubenberger JK. Characterization of the 1918 ‘Spanish’ influenza virus neuraminidase gene. Proceedings of the National Academy of Sciences of the USA. 2000;97(12):6785–6790. doi: 10.1073/pnas.100140097. [DOI] [PMC free article] [PubMed] [Google Scholar]
- Retherford RD. The Changing Sex Differential in Mortality. Greenwood Press; Westport, CT: 1975. [Google Scholar]
- Sheps MC. Shall we count the living or the dead? New England Journal of Medicine. 1958;259(25):1210–1214. doi: 10.1056/NEJM195812182592505. [DOI] [PubMed] [Google Scholar]
- Sheps MC. An examination of some methods of comparing several rates or proportions. Biometrics. 1959;15:87–97. [Google Scholar]
- Tukey JW. Exploratory Data Analysis. Addison-Wesley; Reading, MA: 1977. [Google Scholar]
- US Department of Health, Education, and Welfare . Vital Statistics–Special Reports. Vol. 43. National Office of Vital Statistics; Washington, DC: 1956. Death rates by age, race, and sex, United States, 1900–1953: Selected causes. [Google Scholar]


