Abstract
Voltage-gated proton channels are found in many different types of cells, where they facilitate proton movement through the membrane. The mechanism of proton permeation through the channel is an issue of long-term interest, but it remains an open question. To address this issue, we examined the temperature dependence of proton permeation. Under whole cell recordings, rapid temperature changes within a few milliseconds were imposed. This method allowed for the measurement of current amplitudes immediately before and after a temperature jump, from which the ratios of these currents (Iratio) were determined. The use of Iratio for evaluating the temperature dependence minimized the contributions of factors other than permeation. Temperature jumps of various degrees (ΔT, −15 to 15°C) were applied over a wide temperature range (4–49°C), and the Q10s for the proton currents were evaluated from the Iratios. Q10 exhibited a high temperature dependence, varying from 2.2 at 10°C to 1.3 at 40°C. This implies that processes with different temperature dependencies underlie the observed Q10. A novel resistivity pulse method revealed that the access resistance with its low temperature dependence predominated in high temperature ranges. The measured temperature dependence of Q10 was decomposed into Q10 of the channel and of the access resistances. Finally, the Q10 for proton permeation through the voltage-gated proton channel itself was calculated and found to vary from 2.8 at 5°C to 2.2 at 45°C, as expected for an activation enthalpy of 64 kJ/mol. The thermodynamic features for proton permeation through proton-selective channels were discussed for the underlying mechanism.
INTRODUCTION
Proton transfer across biological membranes is performed by various types of membrane proteins, including pumps, transporters, and channels. Of these, channels are the most efficient pathway for ion transfer. The voltage-gated proton channel described initially in snail neurons (Thomas and Meech, 1982) had activation gating at depolarized potentials similar to most of the voltage-gated cation channels. The proton channel is almost perfectly selective for protons. These channels have been found in many types of cells, including phagocytes (e.g., microglia), osteoclasts, and epithelial cells. Fast proton transfer is thought to be a prerequisite to cellular processes, such as phagocytosis (Henderson et al., 1987).
The whole cell currents of the voltage-gated proton channel exhibit an unusually high temperature dependence (Byerly and Suen, 1989; Kuno et al., 1997; DeCoursey and Cherny, 1998). The high Q10s (three to five) of the measured currents have been related to temperature dependence of proton permeation (DeCoursey and Cherny, 1998), which further suggests that protons may permeate through the channel with “unusually” high temperature-dependent processes compared with those of other types of channels (DeCoursey, 2003). This conjecture, however, still remains an open question because features of the proton channel have made quantitative evaluations of the temperature dependence difficult. Among other things, the single-channel conductance of the proton channel is of the order of femto Siemens (Cherny et al., 2003), so that an evaluation of changes in conductance necessitates whole cell recordings. We have observed, however, that the proton currents vary in amplitudes, even at a fixed temperature (Morihata et al., 2000a). This phenomenon can be explained by an alteration in the number of activatable channels upon repeated application of depolarization pulses being compatible with the results observed for other types of membrane proteins (Morgan et al., 2003). These features of the channel raise concerns as to whether the reported temperature dependence actually reflects that of permeation through the channel.
To address the permeation issues of proton channels, the consideration of the physicochemical principles for proton transfer is crucial. In bulk solution, proton transfer is characterized by the Grotthuss mechanism (de Grotthuss, 1806; Eigen, 1964; Agmon, 1995, 1996, 1999; Robinson and Stokes, 2002; Swanson et al., 2007) and buffered diffusion (Eigen et al., 1964; Keener and Sneyd, 1998; Swietach et al., 2003; Zifarelli et al., 2008). These additional “proton-specific” factors modify channel access resistance, the concentration polarization at the cell membrane, and changes in ion concentration in the cytosol, factors expected to affect the properties of ion permeation through all types of channels. Each issue has been studied separately (DeCoursey and Cherny, 1996; Gordienko et al., 1996), but the findings have not been integrated to produce a picture of the whole process of proton permeation. For example, the magnitudes of the measured currents may be determined, in part, by proton-transfer processes outside the channel molecule, and the proton fluxes may cause local concentration changes (decreases at the “upstream” membrane–solution interface and increases at the “downstream” membrane–solution interface). These interrelated issues should be treated in a systematic manner with quantitative evaluation. To this end, the theoretical basis for the proton-transfer processes was reviewed to estimate the relative contributions of proton-transfer events, which were exploited for the experimental design.
Experimental strategy
Protons are transferred from the bulk solution to the channel entrance through the access region, which induces depletion of protons upstream and accumulation downstream in the bulk, in the vicinity of the membrane, and at the channel entrance. These events, which develop with spatially different scales, are termed as the bulk concentration change, concentration polarization, and access resistance. For the proton channels, experiments were performed in the presence of low concentrations of protons and high concentrations of buffer. The latter was a prerequisite as a resource of the proton reservoir, which helps the proton flux to endure under the limited supply from the patch pipette. Even if the high concentration buffer facilitates proton transfer in bulk solutions (Keener and Sneyd, 1998), the persistent efflux eventually leads to cytosolic depletion of the proton concentration (concentration polarization and depletion of the cytosolic concentration) (Gordienko et al., 1996). Recently, local changes in proton concentration were estimated by Zifarelli et al. (2008) using a simulation technique at low buffer concentrations. Following their method, we estimated the time courses of the concentrations in our highly buffered experimental conditions (see Appendix). The changes of pH at the vicinity of the membrane during maximum currents in our experiments were negligible, and their time courses were several tens of milliseconds. These predictions, especially for the time order of development, were important considerations for experimental design.
To address the proton-transfer process at the molecular level, the concentration profiles of protons treated with a one-dimensional regimen are no longer valid (Berg and Purcell, 1977). At the pore entrance, proton fluxes converge and proton depletion develops locally when the transfer of ions within the pore occurs at a faster rate than diffusion toward the pore. This diffusion-limited process in the vicinity of the pore and the convergence of ion trajectories toward the narrow pore opening lead to additional resistance outside the channel pore (access resistance [RAR]) (Hille, 1968; Hall, 1975; Läuger, 1976; Andersen, 1983; Hladky, 1984; Peskoff and Bers, 1988; Aguilella-Arzo et al., 2005). The theory estimated that the development of the access resistance is very fast (10−10 s; see Appendix) (Crank, 1975) compared with the accessible speed of electrophysiological measurements (see Appendix).
Each of these proton-specific issues developing outside of the channel should contribute somewhat to the measured proton currents. We focused on the large discrepancies in time scale for the development of each event. The concentration polarization and bulk depletion develop on the order of a second or slower. Therefore, if we change the temperature of the channel in a rapid stepwise manner and measure the changes in proton current immediately before and after the step, the measured current changes are little affected by slowly developing events. In the present study, stepwise changes in temperature for a cell undergoing whole cell current recording were applied within a few milliseconds by the pulse method (Ando et al., 2005). This rapid system enabled experiments in a wide temperature range and repeated applications of temperature changes for a single cell under patch clamp. Furthermore, the temperature changes were rapid enough to minimize changes in the gating status because the voltage-gated proton channel exhibits slow activation gating (several tens or hundreds of milliseconds).
The next issue to be addressed was to determine the contribution of the access resistance to the total resistance. The access resistance grows with a time constant of 10−10 s and cannot be discriminated by the “rapid” temperature change method. Here, we exploited the facts that (1) RAR changes with the resistivity of the bulk solution (Hall, 1975), (2) RAR for the extracellular side can be changed by perfusing extracellular solution, and (3) changes in RAR leads to changes in Rtotal. Therefore, measuring changes in Rtotal upon perturbation of the extracellular solution would provide estimates of the relative contribution of RAR to Rtotal. We applied a resistivity pulse method and estimated the ratio of RAR to RCh, the value of which was used to decompose the temperature dependence of the proton channel.
With all appropriate caveats in mind, the native proton channel expressed in microglial cells was examined. We have elucidated the temperature dependence of proton permeation through the voltage-gated proton channel.
MATERIALS AND METHODS
Electrophysiology
Rat microglia (GMI-R1) (Sawada et al., 1998) were cultured in Dulbecco’s modified Eagle’s medium supplemented with granulocyte/macrophage colony-stimulating factor, glucose, and insulin. Whole cell recordings were performed with an AxoPatch 200B amplifier (MDS Analytical Technologies). Currents were filtered at 1 kHz and sampled at 5 kHz with DigiData1322A (MDS Analytical Technologies). The pipette solution contained 120 mM Mes, 65 mM NMDG aspartate, 3 mM MgCl2, 1 mM BAPTA, and 1 mM Na2ATP, pH 5.5–6.2. The extracellular solution contained 100 mM HEPES, 75 mM NMDG aspartate, 1 mM CaCl2, 1 mM MgCl2, and 50 µM 4,4’-diisothiocyanatostilbene-2,2’-disulphonic acid (DIDS). The pH (7.3) was adjusted by CsOH. Pipette resistances ranged between 5 and 15 MΩ.
Estimation of the shift of the reversal potential
The reversal potentials (Vrevs) were estimated from two methods, one from the I-V curve and another from current measurements at two different membrane potentials. The I-V curves were obtained as follows. Ramp potentials were applied at the end of a long depolarization pulse and at the end of a mock 10-ms depolarization pulse. Ramp current traces after the long depolarization pulse were subtracted by those for a mock 10-ms depolarization pulse. In the second method, Vrev was estimated from the current amplitudes at two different membrane potentials. Proton currents were elicited by a depolarization pulse to 0 mV (VDepo), and then repolarized to −40 mV (VTail). The reversal potentials were interpolated from the current amplitudes at the end of the depolarization pulse (IDepo) and at the peak of the tail current (ITail) using the following equation.
| (1) |
Temperature pulse experiments
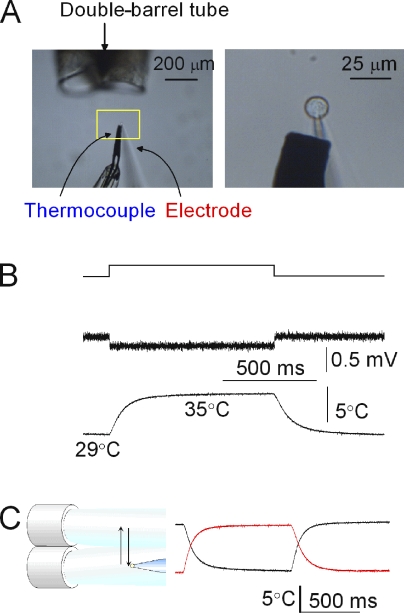
A rapid temperature pulse system was built with the ultrafast solution-switching system (LSS-3200; EXFO) equipped with a double-barreled tube from which solutions of different temperatures were perfused (Fig. 1 A). The system (Ando et al., 2005) included (1) a piezoelectric device (LSS-3200; EXFO) to shift the outflow, (2) a double-barreled tube (the temperatures of the outflows were controlled independently), (3) a patch-clamped microglia, and (4) an ultrafine thermocouple (ANBE SMT Ltd.). Two solutions of different temperatures flowed at rates of 3–6 µl/s (an injection pump; TE-221; Terumo). A voltage-clamped microglial cell was placed in the midst of one of the outflows. The tube was shifted by the piezoelectric device, by which the cell was perfused with different temperatures. The positions of the tube were reversed after 1 s. The movements of the piezoelectric device (200 µm) were controlled by pClamp software so as to coincide with the voltage command. The driving voltages for the piezoelectric device were started and terminated with a finite slope to dampen the mechanical oscillations produced by the movements. This method allowed repeated brief applications of both warming and cooling jumps.
Figure 1.
Temperature jump experiments. (A) The experimental setup. (Left) A photograph of the temperature pulse system. Solutions with different temperatures flowed from the double-barreled tube. A voltage-clamped microglial cell was placed close to one of the outflows. The piezoelectric device was driven by 5-V pulses, which were triggered by a program simultaneously controlling the membrane potential. (Right) An enlarged photograph for a patch-clamped cell and an ultrafine thermocouple located as close as 15 µm downstream of the cell. (B) Temperature measurements. (Top) The voltage drive for the piezoelectric device. (Middle) Temperature measured by a liquid junction potential using an open-tip electrode under current clamp mode. (Bottom) Temperature monitored by an ultrafine thermocouple. (C) Temperature measurements during the shift of the outflow from the double-barreled tube. Reversals of the shift motion and the responses of the thermocouple were recorded. The traces for 1-s pulses for reverse directions were mirror images of each other, indicating that the fast changes of temperature during a pulse were detected by the ultrafine thermocouple.
Double-barreled tube
The double-barreled tubes for the perfusing solutions were made of copper pipe (length, 100 mm; diameter, 1 mm) for better heat conduction. The surface of the copper pipe was silanized (Siliconise L-25; Nacalai Tesque, Inc.). A small Peltier device (5 × 5 mm; Miniature Module; Ferrotec Corp.) was mounted on a copper plate at the base of each tube. The two Peltier devices were controlled independently by a constant current source (PD18-10A; Regulated DC Power Supply; Kenwood). The pipes were insulated by tubing (Tygon) and were bundled in parallel with epoxy resin. A fine-fused silica tube coated with polyimide (MicroFil; WPI) was attached to the tip of the copper pipe to define a small outlet of fixed size (inner diameter of the tip, 250 µm). The temperatures of the outflow monitored by the ultrafine thermocouple reached the steady state within a minute when the driving currents for the Peltier device were changed.
Evaluation of temperature changes
The local temperatures in the vicinity of the cell were monitored by an ultrafine thermocouple with a thermometer (BAT-12; Physitemp Instruments Inc.). The thermocouple with the tip size of 26 µm (ANBE SMT Ltd.) was insulated in a glass capillary with the fine tip exposed. The thermocouple was calibrated before use with a standard thermister.
Time courses of the temperature changes upon the jumps were monitored by the changes of the liquid junction potentials (Fig. 1 B, middle). An open-tip electrode filled with 3 M KCl was placed in the midst of the flow, and the liquid junction potentials were measured under the current clamp mode. Positive pressure was applied continually to the pipette to prevent the mixing of the solutions. The changes in temperature upon the shift of the flow were measured with a time constant of 0.9 ms.
The responses of the ultrafine thermocouple were evaluated under the temperature jump experiments. Output of the thermocouple is shown (Fig. 1 B, bottom trace), which was fitted by a single-exponential function with the time constant of ∼70 ms. After a pulse, the temperature returned to the prepulse level within the error of 0.5%. To see whether the temperature signal from the thermocouple reached the steady state during a 1-s pulse, the sensor tip was placed in the outflows for minutes and the signal levels before and during a pulse were compared (Fig. 1 C, red trace). Conversely, the sensor tip was placed in the high temperature outflow for minutes and the temperature outflow was jumped to the low temperature for a second (Fig. 1 C, black trace). The responses to the shifts of the outflows in the opposite direction looked like mirror images of each other, indicating that the temperatures during the short jumps reached the steady-state values and were maintained there.
In addition to the changes in current amplitudes at different temperatures, the driving forces may be affected by several physicochemical factors. The temperature dependence of the Nernst potential and intracellular and extracellular pH changes by altered pKa values for buffers were evaluated (see Appendix in detail). These factors develop instantaneously, but the theoretical prediction indicates that the contributions of these factors are negligible.
Evaluation of temperature dependence
The temperature coefficient for a 10° change in temperature, Q10, is defined from current ratios as Iratio(ΔT)10/ΔT, where Iratio(ΔT) is the temperature coefficient for an arbitrary temperature interval ΔT. Q10 as a function of the measured temperature was evaluated in several different ways. For the jump vector plot, a slope for each temperature jump vector was calculated. Q10 of the conductivity for the buffered solution was analyzed by the following method. Temperature-dependent conductivity was plotted and a slope was calculated by a linear fit of five neighboring data points. Slopes were obtained successively as the data points for evaluation were shifted. These slopes gave Q10 values at mean temperatures of five data points.
Resistivity pulse experiments
To estimate the access resistance, resistivity pulse experiments were performed in which the extracellular solution was changed to a solution with higher resistivity by use of a high concentration of sorbitol (Stojilkovic et al., 2003). The solution composition was 100 mM Mes, 105 mM NMDG, 90 mM aspartate, 1 mM CaCl2, 1 mM MgCl2, 50 µM DIDS, and 0.14–2 M sorbitol. The pH of the solutions was adjusted to 5.5 by CsOH, such that the pH of the extracellular and intracellular solution was symmetrical. The pipette solution was the same as in the previous experiments. The resistivities of the buffered solutions as a function of the sorbitol concentration and that of temperature were measured by a conductivity meter (DS-8M; HORIBA).
Proton currents were elicited by the depolarization pulses to +100 mV, and after reaching the steady state of the activation, the cells were exposed to the solution with high resistivity for short periods of time (the resistivity pulse method) (Ando et al., 2005). Current amplitudes immediately before and after a resistivity jump were measured. The ratios of the current amplitudes were evaluated as a function of the resistivities of the solutions. The relative resistivity of the channel to that of the total resistance was obtained.
All the algebraic calculations were performed using Mathematica (Wolfram Research Inc.), and the graphs were drawn using Origin (OriginLab Corporation). Data were expressed as mean ± SEM.
Online supplemental material
Fig. S1 provides reciprocal relationships of Iratios at the beginning and end of a pulse, which supports negligible contribution of the concentration polarization to the measured currents. Fig. S2 demonstrates all the experimental data points for temperature dependence in a three-dimensional plot. Fig. S3 shows discrepancies in temperature dependence measured by the temperature pulse method and by the earlier method measuring the steady-state current amplitudes. Figs. S1–S3 and supplemental text are available at http://www.jgp.org/cgi/content/full/jgp.200910213/DC1.
RESULTS
Proton channels of microglial cells
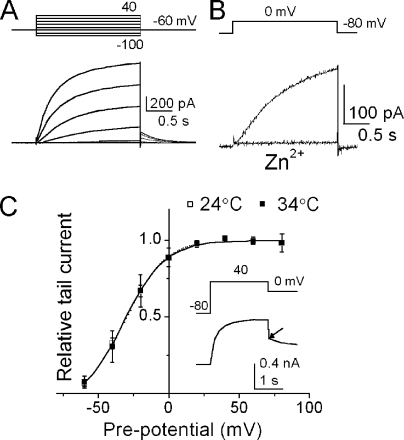
Proton currents were recorded from microglial cells in the whole cell voltage-clamped configuration. In the asymmetric pH condition (pHi/pHo, 5.5/7.3), depolarizing pulses elicited a slowly activating outward current, the time course of which was accelerated with further depolarization (Fig. 2 A) (Morihata et al., 2000b). This current was inhibited by a proton channel blocker, Zn2+ (Mahaut-Smith, 1989), indicating negligible contributions from other endogenous channels (Fig. 2 B).
Figure 2.
Proton channel currents. (A) Whole cell proton currents from a microglial cell. Voltage-dependent activation of the proton currents are shown. Currents were elicited by pulses from −100 to 40 mV. Inset represents the voltage protocol. (B) Block of the proton currents by 100 µM of extracellular Zn2+. (C) Steady-state gating curves (G-V curve) of proton channel and its temperature dependence. The current amplitudes at the peak of the tail currents were plotted as a function of preceding voltages and were normalized. G-V curves were obtained from six cells at 24 and 34°C. The curves were fitted by the Boltzmann function. The V1/2 values were −32.2 and −30.2 mV for 24 and 34°C. Inset shows a representative current trace for depolarizing pulse to +40 mV, followed by repolarization to 0 mV. The arrow indicates the peak of tail current.
To examine the temperature dependence of the steady-state gating, depolarizing pulses to various membrane potentials were applied and the tail currents at 0 mV were recorded (see Fig. 4 C, inset). The normalized peak amplitudes of the tail currents as a function of the depolarizing potentials were plotted (G-V curve; Fig. 2 C). The two curves at different temperatures overlapped; thus, the steady-state gating of the proton channel was not temperature dependent.
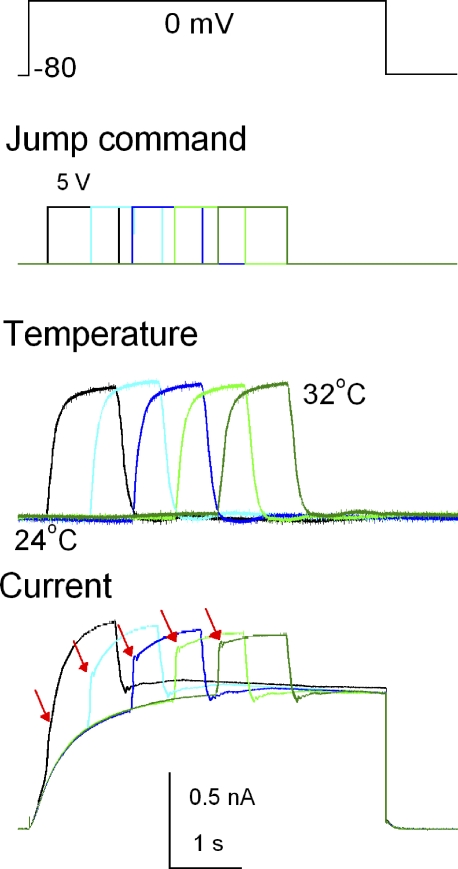
Figure 4.
Current responses to temperature pulses. A patch-clamped cell at an intracellular pH of 5.5 was placed in the midst of a laminar outflow, and an ultrafine thermocouple was located downstream of the cell within 15 µm. Proton currents were elicited by depolarizing pulses to 0 mV (top; pulse duration was 4 s), during which a temperature pulse of 1 s (from 24 to 32°C; ΔT = 8°C) was applied at different phases of the gating activation. The pulse command indicates the driving voltages to the piezoelectric device. The thermocouple signals displayed reproducible changes for the repetitive temperature pulses. Ensemble current traces with responses to temperature pulses elicited at different timings of the activation are superimposed.
Cytosolic protons are depleted slowly
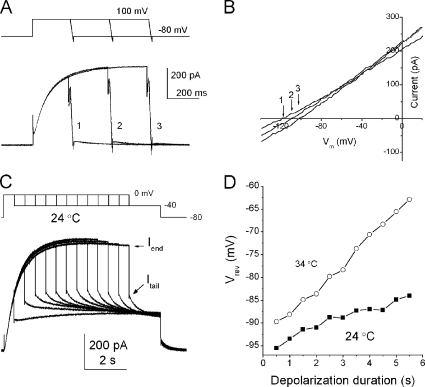
Before studying the temperature dependence of proton permeation through the channel, factors affecting the driving force upon temperature change were examined. Proton effluxes should deplete cytosolic protons (cytosolic depletion), and the degree of the depletion and its time course were evaluated. Proton effluxes were elicited by repeated application of depolarizing pulses that were prolonged successively (Fig. 3 A). A ramp potential was applied at the end of a depolarization pulse to give I-V curves (Fig. 3 B). The reversal potentials (Vrevs) shifted notably toward the positive direction for longer depolarizations. Because the bath concentrations of protons were held constant by continual perfusion, the positive shifts of Vrev indicate decreases in the intracellular concentrations of protons.
Figure 3.
Changes in the intracellular pH after proton flux. (A) Current traces for depolarization pulses, followed by the ramp potential from 100 to −100 mV. (B) The I-V curves for depolarization pulses of different durations. The Vrev is indicated by arrows, and the number represents current traces shown in A. Vrev shifted toward the depolarization potential as the depolarization pulse was prolonged. (C) Current traces with droop. As the depolarization pulses were prolonged, current amplitudes reached nearly steady state and slightly decayed. The tail currents were measured at −40 mV. Current amplitudes at the end of the depolarization pulse (Iend) and those at the peak of tail currents (Itail) are indicated by arrows. (D) Time courses of the shifts for Vrev. Vrevs were estimated from a current ratio (Itail/Iend). Shift of Vrev for the higher temperature was accelerated.
The proton currents sometimes decayed gradually after reaching the peak level of activation (Fig. 3 C). This is called current droop. In parallel to the current droop, Vrev shifted slowly within the time range of seconds (Fig. 3 D, ▪; 24°C). When the temperature was raised to 34°C, the degrees and speeds of the Vrev shift were dramatically enhanced (Fig. 3 D, ○), although the time range was still of the order of seconds.
Evaluation of the temperature pulse method
Temperature dependence of proton currents was examined by measuring the immediate changes in current amplitude upon temperature jumps (see Materials and methods). To verify that the fast temperature changes were sensed by the channels in cell membrane, the time courses of whole cell currents upon a temperature pulse were examined. The thermocouple signals displayed reproducible changes for the repetitive temperature pulses (Fig. 4, middle). When a pulse was applied early during the gating activation, a small jump of the current was followed by accelerated gating activation during the pulse (Fig. 4, bottom, red arrows). As the onset of the temperature pulse on top of the depolarization pulse was delayed, the instantaneous changes in the current traces predominated, and these were followed by residual activation. These observations, of the current jumps superimposed on temperature jumps and accelerated activation gating during a temperature pulse, were consistent with the expected responses to stepwise changes in temperature, and suggest that the cellular temperature under whole cell recordings changed rapidly.
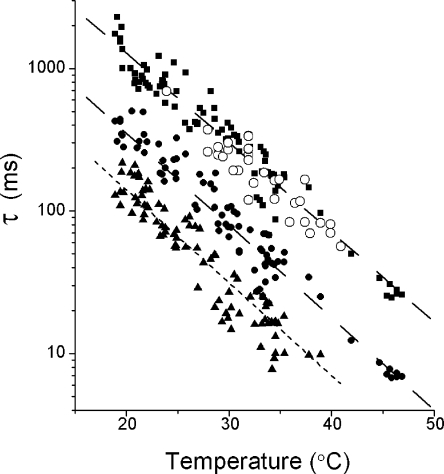
During a temperature pulse, the temperature sensed by the channel molecule in situ was evaluated. Because the gating of proton channels exhibits a high sensitivity to temperature (Byerly and Suen, 1989; Kuno et al., 1997; DeCoursey and Cherny, 1998), the accelerated gating kinetics upon heating pulses were used for the evaluation. First, the activation time courses of proton currents at a steady-state bath temperature, elicited by depolarizing pulses to 0 mV, were fitted with a triple-exponential function, and the time constants were plotted as a function of temperatures measured in the vicinity of the cell (Fig. 5, filled symbols). Then, the warming temperature pulses were applied during the gating activation. When the temperature pulses were applied after faster activation components were nearly completed, the accelerated time courses for the residual activation during temperature pulses were fitted by a single-exponential function. These time constants (Fig. 5, open symbols) were superimposed on the plot of time constants observed at the steady-state bath temperature. The data points from the temperature pulses overlapped onto the distribution of the slowest components of the activation time constants. The Q10 for the activation time constant measured under the pulse method was similar to that measured when the entire bath was temperature controlled (5.6 ± 0.5; n = 33). These data indicate that the temperatures applied to the channel molecules on the cell were monitored successfully by the thermocouple adjacent to the cell.
Figure 5.
Temperature-dependent time constants for the activation gating. The activating currents at 0 mV were fitted by a triple-exponential function. Temperature pulses were applied after the faster activation phases were nearly completed. Current traces during temperature pulses were fitted with a single exponential. Three time constants at various temperatures (filled symbols) and the time constant during the pulse (open symbols) are shown. The data were obtained from a single cell.
Temperature pulse experiments under various conditions
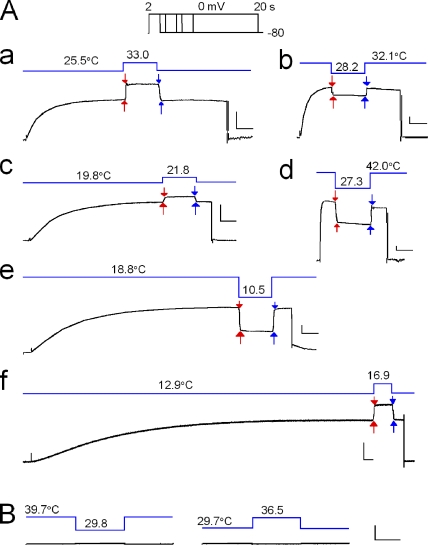
Temperature pulses applied during the steady state of gating activation produced clear stepwise changes in the currents upon both the onset and termination of the pulses (Fig. 6 A). Upon the return to the prepulse temperature, the amplitudes of the currents reverted to those before the pulse, confirming that the open-state probability had not been changed during a pulse. Pulses with various magnitudes of ΔT either warming or cooling were applied at various temperatures (pre-jump temperature; Fig. 6 A, a, c, and f, and b, d, and e). At low temperatures (Fig. 6 A, e and f), long (>8 s) depolarization pulses were required for the gating activation to reach the steady state. At −100 mV, which is outside of the activation range for the gating, temperature jumps produced negligible changes in current amplitude (Fig. 6 B).
Figure 6.
Responses of the proton currents to temperature pulses (pHi/pHo, 5.5/7.3). (A) Proton currents were elicited by depolarizing steps to 0 mV (inset; the voltage command with the holding potential of −80 mV). Temperature pulses (blue lines; duration, 1 s) were applied during the steady state of the gating activation. Current amplitudes were measured immediately before and after the onset (red arrows) and termination (blue arrows) of the pulses. The depolarizing pulses were followed by hyperpolarizing ramps (20 ms), and the outward tail currents were not obvious in these traces. (B) Temperature pulses were applied at the hyperpolarizing potential of −100 mV.
The ratio of current amplitudes, Iratio, as an index for temperature dependence
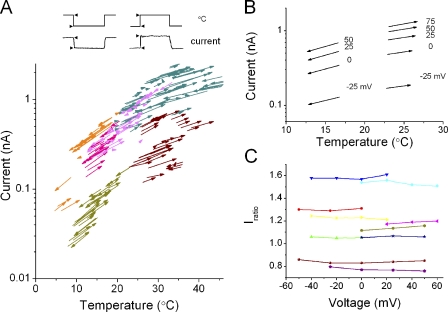
To evaluate the temperature dependence of current amplitudes immediately before and after a temperature jump, the current amplitudes for each jump were plotted as a function of pre-jump and jump temperatures, and the points were connected to draw a vector (jump vector; Fig. 7 A). The direction of the vectors indicates whether the pulse was cooling (down) or warming (up). Plots of the vectors from six different cells over a wide range of temperatures with variably sized ΔTs and directions (warming or cooling) showed a general trend of vector flow.
Figure 7.
The jump vector plot and current ratios. (A) The jump vector plot over a wide temperature range (pHi/pHo, 5.5/7.3). Current amplitudes immediately before and after a temperature jump (arrow heads) were plotted for pre-jump (tail of arrows) and jump (head of arrows) temperatures. Arrows were obtained from six different cells. Each colored arrow represents data from a single cell. A depolarization pulse of 0 mV was applied. Note that the axis for the current amplitude is logarithmic. (B) The jump vector plots at different membrane potentials ranging from −25 to +75 mV. Arrows from different membrane potentials in two different cells (left column, cool-down jump; right column, heat-up jump) are shown. (C) Iratios at different membrane potentials. A set of Iratios from nine cells is shown. For each cell ΔT was fixed.
Jump vectors were examined for different membrane potentials (Fig. 7 B). Temperature jumps of a fixed ΔT (from 16.7 to 12.7°C) were applied during variable depolarizing steps. Each column of arrows represents jump vectors from a cell. The slopes of the vectors on the logarithmic scale were almost identical, even though the current amplitudes at different membrane potentials differed considerably.
The ratios of the current amplitudes were calculated from the vectors (current ratio; Iratio = Ijump/Ipre-jump) and were plotted at different membrane potentials (Fig. 7 C), where the ΔTs were set differently for cells. The Iratios were distributed nearly horizontally, indicating that the Iratio was not affected by the current amplitudes.
Temperature dependence of Q10 over a wide temperature range
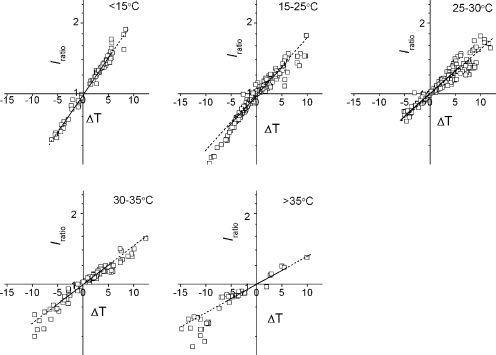
A plot of the values of Iratios as a function of ΔTs shows nearly linear relationships. Iratios were measured from many cells over a wide range of pre-jump temperatures (4–49°C) and ΔTs (±15°C) (see three-dimensional plot in Fig. S2). Iratio–ΔT relationships are shown for different ranges of pre-jump temperatures (Fig. 8). Linear relationships hold at relatively narrow ranges of pre-jump temperatures. The slope is a measure of temperature dependence of proton currents, and the Q10 value was calculated (see Materials and methods). Fig. 8 demonstrates that the Q10 value decreased significantly over a measured temperature range. A similar relation was observed at pH 6.2 (not depicted).
Figure 8.
Temperature dependencies of Iratios. Iratio as a function of ΔT for different pre-jump temperatures. The data points were fitted by a linear function, and the Q10 values were obtained from the slopes. Solid lines were fitted to the data with the absolute ΔT value <5°, and the broken lines are the extrapolations. Q10 values were 1.98 < 15°C, 1.79 for 15 ≤ T < 25°C, 1.60 for 25 ≤ T < 30°C, 1.46 for 30 ≤ T < 35°C, and 1.32 > 35°C.
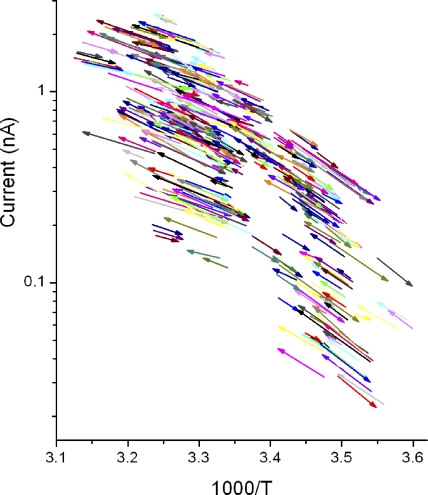
To obtain thermodynamic clues for this phenomenon, the jump vector data were expressed as an Arrhenius plot, in which pairs of current amplitudes for each temperature jump were plotted against 1/T (T, the absolute temperature; Fig. 9). The slopes of the arrows became steeper as the temperature was decreased (toward the right of the horizontal axis) and, overall, the arrows indicate a trend that is curved (convex). A curved Arrhenius plot is generally considered to indicate the presence of multiple processes with different underlying natures (Gutfreund, 1995; Fersht, 1999).
Figure 9.
An Arrhenius plot for the proton permeation process through the voltage-gated proton channel. Each arrow represents data for the onset of a temperature pulse.
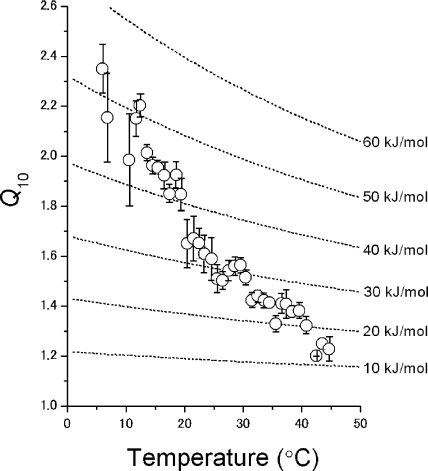
To quantify the temperature dependence, the mean Q10 values were plotted as a function of temperature (Fig. 10). The Q10 value of 2.2 at 10°C decreased monotonically as the temperature was increased and reached 1.3 at 40°C. The strong temperature dependence of the Q10 values has not been reported in earlier studies, at least for the permeation of channels.
Figure 10.
Temperature dependence of Q10 values. Q10 values were calculated from the data of temperature jump experiments. A set of dotted lines indicates temperature-dependent Q10 values for fixed activation enthalpy (iso-enthalpy line).
The rate theory (Kramers, 1940) was applied to express proton permeation at different temperatures with thermodynamic parameters (see Eq. A1). Q10 as a function of T can be expressed as
| (2) |
where ΔH‡ represents the activation enthalpy. This equation demonstrates that Q10 value changes at different temperatures, the extent of which can be estimated. The changes of Q10 at constant ΔH‡ values are shown in Fig. 10 (dotted lines, iso-enthalpy lines). As expected, the experimentally obtained Q10s did not align on the iso-enthalpy lines, but cut across them. What is the underlying mechanism for the strong temperature dependence of Q10? Multiple processes with different thermodynamic natures are involved in the measured currents. From the theoretical prediction, one possible candidate underlying the observations is the access resistance that develops instantaneously (<10−10 s; see Experimental strategy and Appendix), and hence its contribution to the measured current even with the rapid temperature change cannot be eliminated.
Estimation of the access resistance
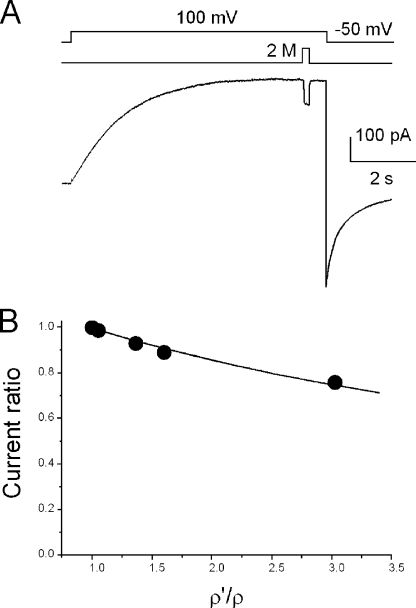
Direct measurements of the access resistance (RAR) are impossible, but the relative contribution of RAR to the measured current (or Rtotal) can be estimated. Hall’s equation indicates that RAR changes with the resistivity of the bathing solution (see Eq. A7). Therefore, if a cell is perfused with a different resistivity solution, changes in the external RAR lead to changes in Rtotal. Analyses of an equivalent electrical circuit having RCh (the channel resistance) and RAR in series (see Appendix) demonstrated that the ratio of Rtotal in two different resistivity solutions gives the ratio of RAR and RCh (see Eq. A8). Here, an experimental method for evaluating RAR/RCh was developed (the resistivity pulse method [R pulse method]). Proton currents were elicited by depolarization pulses to +100 mV. After reaching steady-state activation, the cells were exposed to the high resistivity solution for a short period of time (250 ms; Fig. 11 A; see Materials and methods) (Ando et al., 2005), and current amplitudes before and after a resistivity jump were measured. In these experiments, solutions on both sides of the membrane were set symmetrically (pH, 5.5); hence, RARs on the intracellular and extracellular sides were assumed to be identical.
Figure 11.
Estimation of the access resistance. (A) Current traces for the resistivity pulse experiments. The pHs were symmetrical (pH, 5.5), and the temperature was 23°C. A patch-clamped cell was exposed briefly to a solution containing 2 M sorbitol. The current amplitudes were measured immediately before and after a jump. (B) Current ratios as a function of the relative resistivity of the solutions. ρ is the resistivity of the bathing solution, and ρ′ is the resistivity of the pulse solution. The data were fitted by Eq. A10. The ratio of the resistances (RAR/RCh) was 0.25.
The current trace demonstrated, surprisingly, large decreases in amplitudes upon exposure to a high resistivity solution, suggesting a large contribution of the access resistance. The current ratios were plotted as a function of the relative resistivities of the solutions (Fig. 11 B). Proton currents decreased gradually as the resistivity of the external solution was increased. The RCh/RARs were obtained through fitting the current ratio of Eq. A11 to the data. The value of RCh/RAR was 3.8 and that of RCh/Rtotal was 0.66 at 23°C. A notable contribution of RAR to Rtotal suggests that the observed Q10 values do not solely represent temperature dependence of the channel per se, but represent a weighted average for those of the channel and the access resistance. Therefore, we redefine here the observed Q10 as the apparent Q10 (Q10app). It should be noted that RCh/RAR is not constant over the temperature range because the temperature dependencies of the channel and access resistances differ. Then it is likely that the strong temperature dependence of Q10app is produced by the relative contribution of Q10 for the access resistance (Q10AR) and for the channel (Q10Ch), which varies as the temperature changes.
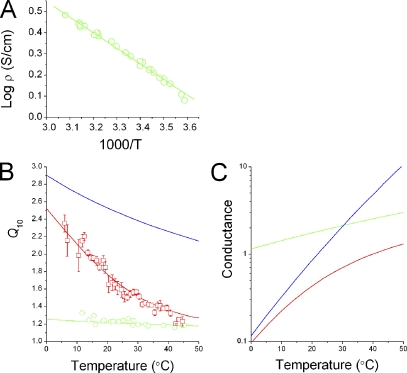
The Q10Ch was decomposed from Q10app by the series resistance model (see Appendix). Each resistance (RCh and RAR) can be characterized by its own thermodynamic parameters, such as the activation enthalpy and entropy. An equation was derived for the temperature dependence of the Q10app values as a function of the thermodynamic parameters for the channel and access resistance (see Eq. A14). In this equation, temperature dependence of RAR (Q10AR) can be represented by of the buffer solution (Hall’s equation) (Hall, 1975), which was evaluated by measuring the conductivity of the buffered solution at different temperatures (Fig. 12 A). The Q10AR value was 1.2 at 25°C and decreased slightly at higher temperatures (Fig. 12 B). If the thermodynamic parameters for the channel, in addition to the access resistance, would be given, the series resistance model would provide temperature dependencies of observable currents and Q10app.
Figure 12.
Decomposition of apparent Q10 (Q10app). (A) Measured conductance (ρ) for the Mes-buffered solution represented as the Arrhenius plot. The ΔH‡ value was 14.0 kJ/mol, and the preexponential factor was 556.7. (B) Temperature dependencies of Q10AR (green symbols and line), Q10Ch (blue), and Q10app (red symbols and line) values. Q10ARs were calculated from the data for A (see Materials and methods). A ΔH‡ value of 12.5 kJ/mol was obtained by fitting to the Q10AR values. ΔS‡ was set to zero. Using ΔH‡ and ΔS‡ values for the access resistance, the values of ΔH‡ and ΔS‡ for the channel were estimated through fitting Eq. A10 to Q10app data. ΔH‡, ΔS‡, and ωC for the channel were 63.7 kJ/mol, 8.49 J/mol/T, and 0.0115. Q10Ch (blue line) was drawn using the above fitted parameters. (C) Temperature dependencies of conductances for access resistance (green), channel (blue), and total (red) values. Conductances were calculated using the thermodynamic parameters.
Conversely, now that data for temperature dependency of Q10app and the thermodynamic parameters of the access resistance are available (data points in Fig. 12 B), thermodynamic parameters for the channel were obtained through optimizing the parameter as to fit the calculated Q10app line to the Q10app data. The blue line in Fig. 12 shows the estimate for the temperature dependence of Q10Ch (an iso-enthalpy line). In this figure, strong temperature dependence of Q10app was decomposed into Q10AR and Q10Ch. Finally, the activation enthalpy (ΔH‡) for proton permeation through the channel per se was determined to be 64 kJ/mol. (Similar values of thermodynamic parameters for the channel [or Q10Ch] were obtained through fitting procedures using data of Iratios at different temperatures and ΔTs; Fig. S2).
DISCUSSION
The temperature dependencies of proton permeation through the voltage-gated proton channel per se (Q10Ch) are masked by many layers of phenomena, and the aim of this study was to isolate Q10Ch. By applying temperature pulse methods, the overlying factors, such as the changes in the number of active channels and the driving forces of proton permeation, were successfully excluded. The measured Q10, however, exhibited unexpectedly high temperature dependence, which cannot be accounted for by a simple physical process (hence named Q10app). We suspected that Q10app represents a mixture of multiple processes with different temperature dependencies. The novel resistivity pulse experiments allowed the quantitative evaluation of the access resistance (RAR) and revealed significant contribution of RAR. Finally, we extracted Q10Ch, attained for the first time, and the value was 2.5 at room temperature and the activation enthalpy was 64 kJ/mol. These thermodynamic features will be discussed for the underlying mechanisms of proton permeation through the voltage-gated proton channel.
Verification of the temperature pulse method
The T pulse method is characterized by its rapid change of temperature, which minimizes the contributions of the slowly developing events, i.e., proton depletion and concentration polarization. The validity of the T pulse method was demonstrated in various ways, as follows. The stepwise changes in temperature were confirmed by the rectangular shapes of the measured liquid junction potentials (Fig. 1 B) and of the proton currents themselves (Figs. 8–10). Throughout the experiment, the temperature in the vicinity of the cell was monitored with an ultrafine thermocouple (Fig. 1), which demonstrated that ambient temperature of the channels in situ (on the plasma membrane) was well controlled by the pulse method (see Fig. 7). These results indicate that the temperature pulse method readily provides variable up-and-down temperature jumps to whole cell clamped cells within a few milliseconds in a reproducible and accurate manner.
The Iratio introduced here as a robust measure of temperature dependence served for calculating Q10app. Q10apps were evaluated under various experimental conditions: at different intracellular pHs, at different membrane potentials (Fig. 7), and in the presence and absence of droop.
Q10 for proton permeation per se extracted from the temperature-dependent Q10app
A key finding of the present study was that the Q10app values changed significantly over a wide temperature range (Fig. 10). Generally, the Q10 value should change somewhat. In fact, simple physical processes, such as proton-transfer processes through the access region and the channel pore, can be described by the rate theory (see Eq. A1), and the temperature dependence of the preexponential factor for the rate equation leads to slight temperature dependence of Q10, which follows the iso-enthalpy line (Fig. 10). The large changes in the Q10app values over ∼1 unit between 4 and 49°C suggest that multiple processes with different temperature dependences are involved.
A seminal paper by Decker and Levitt (1988) led us to examine the contribution of access resistance to the total proton current in the presence of a high concentration buffer. The R pulse method revealed unexpectedly large changes in current amplitudes upon exposure to the high resistivity solution, suggesting a significant contribution of the access resistance to the measured current. A simple model for resistances in series of the channel and access regions (the series resistance model) was adopted for quantitative evaluation, and the RCh/Rtotal ratio was estimated to be 0.66 at room temperature. This value makes evident that the contribution of the access resistance to the measured current was important.
The series resistance model demonstrates that if thermodynamic parameters for the channel and the access region are given, the temperature-dependent Q10app can be readily calculated. The thermodynamic parameters for the access resistance were estimated from that of the resistivity of the buffered solution (Fig. 12 B, green line) (Hall, 1975). Now that Q10app and Q10AR are given, Q10Ch and its thermodynamic parameters can be estimated through the fitting procedure.
Fig. 12 B demonstrates graphically how the strong temperature dependency of Q10app is decomposed into Q10Ch and Q10AR. At low temperature the Q10Ch predominates, and at high temperature the Q10AR predominates. Q10app traverses from Q10Ch to Q10AR through the measured temperature range. The activation enthalpy for proton permeation through the channel was finally extracted. (These thermodynamic parameters were also obtained from direct fit to the Iratio data; Fig. S2.) The Q10Ch value was 2.5 at room temperature, and the ΔH‡ value was 64 kJ/mol.
Before discussing the implication of the activation enthalpy for the proton permeation, the physiological relevance of Q10app will be discussed.
The Q10app under physiological conditions
The Q10app values obtained here were smaller than the Q10 of earlier reports (5.3 ≤ 20°C and 2.8 > 20°C) (DeCoursey and Cherny, 1998), which might be overestimates because they included the contribution of changes in the numbers of activatable channels at different temperatures (Fig. S3). In Fig. 12 C, the temperature-dependent conductance was decomposed into the conductance for the channel (blue line) and that for the access resistance (green line). This figure was drawn using the thermodynamic parameters, demonstrating the relative contributions. The temperature-dependent conductances of the channel and the access resistance form asymptotes for the observed conductance (Fig. 12 C, red line). These parameters gave the ratio RCh/Rtotal as 0.46 at 23°C, which is in rough agreement with the ratio predicted from the R pulse method. Because the temperature dependence of the channel conductance is much higher than that of access resistance, the channel conductance overwhelmed that of the access resistance and the whole process became diffusion limited above the crossing point of ∼30°C. In physiological conditions, in which the buffer concentrations are much lower than in the present experimental conditions, the temperature dependence of the voltage-gated proton channel, Q10app, is apparently governed by diffusion-limited processes and is almost indistinguishable from those of other types of ion channels.
Mechanisms for proton-selective permeation
The temperature dependence of proton permeation has been studied systematically only for the gramicidin A (gA) channel, which is proton conducting, but not proton selective (Andersen, 1984; Heinemann and Sigworth, 1989; Oiki et al., 1995; Koeppe and Anderson, 1996). Over a wide temperature range (Chernyshev and Cukierman, 2002), the Q10 values were nearly constant (Cukierman, 2000) and the ΔH‡ values for proton permeation through most gA channels were 10–20 kJ/mol (Bamberg and Läuger, 1974; Akeson and Deamer, 1991; Chernyshev and Cukierman, 2002). These values are similar to those for proton diffusion in an aqueous solution, in which the Grotthuss mechanism predominates (Eigen, 1964; Agmon, 1995; Day et al., 2000; Limbach et al., 2006), and are in general agreement with the activation enthalpy for the buffered diffusion (Fig. 12 A). However, it has been reported that the contribution of the access resistance to the recorded single-channel current is significant for proton permeation through the gA channel (Decker and Levitt, 1988; Cukierman, 2000; Schumaker et al., 2000; Schumaker, 2003; Braun-Sand et al., 2005). Therefore, the measured temperature dependence of earlier studies for the gA channel may be governed largely by the access resistance, similar to the voltage-gated proton channel. In fact, breaks in linearity or curved Arrhenius plots have been reported for gA channels (Chernyshev and Cukierman, 2002). The lower Q10 may represent the diffusion-limited ion access, and the higher Q10 (>30 kJ/mol) could represent the inherent proton permeation process.
The voltage-gated proton channel exhibits nearly perfect proton selectivity compared with the gA channels. We estimated the activation enthalpy of proton permeation through the channel to be 64 kJ/mol. This is essentially the first quantitative evaluation of a thermodynamic parameter for proton permeation through proton-selective channels. What is the underlying mechanism of the ΔH‡ value for the proton permeation? Quantitative comparison of the present ΔH‡ value with those of other types of channels must be reserved until the genuine ΔH‡ values without effect of the access resistance would become available for other types of channels. Still, we anticipate that ΔH‡ for the proton channel is significantly higher than for the gA channel, and a gap between the ΔH‡ value of the proton channel and gA channels cannot be accounted for by simple modifications of the proton jump mechanism through a single-file pore. We present here a hypothetical mechanism for proton-selective permeation: A proton-selective site(s) should exist along a water-filled pore, and its configuration needs to be rearranged upon proton transfer, which would account for the additional cost of ΔH‡ for the proton permeation. The mechanism of proton permeation through the molecular candidate of the voltage-gated proton channels (Ramsey et al., 2006; Sasaki et al., 2006; DeCoursey, 2008) and other proton-selective pores in the voltage sensor domain of potassium channels (Starace and Bezanilla, 2004) has not been studied. However, given the structural elements that the candidates possess, such as water crevices toward protonation sites, our hypothetical mechanism is compatible with those that the candidates may exhibit. Involvement of local structural changes during rearrangement of proton-accepting histidine residues may account for the observed activation enthalpy. Those are thermodynamic aspects of experimental evidence supporting the candidate molecule as the molecular entity of the voltage-gated proton channel.
Here, we conclude the temperature dependence of the voltage-gated proton channel. Q10app is a measure that represents the overall nature of proton permeation, including the access resistance. The value characterizes apparent behavior of the proton channel under physiological conditions and is almost indistinguishable from that for other types of channels (Hoffmann and Dionne, 1983; Urry et al., 1984; Grygorczyk, 1987; Miller et al., 1988; Sitsapesan et al., 1991; Milburn et al., 1995; Hille, 2001; Chernyshev and Cukierman, 2002). On the other hand, Q10Ch is a measure to characterize the proton permeation in the channel per se, and we have proposed an underlying mechanism of proton-selective permeation. These thermodynamic clues are prerequisite to advance our understanding of the mechanism of action for proton-selective permeation.
APPENDIX
Local proton concentration
In the presence of buffer, the concentration polarization is confined to a limited space, which otherwise extends farther from the membrane. Zifarelli et al. (2008) simulated the concentration profile of protons near the membrane. Their numerical evaluation showed that if the flux of protons is constant, the concentration polarization develops relatively slowly over a time range of several tens to hundreds of milliseconds. For example, the pH at the outer vicinity of the membrane decreased by 1.3 U in the presence of buffer concentration as low as 0.1 mM after 5 s of a proton efflux of 500 pA. This local proton accumulation decreased to a ΔpH of 0.07 U when the buffer concentration was increased to 2 mM. Following the reported method, we simulated the local accumulation when the buffer concentration was increased to 100 mM (our experimental condition). The ΔpH was only 0.0013 U at the vicinity of the membrane. The time course of the development was fitted by a double-exponential function, and the smaller time constant was ∼60 ms. The slow development and attenuation of the concentration polarization in the concentrated buffer were used in the experimental strategy.
Temperature-dependent Q10
The rate constant for the proton permeation was expressed in Kramers’ theory (Kramers, 1940; Hänggi et al., 1990; Berry et al., 2000):
| (A1) |
where the preexponential factor can be expressed as:
| (A2) |
In these equations, ζ is the friction coefficient, ωC is the characteristic frequency, h is the Planck constant, R is the gas constant, and kB is the Boltzmann constant. This equation for condensed systems is valid in the limit of large friction. The temperature dependence for the friction coefficient is:
| (A3) |
With this relation, the Kramers’ equation becomes
| (A4) |
where ΔHCh‡ is the activation enthalpy and ΔSCh‡ is the activation entropy. Here, ΔHCh‡ and b were lumped together as ΔHCh′‡ (=ΔHCh‡ + bR) because ζ(T) and its temperature dependence cannot be obtained unequivocally. Also, a and ωC were collected as ωC’ (=a ωC). Then,
| (A5) |
The temperature dependence of k(T), or Q10 of proton permeation, is expressed as:
| (A6) |
The access resistance
Access resistance was formalized theoretically based on geometrical and electrostatic considerations, and a simplified expression was proposed by Hall (1975) as
| (A7) |
where ρ is the resistivity of the solution and r is the capture radius. The resistance of a hemispherical region outside a pore entrance was integrated to give the access resistance, and most of the resistance arises within close vicinity of the pore. The time for development of the access resistance can be estimated by r2/D (Crank, 1975). For r < 1 nm and D (diffusion coefficient) < 10−4 cm2/s, the time constant is 10−10 s.
The access resistance is further modified by the presence of buffer. Protonated buffer distributes within the access region and supplies protons to the pore, which replenishes the limited delivery (proton supply by buffer; Fig. 2) (Decker and Levitt, 1988). This may attenuate amplitudes of the access resistance. Here, we estimate the effectiveness of the proton supply from the buffer to the pore quantitatively. The time constant for buffering is
and it is calculated as 10−4 to 10−5 s for a k1 of 109–1010 M−1/s and k−1 of k1 × 10−pK. This value is much larger than the time constant for development of the access resistance (∼10−10 s). This means that the release rate of protons from the protonated buffer is much slower than the development of access resistance. In this case, the proton supply from the protonated buffer cannot keep up with the demand. The access resistance for the voltage-gated proton channel has not been estimated quantitatively, so these theoretical predictions remain to be evaluated experimentally.
The total resistance (Rtotal) across the membrane is composed of the channel resistance (RCh) and the access resistance on both sides of the membrane (external and internal RAR).
| (A8) |
The relative contributions of RAR to Rtotal were estimated by the following methods. Changes in the external RAR lead to changes in Rtotal, even if RCh and internal RAR are constant. The external RAR can be changed by altering ρ (Eq. A7) (Hall, 1975), which is attained by perfusing extracellular solutions with higher resistivity, such as by adding concentrated nonelectrolytes (Ando et al., 2005). From the changes in the current amplitude upon exposure (the resistivity pulse method), the relative contribution of RAR to RCh can be estimated by this equation:
| (A9) |
in which RARo′ represents the resistance after perfusion with a different conductivity solution. Incorporating Hall’s relation for the ratio of the access resistances at different solutions, the conductance ratio can be obtained:
| (A10) |
We assume that the external and internal RAR are identical in symmetric solutions. Based on Hall’s equation, RAR is determined by the conductivity and the capture radius. Therefore, the symmetric assumption is acceptable as far as the structural information of the channel is not available. Eq. A10 becomes
| (A11) |
In this equation, the resistivities of the buffer solution were measured by a conductivity meter at different temperatures. The resistance ratio is an only unknown parameter that can be obtained through fitting the experimental data.
The Q10 value for resistances in series
The total conductance of the channel and access resistances in series are expressed as
| (A12) |
where GCh is the channel conductance and GAR is the access conductance. The Q10 value for this conductance is
| (A13) |
GCh was replaced by k(T) and GAR was replaced by Eq. 12, in which ρ is expressed by 1/(A Exp[−B/T]). Then, Q10(T) is expressed as
| (A14) |
where ΔHCh‡ is the activation enthalpy, ΔSCH‡ is the activation entropy, and ωC is the frequency factor for the channel. A and B can be obtained from the resistivity measurements at different temperatures. The fitting of the three unknown parameters (ΔH‡Ch, ΔS‡Ch, and ωC) to the measured Q10 values was performed.
Acknowledgments
We would like to thank O.S. Andersen, M. Iwamoto, T. Konno, H. Shimizu, S. Irie, and C. Edwards for discussion. We also thank J. Kawawaki and H. Nakagawa for technical assistance and T. Goto for secretarial assistance.
This work is supported by a Grant-in-Aid for Scientific Research from the Ministry of Education, Culture, Sports, Science and Technology (Japan).
Lawrence G. Palmer served as editor.
Footnotes
Abbreviation used in this paper:
- gA
- gramicidin A
References
- Agmon N. 1995. The Grotthuss mechanism.Chem. Phys. Lett. 244:456–462 [Google Scholar]
- Agmon N. 1996. Hydrogen bonds, water rotation and proton mobility.J. Chim. Phys. 93:1714–1736 [Google Scholar]
- Agmon N. 1999. Proton solvation and proton mobility.Isr. J. Chem. 39:493–502 [Google Scholar]
- Aguilella-Arzo M., Aguilella V.M., Eisenberg R.S. 2005. Computing numerically the access resistance of a pore.Eur. Biophys. J. 34:314–322 [DOI] [PubMed] [Google Scholar]
- Akeson M., Deamer D.W. 1991. Proton conductance by the gramicidin water wire. Model for proton conductance in the F1F0 ATPases? Biophys. J. 60:101–109 [DOI] [PMC free article] [PubMed] [Google Scholar]
- Andersen O.S. 1983. Ion movement through gramicidin A channels. Studies on the diffusion-controlled association step.Biophys. J. 41:147–165 [DOI] [PMC free article] [PubMed] [Google Scholar]
- Andersen O.S. 1984. Gramicidin channels.Annu. Rev. Physiol. 46:531–548 [DOI] [PubMed] [Google Scholar]
- Ando H., Kuno M., Shimizu H., Muramatsu I., Oiki S. 2005. Coupled K+–water flux through the HERG potassium channel measured by an osmotic pulse method.J. Gen. Physiol. 126:529–538 [DOI] [PMC free article] [PubMed] [Google Scholar]
- Bamberg E., Läuger P. 1974. Temperature-dependent properties of gramicidin A channels.Biochim. Biophys. Acta. 367:127–133 [DOI] [PubMed] [Google Scholar]
- Berg H.C., Purcell E.M. 1977. Physics of chemoreception.Biophys. J. 20:193–219 [DOI] [PMC free article] [PubMed] [Google Scholar]
- Berry R.S., Rice S.A., Ross J. 2000. Physical Chemistry. 2nd Ed Oxford University Press, New York: 1080 pp [Google Scholar]
- Braun-Sand S., Burykin A., Chu Z.T., Warshel A. 2005. Realistic simulations of proton transport along the gramicidin channel: demonstrating the importance of solvation effects.J. Phys. Chem. B. 109:583–592 [DOI] [PubMed] [Google Scholar]
- Byerly L., Suen Y. 1989. Characterization of proton currents in neurones of the snail, Lymnaea stagnalis.J. Physiol. 413:75–89 [DOI] [PMC free article] [PubMed] [Google Scholar]
- Cherny V.V., Murphy R., Sokolov V., Levis R.A., DeCoursey T.E. 2003. Properties of single voltage-gated proton channels in human eosinophils estimated by noise analysis and by direct measurement.J. Gen. Physiol. 121:615–628 [DOI] [PMC free article] [PubMed] [Google Scholar]
- Chernyshev A., Cukierman S. 2002. Thermodynamic view of activation energies of proton transfer in various gramicidin A channels.Biophys. J. 82:182–192 [DOI] [PMC free article] [PubMed] [Google Scholar]
- Crank J. 1975. The Mathematics of Diffusion. 2nd Ed Clarendon Press, Oxford, UK: 424 pp [Google Scholar]
- Cukierman S. 2000. Proton mobilities in water and in different stereoisomers of covalently linked gramicidin A channels.Biophys. J. 78:1825–1834 [DOI] [PMC free article] [PubMed] [Google Scholar]
- Day T.J.F., Schmitt U.W., Voth G.A. 2000. The mechanism of hydrated proton transfer in water.J. Am. Chem. Soc. 122:12027–12028 [Google Scholar]
- de Grotthuss C.J.T. 1806. Sur la décomposition de l’eau et des corp qu’elle tient en dissolution à l’aide de l’électricité galvanique.Annales de Chimie. LVIII:54–74 [Google Scholar]
- Decker E.R., Levitt D.G. 1988. Use of weak acids to determine the bulk diffusion limitation of H+ ion conductance through the gramicidin channel.Biophys. J. 53:25–32 [DOI] [PMC free article] [PubMed] [Google Scholar]
- DeCoursey T.E. 2003. Voltage-gated proton channels and other proton transfer pathways.Physiol. Rev. 83:475–579 [DOI] [PubMed] [Google Scholar]
- DeCoursey T.E. 2008. Voltage-gated proton channels: what’s next? J. Physiol. 586:5305–5324 [DOI] [PMC free article] [PubMed] [Google Scholar]
- DeCoursey T.E., Cherny V.V. 1996. Effects of buffer concentration on voltage-gated H+ currents: does diffusion limit the conductance? Biophys. J. 71:182–193 [DOI] [PMC free article] [PubMed] [Google Scholar]
- DeCoursey T.E., Cherny V.V. 1998. Temperature dependence of voltage-gated H+ currents in human neutrophils, rat alveolar epithelial cells, and mammalian phagocytes.J. Gen. Physiol. 112:503–522 [DOI] [PMC free article] [PubMed] [Google Scholar]
- Eigen M. 1964. Proton transfer, acid-base catalysis, and enzymatic hydrolysis. Part 1: elementary processes.Angew. Chem. Int. Ed. Engl. 3:1–72 [Google Scholar]
- Eigen M., Kruse W., Maass G., De Maeyer L. 1964. Rate constants of proteolytic reactions in aqueous solution.Prog. React. Kinet. 2:287–318 [Google Scholar]
- Fersht A. 1999. Structure and Mechanism in Protein Science. W.H. Freeman and Company, New York: 650 pp [Google Scholar]
- Gordienko D.V., Tare M., Parveen S., Fenech C.J., Robinson C., Bolton T.B. 1996. Voltage-activated proton current in eosinophils from human blood.J. Physiol. 496:299–316 [DOI] [PMC free article] [PubMed] [Google Scholar]
- Grygorczyk R. 1987. Temperature dependence of Ca2+-activated K+ currents in the membrane of human erythrocytes.Biochim. Biophys. Acta. 902:159–168 [DOI] [PubMed] [Google Scholar]
- Gutfreund H. 1995. Kinetics for the Life Sciences: Receptors, Transmitters and Catalysts. Cambridge University Press, Cambridge, UK: 346 pp [Google Scholar]
- Hall J.E. 1975. Access resistance of a small circular pore.J. Gen. Physiol. 66:531–532 [DOI] [PMC free article] [PubMed] [Google Scholar]
- Hänggi P., Talkner P., Borkovec M. 1990. Reaction-rate theory: fifty years after Kramers.Rev. Mod. Phys. 62:251–341 [Google Scholar]
- Heinemann S.H., Sigworth F.J. 1989. Estimation of Na+ dwell time in the gramicidin A channel. Na+ ions as blockers of H+ currents.Biochim. Biophys. Acta. 987:8–14 [DOI] [PubMed] [Google Scholar]
- Henderson L.M., Chappell J.B., Jones O.T. 1987. The superoxide-generating NADPH oxidase of human neutrophils is electrogenic and associated with an H+ channel.Biochem. J. 246:325–329 [DOI] [PMC free article] [PubMed] [Google Scholar]
- Hille B. 1968. Pharmacological modifications of the sodium channels of frog nerve.J. Gen. Physiol. 51:199–219 [DOI] [PMC free article] [PubMed] [Google Scholar]
- Hille B. 2001. Ion Channels of Excitable Membranes. 3rd Edition Sinauer Associates Inc, Sunderland, MA: 814 pp [Google Scholar]
- Hladky S.B. 1984. Ion currents through pores. The roles of diffusion and external access steps in determining the currents through narrow pores.Biophys. J. 46:293–297 [DOI] [PMC free article] [PubMed] [Google Scholar]
- Hoffmann H.M., Dionne V.E. 1983. Temperature dependence of ion permeation at the endplate channel.J. Gen. Physiol. 81:687–703 [DOI] [PMC free article] [PubMed] [Google Scholar]
- Keener J., Sneyd J. 1998. Mathematical Physiology. Springer-Verlag, New York: 792 pp [Google Scholar]
- Koeppe R.E.I.I., II, Anderson O.S. 1996. Engineering the gramicidin channel.Annu. Rev. Biophys. Biomol. Struct. 25:231–258 [DOI] [PubMed] [Google Scholar]
- Kramers H.A. 1940. Brownian motion in a field of force and the diffusion model of chemical reactions.Physica. 7:284–304 [Google Scholar]
- Kuno M., Kawawaki J., Nakamura F. 1997. A highly temperature-sensitive proton current in mouse bone marrow–derived mast cells.J. Gen. Physiol. 109:731–740 [DOI] [PMC free article] [PubMed] [Google Scholar]
- Läuger P. 1976. Diffusion-limited ion flow through pores.Biochim. Biophys. Acta. 455:493–509 [DOI] [PubMed] [Google Scholar]
- Limbach H.H., Miguel Lopez J., Kohen A. 2006. Arrhenius curves of hydrogen transfers: tunnel effects, isotope effects and effects of pre-equilibria.Philos. Trans. R. Soc. Lond. B Biol. Sci. 361:1399–1415 [DOI] [PMC free article] [PubMed] [Google Scholar]
- Mahaut-Smith M.P. 1989. The effect of zinc on calcium and hydrogen ion currents in intact snail neurones.J. Exp. Biol. 145:455–464 [DOI] [PubMed] [Google Scholar]
- Milburn T., Saint D.A., Chung S.H. 1995. The temperature dependence of conductance of the sodium channel: implications for mechanisms of ion permeation.Receptors Channels. 3:201–211 [PubMed] [Google Scholar]
- Miller C., Stahl N., Barrol M. 1988. A thermodynamic analysis of monovalent cation permeation through a K(+)-selective ion channel.Neuron. 1:159–164 [DOI] [PubMed] [Google Scholar]
- Morgan D., Cherny V.V., Murphy R., Xu W., Thomas L.L., DeCoursey T.E. 2003. Temperature dependence of NADPH oxidase in human eosinophils.J. Physiol. 550:447–458 [DOI] [PMC free article] [PubMed] [Google Scholar]
- Morihata H., Kawawaki J., Sakai H., Sawada M., Tsutada T., Kuno M. 2000a. Temporal fluctuations of voltage-gated proton currents in rat spinal microglia via pH-dependent and -independent mechanisms.Neurosci. Res. 38:265–271 [DOI] [PubMed] [Google Scholar]
- Morihata H., Nakamura F., Tsutada T., Kuno M. 2000b. Potentiation of a voltage-gated proton current in acidosis-induced swelling of rat microglia.J. Neurosci. 20:7220–7227 [DOI] [PMC free article] [PubMed] [Google Scholar]
- Oiki S., Koeppe R.E., II, Andersen O.S. 1995. Voltage-dependent gating of an asymmetric gramicidin channel.Proc. Natl. Acad. Sci. USA. 92:2121–2125 [DOI] [PMC free article] [PubMed] [Google Scholar]
- Peskoff A., Bers D.M. 1988. Electrodiffusion of ions approaching the mouth of a conducting membrane channel.Biophys. J. 53:863–875 [DOI] [PMC free article] [PubMed] [Google Scholar]
- Ramsey I.S., Moran M.M., Chong J.A., Clapham D.E. 2006. A voltage-gated proton-selective channel lacking the pore domain.Nature. 440:1213–1216 [DOI] [PMC free article] [PubMed] [Google Scholar]
- Robinson R.A., Stokes R.H. 2002. Electrolyte Solutions. 2nd Revised Ed Dover Publications, Mineola, NY: 590 pp [Google Scholar]
- Sasaki M., Takagi M., Okamura Y. 2006. A voltage sensor-domain protein is a voltage-gated proton channel.Science. 312:589–592 [DOI] [PubMed] [Google Scholar]
- Sawada M., Imai F., Suzuki H., Hayakawa M., Kanno T., Nagatsu T. 1998. Brain-specific gene expression by immortalized microglial cell-mediated gene transfer in the mammalian brain.FEBS Lett. 433:37–40 [DOI] [PubMed] [Google Scholar]
- Schumaker M.F. 2003. Numerical framework models of single proton conduction through gramicidin.Front. Biosci. 8:s982–s991 [DOI] [PubMed] [Google Scholar]
- Schumaker M.F., Pomès R., Roux B. 2000. A combined molecular dynamics and diffusion model of single proton conduction through gramicidin.Biophys. J. 79:2840–2857 [DOI] [PMC free article] [PubMed] [Google Scholar]
- Sitsapesan R., Montgomery R.A., MacLeod K.T., Williams A.J. 1991. Sheep cardiac sarcoplasmic reticulum calcium-release channels: modification of conductance and gating by temperature.J. Physiol. 434:469–488 [DOI] [PMC free article] [PubMed] [Google Scholar]
- Starace D.M., Bezanilla F. 2004. A proton pore in a potassium channel voltage sensor reveals a focused electric field.Nature. 427:548–553 [DOI] [PubMed] [Google Scholar]
- Stojilkovic K.S., Berezhkovskii A.M., Zitserman V.Y., Bezrukov S.M. 2003. Conductivity and microviscosity of electrolyte solutions containing polyethylene glycols.J. Chem. Phys. 119:6973–6978 [Google Scholar]
- Swanson J.M.J., Maupin C.M., Chen H., Petersen M.K., Xu J., Wu Y., Voth G.A. 2007. Proton solvation and transport in aqueous and biomolecular systems: insights from computer simulations.J. Phys. Chem. B. 111:4300–4314 [DOI] [PMC free article] [PubMed] [Google Scholar]
- Swietach P., Zaniboni M., Stewart A.K., Rossini A., Spitzer K.W., Vaughan-Jones R.D. 2003. Modelling intracellular H+ ion diffusion.Prog. Biophys. Mol. Biol. 83:69–100 [DOI] [PubMed] [Google Scholar]
- Thomas R.C., Meech R.W. 1982. Hydrogen ion currents and intracellular pH in depolarized voltage-clamped snail neurones.Nature. 299:826–828 [DOI] [PubMed] [Google Scholar]
- Urry D.W., Alonso-Romanowski S., Venkatachalam C.M., Bradley R.J., Harris R.D. 1984. Temperature dependence of single channel currents and the peptide libration mechanism for ion transport through the gramicidin A transmembrane channel.J. Membr. Biol. 81:205–217 [DOI] [PubMed] [Google Scholar]
- Zifarelli G., Soliani P., Pusch M. 2008. Buffered diffusion around a spherical proton pumping cell: a theoretical analysis.Biophys. J. 94:53–62 [DOI] [PMC free article] [PubMed] [Google Scholar]


