Abstract
This study demonstrates that a combination of unconventional electron microscopy techniques provides a quantitative means of assessing the degree of monodispersity of gadolinium (Gd) diethylenetriamine pentaacetic acid-conjugated polyamidoamine (PAMAM) dendrimers, which are designed for diagnostic imaging and delivering chemotherapeutics. Specifically, analysis of images acquired in the scanning transmission electron microscopy mode yields the distribution of molecular weights of individual dendrimers, whereas analysis of images acquired in the energy-filtering transmission electron microscopy mode yields the distribution of Gd atoms bound to the dendrimer nanoparticles. Measured compositions of Gd-conjugated G7 and G8 PAMAM dendrimers were consistent with the known synthetic chemistry. The G7 dendrimers had a mass of 330 ± 4 kDa and 266 ± 4 Gd atoms (± standard error of the mean). The G8 dendrimers had a mass of 600 ± 8 kDa and 350 ± 5 Gd atoms (± standard error of the mean). This approach will be particularly attractive for assessing the mass, composition and homogeneity of metal-containing organic nanoparticles used in nanomedicine.
Keywords: dendrimer, EFTEM, energy-filtered transmission electron microscopy, gadolinium, mass measurement, scanning transmission electron microscopy, STEM
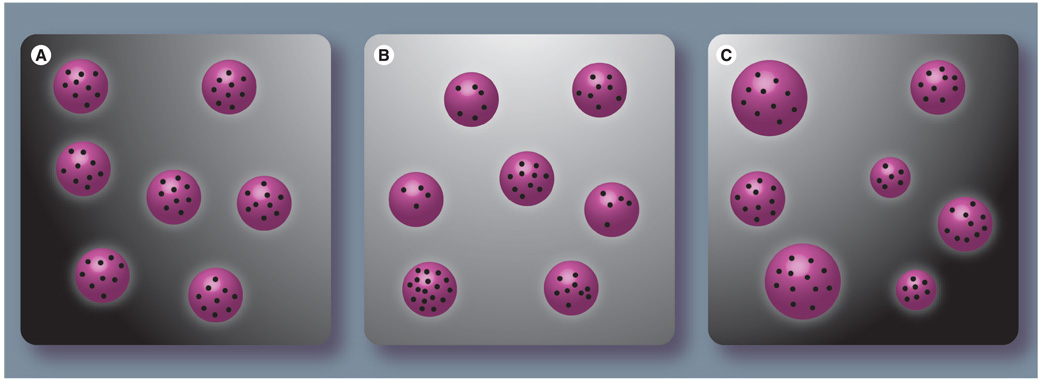
The ability to create molecular nanostructures of controlled size and chemical functionality offers a powerful approach for the design of multifunctional biomedical nanocarriers containing image contrast-enhancing agents and therapeutic drugs. For any nanoparticle used in the diagnosis and treatment of disease, it is necessary to establish the degree of monodispersity in terms of size, molecular weight and composition (Figure 1) [1]. Dendrimers, a class of regularly branched polymeric nanostructures (Figure 2), present particularly attractive attributes as biomedical nanocarriers [2–4]. First, dendrimers can be synthesized to possess large numbers of chemically functional surface groups, which makes them suitable for the attachment of various chelating agents, fluorescent labels, cell-targeting ligands and drugs. Second, dendrimers of various generations can be synthesized to optimize their use for a particular biomedical application. Third, compared with some alternative nanocarriers (e.g., liposomes), dendrimers present high degrees of mono-dispersity within a given generation, therefore minimizing therapeutic variability.
Figure 1. Different populations of nanoparticles (purple spheres) loaded with a contrast agent (dark dots).
(A) Population of nanoparticles with roughly uniform size, molecular weight and composition, which is required to minimize therapeutic variability in vivo. (B & C) Nanoparticles with homogeneous size and molecular weight distributions but with different amounts of contrast agent (B) or with an inhomogeneous size distribution (C).
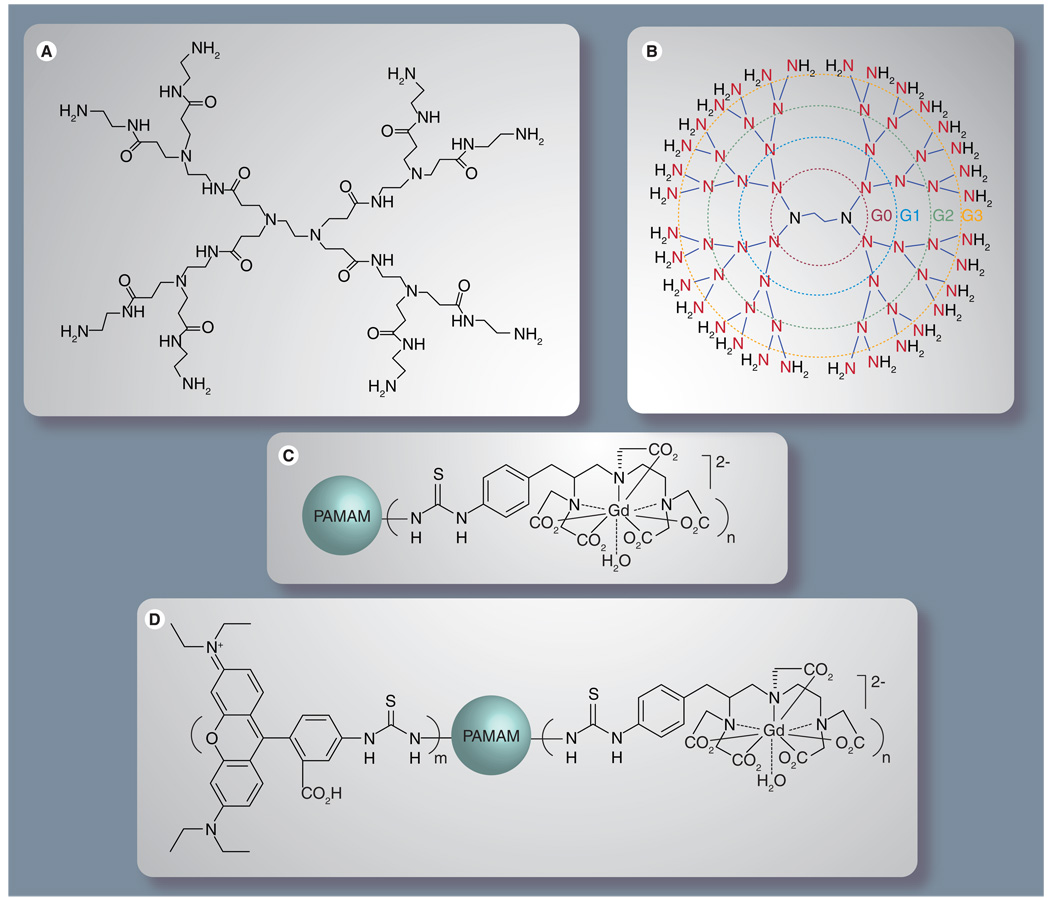
Figure 2. Chemical structure of native and functionalized polyamidoamine dendrimers.
(A) Complete chemical structure of a generation-1 (G1) PAMAM dendrimer. (B) Simplified chemical structure of a generation-3 PAMAM dendrimer. (C) Gadolinium diethylenetriamine pentaacetic acid (Gd3+-DTPA) chelate conjugated to a PAMAM dendrimer. (D) Gd3+-DTPA and rhodamine B conjugated to a PAMAM dendrimer.
PAMAM: Polyamidoamine.
Polyamidoamines (PAMAMs) comprise a common class of dendrimers (Figure 2) highly soluble in aqueous solution that can contain a high number of chemically active terminal amino groups [5]. In particular, PAMAM dendrimers conjugated with gadolinium (Gd3+)-diethylene triamine pentaacetic acid (DTPA) have been considered for use as MRI contrast agents of neoplastic tissue, specific organs and the lymphatic system [3,6–8]. Furthermore, attachment of receptor-binding agents and chemotherapy drugs to dendrimers has also been considered as a means for targeting and killing tumor cells [2,9].
The effectiveness of dendrimer use for medical imaging and drug-delivery applications can depend, among other factors, on their average diameter, average molecular weight, degree of conjugation with chelating agents, number of Gd atoms and degree of monodispersity. For MRI and treatment of neoplastic tissue, for example, these variables can be expected to impact critical physiological properties of the dendrimers such as blood-circulation half-life, vascular permeability and retention time within the tissue. Native, unconjugated dendrimers typically have well-defined molecular weights and a high degree of monodispersity. However, after conjugation with Gd3+-DTPA chelates, some of the physical properties of the native dendrimers become less well defined and are difficult to accurately quantify through direct measurements.
In this work we implement a hybrid experimental approach, in which scanning transmission electron microscopy (STEM) and energy-filtered TEM (EFTEM) are used in combination (Figure 3 & Figure 4), to determine some of the important physical properties of PAMAM dendrimers conjugated with Gd3+-DTPA chelates. EFTEM is a technique traditionally used in the biological sciences for detection and quantification of specific elements within cells and tissue sections, particularly nitrogen, phosphorus, calcium and sulfur [10–12]. This technique consists of recording and analyzing the energy-loss signal of transmitted electrons that have interacted inelastically with specific elements in the specimen. The annular dark-field (ADF) STEM technique, on the other hand, is traditionally used in biology for determining the total molecular weight distribution of macromolecular assemblies adsorbed onto thin carbon support films [13–15]. The principle of the ADF STEM technique consists in calibrating the elastic signal obtained from the macromolecules of unknown mass to that of a specimen such as tobacco mosaic virus (TMV) whose mass is accurately known.
Figure 3. Quantitative scanning transmission electron microscopic imaging of dendrimer nanoparticles.
(A) Principle of scanning transmission electron microscopy (STEM) image formation and molecular weight determination. A focused electron probe of sub-nanometer diameter rasters across nanoparticles adsorbed onto an ultra-thin carbon substrate. At each pixel of the raster, an annular dark-field detector collects electrons that are scattered to high angles. Determining the unknown mass of nanoparticles can be accomplished by calibrating the recorded image intensities with an internal mass calibration standard (tobacco mosaic virus). Example STEM images of (B) dendrimers and (C) tobacco mosaic virus. Scale bars are 100 nm.
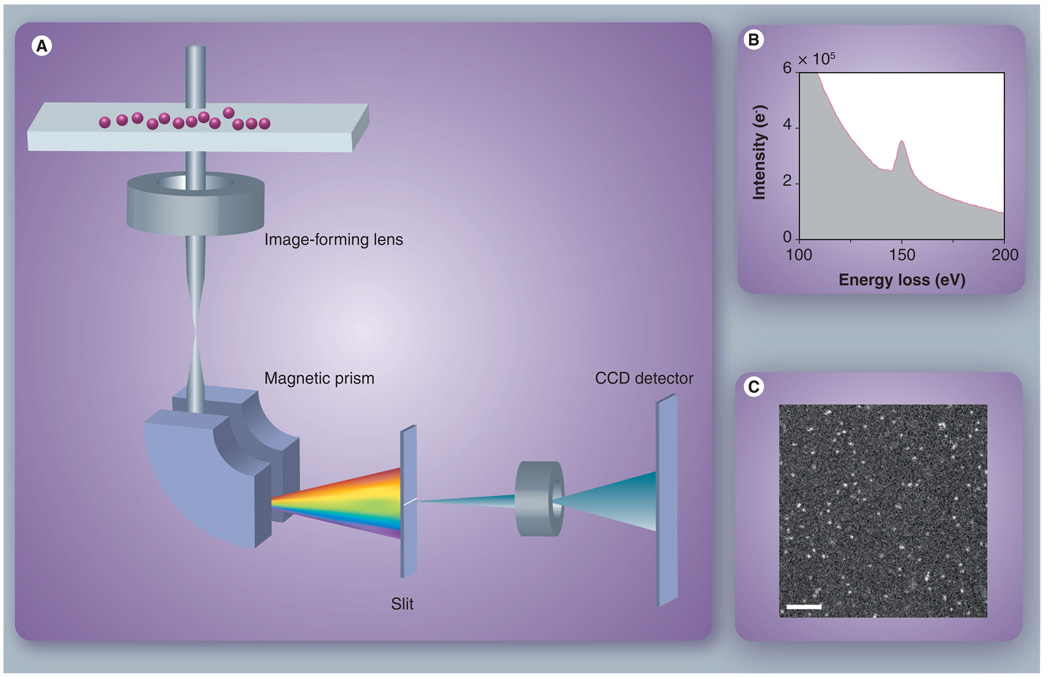
Figure 4. Quantitative energy-filtered transmission electron microscopic imaging of dendrimer nanoparticles.
(A) Principle of energy-filtered transmission electron microscopy (EFTEM) image formation. A broad electron beam illuminates a specimen of nanoparticles deposited onto an ultra-thin carbon substrate, exciting inner-shell electrons of specific atoms. A magnetic prism disperses the transmitted electrons according to energy loss, and a slit selects those electrons of a particular energy loss range. An energy-filtered image is formed at the CCD detector plane by lenses after the slit. (B) Energy-loss spectrum around gadolinium (Gd) core-loss edge obtained from a thick layer of Gd-G7 dendrimers. (C) Example EFTEM image of Gd distributions in dendrimer nanoparticles. Scale bar is 100 nm.
Here, we show that with the EFTEM–STEM hybrid approach it is possible to determine the total molecular weight of PAMAM dendrimers conjugated with Gd3+-DTPA chelates, as well as the number of DTPA molecules and Gd atoms attached per dendrimer nanoparticle.
Materials & methods
PAMAM dendrimers
In this work, we utilized three distinct specimens of dendrimer nanoparticles: generation-7 PAMAM dendrimers conjugated with Gd3+-DTPA chelate; generation-8 PAMAM dendrimers conjugated with Gd3+-DTPA chelate; and generation-8 PAMAM dendrimers conjugated with rhodamine (Rh)B as well as with Gd3+-DTPA chelate. Bifunctional chelating agents and functionalized PAMAM dendrimers were synthesized according to described procedures [5,16,17]. Briefly, Gd-DTPA dendrimers were prepared by using a molar reactant ratio of 2:1 or more bifunctional chelate to dendrimer surface amine groups. The duration of the chelation reaction was 48 h. RhB-labeled Gd-DTPA dendrimers were prepared by stirring RhB isothiocyanate and PAMAM dendrimers at a 1:9 molar ratio of RhB isothiocyanate to dendrimer surface amine groups in methanol at room temperature for 12 h. Isothiocyanate-activated DTPA was then added in excess and reacted for an additional 48 h, followed by chelation of Gd after the removal of the t-butyl protective groups on DTPA. Intermediate and final products were purified using a Millipore Centriprep® (Millipore, Billerica, MA, USA) ultrafiltration device with a 10 kDa molecular weight cut-off and washed with water until low molecular contaminants were removed.
Electron microscopy
Specimens for EFTEM and STEM imaging were prepared by adsorbing dendrimers from 5 µl droplet solutions onto 3-nm thick carbon support films covering lacey carbon-coated 300 mesh copper electron microscopy grids. Grids were glow-discharged in a reduced atmosphere of air to facilitate adsorption. After adsorption for 2 min, excess solution was blotted with filter paper, washed five times with 5 µl droplets of deionized water and left to dry. EFTEM and ADF STEM images were recorded using a 300-kV Tecnai TF30 Shottky field-emission electron microscope (FEI, Hillsboro, OR, USA) equipped with a Tridiem post-column imaging filter (Gatan Inc., Pleasaton, CA, USA) and an in-column ADF STEM detector (Fischione, Export, PA, USA). STEM imaging for all dendrimer nanoparticles was performed with an image pixel size of 0.86 nm and at an electron dose of 2600 e/nm2, which was sufficiently low to avoid any significant mass loss from the specimens. EFTEM images were recorded with pixel sizes of 1.7–2.6 nm and with electron doses in the range of 1 to 10 × 106 e/nm2. In particular, images of generation-8 dendrimers were acquired with a 2.6-nm pixel size because these specimens tended to drift when illuminated at higher magnification.
Basis for the quantification of dendrimer nanoparticles conjugated with Gd3+-DTPA
Elemental quantification with EFTEM
EFTEM imaging (Figure 4) enables quantification of the total number of Gd atoms (nGd) within a particular dendrimer nanoparticle using the following:
| (1) |
where S(Δ,β)Gd is the calculated net Gd signal at the N4,5 core edge at 150 eV, measured within an energy band Δ = 20 eV and inside a collection semi-angle β = 11 mrad; σ(Δ,β)Gd is the Gd N4,5 inelastic scattering cross-section for the energy band Δ and collection semi-angle β; I0(Δ,β) is the measured intensity in the transmitted electron beam, including the zero-loss peak for the same energy band and collection angle. The summation in Equation 1 is over the number of pixels n encompassing a single dendrimer nanoparticle, with A representing the pixel area. In this work, the two-window method was used for extraction of the net Gd signal S(Δ,β)Gd. This procedure has been explained in detail elsewhere [18].
The Gd N4,5 inelastic-scattering cross-section, σ(Δ,β)Gd, was determined experimentally from electron energy-loss spectra recorded in imaging mode from a thin-film standard of Gd2O3[19,20]:
| (2) |
where S(Δ1,β)Gd and S(Δ2,β)O are the net signal intensities at the Gd N4,5- and O K-shell edges, respectively, NO:NGd is the atomic ratio of O to Gd within the Gd2O3compound, and σ(Δ2,β)O is the O K-edge inelastic scattering cross-section. The values used for Δ1, Δ2 and β were 20 eV, 100 eV, and 11 mrad, respectively. σ(Δ2,β)O was obtained from a Hartree-Slater model incorporated into the Gatan DigitalMicrograph software (Gatan Inc.), and the net intensities S(Δ1,β)Gd and S(Δ2,β)O were obtained using the standard power law method for background subtraction [20]. For extraction of S(Δ1,β)Gd in particular, we took into account the Fano effect [21], which causes a reduction in the energy-loss intensity near the onset of N4,5 inner-shell edges, by modeling the background intensity sufficiently away from the onset of the Gd N4,5 edge (the background was modeled within the energy range of 110 to 130 eV). Modeling the background too close to the onset of the Gd edge caused an overestimation of σ(Δ,β)Gd of approximately 5%. Finally, before applying Equation 2, the energy-loss spectrum of Gd2O3 was Fourier deconvolved [20] to remove contributions from plural inelastic scattering to the Gd and O core edge intensities. From eight independent measurements, we thus found a value for σ(Δ,β)Gd of (4.4 ± 0.6) × 10−6 nm2/at.
Mass measurement with ADF STEM
Having determined the number of Gd atoms per dendrimer nanoparticle with EFTEM, we then used STEM imaging (Figure 3) for measurement of the total molecular weight of the PAMAM dendrimers conjugated with Gd3+-DPTA. The method of molecular weight measurement using ADF STEM imaging is well described in the literature [13–15]. Here, we first record ADF STEM images of dendrimer nanoparticles at sufficiently low electron-dose conditions (~2600 e/nm2). We then extract the net STEM signal from the nanoparticles and calibrated this net signal to that obtained from a specimen of TMV whose mass per unit length is accurately known (131.4 kDa/nm). This standard calculation, however, overestimates the total molecular weight of the dendrimers. The reason for this stems from the fact that each heavy atom of Gd contributes a significantly higher signal to the ADF STEM image than each of the light atoms that constitute the dendrimers (C, N and O, excluding hydrogen). We correct for this effect and calculate a final total molecular mass for the dendrimers, MT, using the following expression:
| (3) |
where MTunc is the uncorrected total mass of the dendrimers obtained directly from a calibration with TMV; MGd corresponds to the average mass due exclusively to Gd atoms in the dendrimers, given by MGd = nGd · mwGd, where nGd is obtained from Equation 1 and where mwGd is the molecular mass of a single Gd atom (157 Da). The variable f is given by:
| (4) |
where σ(β)1 is the average elastic scattering cross-section per unit mass characteristic of the light atoms that constitute the dendrimers, which is calculated taking into account the atomic fractions for C, N and O, which are 0.61, 0.17 and 0.22, respectively (deviations from these atomic fractions will not affect the calculations by any significant amount). σ(β)Gd is the elastic scattering cross-section per unit mass for Gd; β is the collection semi-angle of the ADF detector. The calculation of σ(β)1 and σ(β)Gd was performed using a procedure similar to the one described in [22]. For the experimental conditions that were used in this work, the value of f was determined to be 2.3.
The number of DTPA molecules per dendrimer nanoparticle (nDTPA) can be estimated according to:
| (5) |
where Mucj is the mass of the unconjugated dendrimer, which is known for any particular dendrimer generation, and mwDTPA is the molecular weight of a single DTPA molecule (540.5 Da).
Results
ADF STEM images of PAMAM dendrimer nanoparticles conjugated with Gd3+-DTPA are shown in Figure 5A & B for generations 7 and 8, respectively (henceforth referred to as Gd-G7 and Gd-G8). Dendrimers of generation-8 conjugated additionally with Rh B are also shown in Figure 5C (Rh-Gd-G8).
Figure 5. Annular dark-field scanning transmission electron microscopy images of dendrimer nanoparticles adsorbed onto ultra-thin carbon films.
(A) Gd-G7, (B) Gd-G8 and (C) Rh-Gd-G8. The images suggest a high degree of homogeneity of nanoparticles within each population. Scale bar is 30 nm.
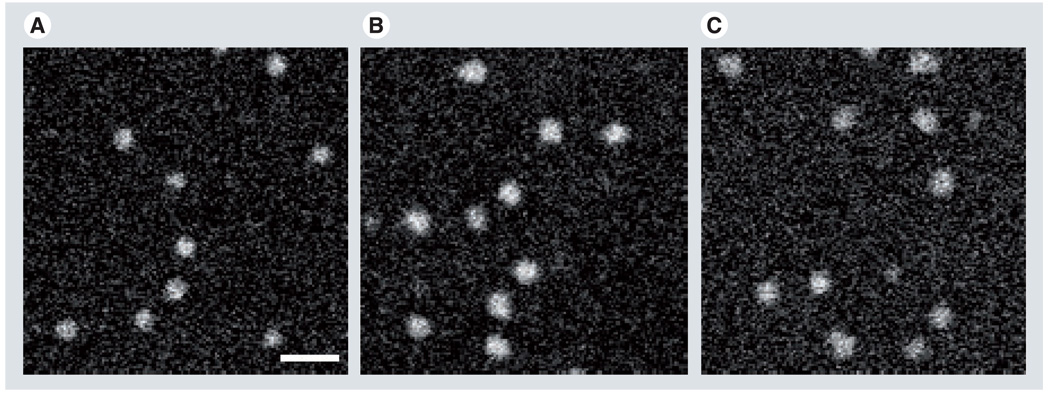
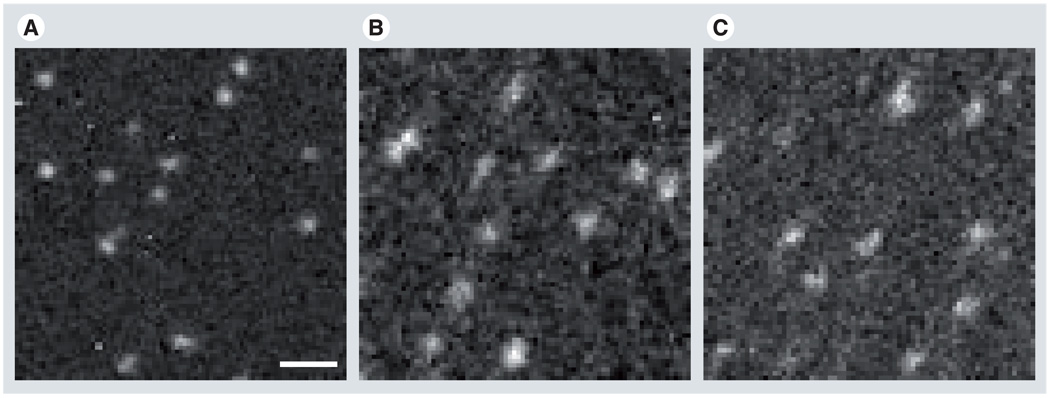
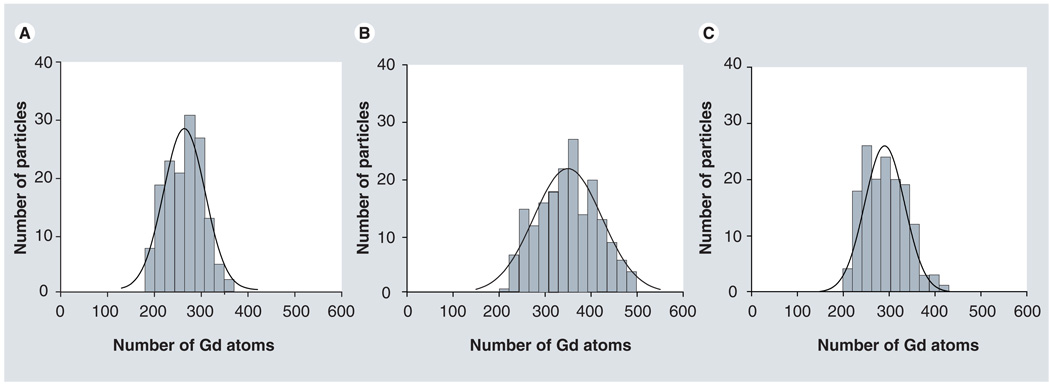
We utilized EFTEM imaging to first quantify the number of Gd atoms within Gd-G7, Gd-G8 and Rh-Gd-G8. EFTEM-Gd elemental maps for these different dendrimers are shown in Figure 6. For each dendrimer class, we determined nGd using Equation 1 from approximately 160 nanoparticles. The results for nGd are displayed as histograms in Figure 7 and are summarized in Table 1.
Figure 6. Energy-filtered transmission electron microscopy images of gadolinium distributions within (A) Gd-G7, (B) Gd-G8 and (C) Rh-Gd-G8 dendrimer nanoparticles.
Scale bar is 30 nm.
Figure 7. Histograms displaying the distribution in the number of gadolinium atoms within (A) Gd-G7, (B) Gd-G8 and (C) Rh-Gd-G8 dendrimer nanoparticles.
Gd: Gadolinium.
Table 1.
Physical properties of polyamidoamine dendermers conjugated with Gd3+-DTPA.
| Total mass (kDa) | Gd atoms | DTPA ligands | Terminal groups | Conjugation rate | Gd/DTPA | wt% Gd | |
|---|---|---|---|---|---|---|---|
| Gd-G7 | 330 ± 4* | 266 ± 4 | 308 | 512 | 61% | 0.86 | 12.7% |
| Gd-G8 | 600 ± 8 | 350 ± 5 | 562 | 1024 | 55% | 0.62 | 9.2% |
| Rh-Gd-G8 | 557 ± 6 | 291 ± 4 | – | 1024 | – | – | 8.2% |
Standard error of the mean.
The number of Gd atoms was obtained with energy-filtered transmission electron microscopy using Equation 1; the total dendrimer mass was determined with scanning transmission electron microscopy (STEM) using Equation 3; the number of DTPA molecules was calculated from STEM data using Equation 5.
DTPA: Diethylenetriamine pentaacetic acid; Gd: Gadolinium; Rh: Rhodamine.
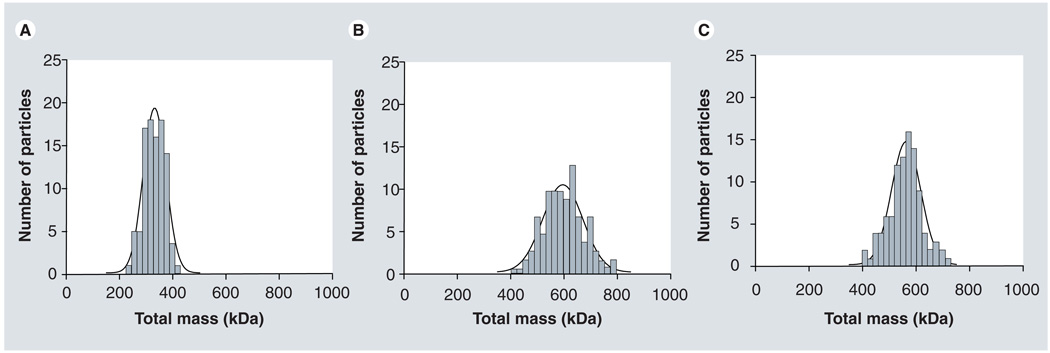
The average total molecular weight of the dendrimer nanoparticles was determined with ADF STEM imaging according to Equation 3, and the results are summarized in Table 1. The homogeneity in the molecular weight distribution of the dendrimers is shown in Figure 8 as a series of histograms. In Table 1 we have also included the average number of DTPA molecules attached per dendrimer nanoparticle, which was determined using Equation 5, as well as the ratio of Gd to DTPA.
Figure 8. Histograms displaying the total molecular-weight distribution within (A) Gd-G7, (B) Gd-G8 and (C) Rh-Gd-G8 dendrimer nanoparticles.
The standard deviation associated with the mass distribution in each histogram is 12, 13 and 11% of the total dendrimer mass for Gd-G7, Gd-G8 and Rh-Gd-G8, respectively. These low values indicate that the dendrimers that were analyzed form a relatively homogeneous population.
Discussion
The EFTEM and STEM imaging modes, when used in combination, enable quantification of a few important physical properties of dendrimer nanoparticles conjugated with Gd3+-DTPA. For Gd-G7, we obtained an average number of Gd atoms of 266 ± 4 (± standard error of the mean), which corresponds to 12.7% of the total dendrimer mass (Table 1). This result is in agreement with atomic emission spectroscopy (AES) data which gave a weight fraction for Gd of 12.2%. Similarly, the weight fraction of Gd within Gd-G8 determined from the EFTEM–STEM approach was also consistent with that obtained from AES data (9.2 and 10.2%, respectively).
Dendrimer nanoparticles of a given generation contain a well-defined number of active terminal groups on their surface for attachment of DTPA molecules. The specific conjugation rate (i.e., the percentage of these active sites occupied by DTPA) is variable and depends on specific parameters during synthesis. The conjugation rate can normally be estimated from the ratio of S to N obtained from AES [5]. Our EFTEM–STEM hybrid method provides an independent measurement of the number of DTPA molecules attached to each dendrimer nanoparticle (Table 1). This can complement AES data and further assist in the control of synthesis conditions for achieving a desired conjugation rate. From the average numbers of DTPA molecules and Gd atoms per dendrimer nanoparticle, we can also calculate ratios of Gd to DTPA. Table 1 shows a smaller ratio of Gd to DTPA for Gd-G8 than for Gd-G7 (0.62 and 0.86, respectively). This can be explained by steric hindrance to metal-ion complexation caused by overcrowding of DTPA molecules on the surface of higher-generation dendrimers (diameter increases linearly with dendrimer generation whereas number of terminal amino groups available for DTPA binding grows exponentially) [5].
As discussed previously, PAMAM dendrimers provide a means for creating multifunctional nanoparticles by conjugating to their surface chemical species with different properties. For instance, Gd and Rh can be conjugated to dendrimers to develop a dual-modality imaging probe for the optical imaging and MRI of tumor cells in in vitro and in vivo settings, respectively [23,24]. We applied the EFTEM–STEM approach to Rh-Gd-G8 dendrimers in order to evaluate quantitatively the effect of Rh conjugation on the number of Gd atoms as well as on the total molecular weight of Gd-G8. These measurements can help evaluate whether any changes in physiological properties caused by the conjugation of Rh (or any other molecule for that matter) can be explained by possible variations in composition and molecular weight. As shown in Table 1, the average number of Gd atoms within Rh-Gd-G8 was 291 ± 4 (± standard error of the mean), resulting in an 8.2% weight fraction for Gd, which is consistent with AES measurements (9.2%). The number of Gd atoms for Rh-Gd-G8 (291 ± 4) is slightly lower than that for Gd-G8 (350 ± 5). This could be explained by a reduction in the number of available binding sites for DTPA chelates at the surface of the Rh-Gd-G8 dendrimers, due to the presence of Rh molecules.
For applications in nanomedicine, large variations in the size, mass and chemical composition of nanoparticles can result in therapeutic variability (Figure 1) [1,25]. Contrary to typical bulk measurements used in the characterization of biomedical nanoparticles, our method provides both qualitative and quantitative assessments of particle homogeneity within any given population. Specifically, STEM images such as those in Figure 5 suggest a high degree of homogeneity associated with our dendrimers. This degree of homogeneity can be more quantitatively judged from the histograms displayed in Figure 8, which give the total molecular weight distribution for each different dendrimer class. From the histograms, the standard deviations in the mass measurements for Gd-G7, Gd-G8 and Rh-Gd-G8 were 12, 13 and 11% of the total dendrimer mass, respectively. These low values therefore confirm that the analyzed dendrimers form a relatively homogeneous population.
We highlight that the histogram widths displayed in Figure 8 give an overestimated assessment of the real spread in molecular weight distribution of the dendrimers, due to the incorporation of statistical noise in the calculation of MT (Equation 3). Two of the factors contributing to this statistical noise are characteristic of molecular weight measurements with the STEM: shot noise in the incident electron beam and subtraction of a carbon-support film signal from the total STEM signal (total signal = support film + dendrimers). For dendrimers chelated with Gd, an additional source of noise is present which is due to the subtraction of the term MGd (f − 1) from MTunc (Equation 3). Despite the presence of statistical noise, histograms such as those in Figure 8 can be very helpful in providing an upper bound for the spread in total molecular weight of dendrimers chelated with Gd.
Conclusion
Dendrimers are an emerging class of multifunctional nanoparticles for applications in nanomedicine. These nanostructures are suitable for the attachment of various chelating agents, fluorescent labels, cell-targeting ligands and drugs, which enables them to be utilized in a variety of biomedical applications such as MRI and targeted drug delivery. Here, we have shown that an EFTEM–STEM hybrid approach enables determination of the total molecular weight distribution within a population of dendrimers conjugated with Gd3+-DTPA chelates. We have also shown that using this combined strategy it is possible to obtain a value for the average number of DTPA molecules and Gd atoms attached to each dendrimer nanoparticle. Use of the EFTEM–STEM approach is not limited to dendrimers but can also be applied to the quantitative characterization of other multifunctional nanostructures. It will be particularly attractive for use with nanoparticles containing Gd, Fe or I, since their total molecular weight is difficult to determine with the STEM technique alone. Furthermore, it will be especially important in providing quantitative measures of particle homogeneity within a given population
Future perspective
Quantitative electron microscopy provides a useful approach for establishing the degree of monodispersity of PAMAM dendrimers and other types of organic nanoparticles. Unanswered questions are concerned with whether specific chemical elements contained within chemopharmaceuticals, which are attached to dendrimers, can also be quantified along with contrast agents such as Gd.
Executive summary.
Scanning transmission electron microscopy provides the distribution of molecular masses of organic nanoparticles, and energy-filtered transmission electron microscopy provides the distribution of specific chemical elements bound to the nanoparticles.
Quantitative electron microscopy using scanning transmission electron microscopy and energy-filtered transmission electron microscopy can be used to characterize the composition of polyamidoamine dendrimers conjugated to the magnetic imaging contrast agent, gadolinium diethylenetriamine pentaacetic acid.
The molecular masses of G7 and G8 dendrimers and the numbers of attached gadolinium atoms determined by electron microscopy correlate with the predicted structure, as well as with experimental atomic emission spectroscopy measurements.
Quantitative electron microscopy provides useful information about the degree of monodispersity of functionalized dendrimers because measurements are obtained from individual nanoparticles.
Acknowledgments
Financial & competing interests disclosure
This work was supported by the Intramural Research Program of the National Institute of Biomedical Imaging and Bioengineering in the NIH, and the NIH Roadmap for Medical Research Initiative for support of the Image Probe Development Center. The authors have no other relevant affiliations or financial involvement with any organization or entity with a financial interest in or financial conflict with the subject matter or materials discussed in the manuscript apart from those disclosed.
No writing assistance was utilized in the production of this manuscript.
Ethical conduct of research
The authors state that they have obtained appropriate institutional review board approval or have followed the principles outlined in the Declaration of Helsinki for all human or animal experimental investigations. In addition, for investigations involving human subjects, informed consent has been obtained from the participants involved.
Bibliography
- 1.Hall JB, Dobrovolskaia MA, Patri AK, McNeil SE. Characterization of nanoparticles for therapeutics. Nanomedicine. 2007;2:789–803. doi: 10.2217/17435889.2.6.789. [DOI] [PubMed] [Google Scholar]
- 2.Svenson S, Tomalia DA. Dendrimers in biomedical applications. Adv. Drug Deliv. Rev. 2005;57:2106–2129. doi: 10.1016/j.addr.2005.09.018. [DOI] [PubMed] [Google Scholar]
- 3.Kobayashi H, Brechbiel MW. Nano-sized MRI contrast agents with dendrimer cores. Adv. Drug Deliv. Rev. 2005;57:2271–2286. doi: 10.1016/j.addr.2005.09.016. [DOI] [PubMed] [Google Scholar]
- 4.Lee CC, MacKay JA, Fréchet JMJ, Szoka FC. Designing dendrimers for biological applications. Nat. Biotechnol. 2005;23:1517–1526. doi: 10.1038/nbt1171. [DOI] [PubMed] [Google Scholar]
- 5.Bryant LH, Brechbiel MW, Wu C, Bulte JWM, Herynek V, Frank JA. Synthesis and relaxometry of high-generation (G = 5, 7,9, and 10) PAMAM dendrimer-DOTA-gadolinium chelates. J. Magn. Reson. Imag. 1999;9:348–352. doi: 10.1002/(sici)1522-2586(199902)9:2<348::aid-jmri30>3.0.co;2-j. [DOI] [PubMed] [Google Scholar]
- 6.Kobayashi H, Kawamoto S, Choyke PL, et al. Comparison of dendrimer-based macromolecular contrast agents for dynamic micro-magnetic resonance lymphangiography. Magn. Reson. Med. 2003;50:758–766. doi: 10.1002/mrm.10583. [DOI] [PubMed] [Google Scholar]
- 7.Zhang Z, Nair SA, McMurry TJ. Gadolinium meets medicinal chemistry: MRI contrast agent development. Curr. Medic. Chem. 2005;12:751–778. doi: 10.2174/0929867053507379. [DOI] [PubMed] [Google Scholar]
- 8.Regino CAS, Walbridge S, Bernardo M, et al. A dual CT–MR dendrimer contrast agent as a surrogate marker for convection-enhanced delivery of intracerebral macromolecular therapeutic agents. Contrast Media Mol. Imag. 2008;3:2–8. doi: 10.1002/cmmi.223. [DOI] [PMC free article] [PubMed] [Google Scholar]
- 9.Tekade RK, Kumar PV, Jain NK. Dendrimers in oncology: an expanding horizon. Chem. Rev. 2009;109:49–87. doi: 10.1021/cr068212n. [DOI] [PubMed] [Google Scholar]
- 10.Leapman RD, Aronova MA. Localizing specific elements bound to macromolecules by EFTEM. In: McIntosh JR, editor. Methods in Cell Biology. Volume 79. San Diego, CA, USA: Academic Press; 2007. pp. 593–613. [DOI] [PubMed] [Google Scholar]
- 11.Bazett-Jones DP, Li R, Fussner E, Nisman R, Dehghani H. Elucidating chromatin and nuclear domain architecture with electron spectroscopic imaging. Chromos. Res. 2008;16:397–412. doi: 10.1007/s10577-008-1237-3. [DOI] [PubMed] [Google Scholar]
- 12.Aronova MA, Kim YC, Pivovarova NB, Andrews SB, Leapman RD. Quantitative EFTEM mapping of near physiological calcium concentrations in biological specimens. Ultramicroscopy. 2009;109:201–212. doi: 10.1016/j.ultramic.2008.10.003. [DOI] [PMC free article] [PubMed] [Google Scholar]
- 13.Thomas D, Schultz P, Steven AC, Wall JS. Mass analysis of biological macromolecular complexes by STEM. Biol. Cell. 1994;80:181–192. doi: 10.1111/j.1768-322x.1994.tb00929.x. [DOI] [PubMed] [Google Scholar]
- 14.MüCller SA, Engel A. Structure and mass analysis by scanning transmission electron microscopy. Micron. 2001;32:21–31. doi: 10.1016/s0968-4328(00)00022-6. [DOI] [PubMed] [Google Scholar]
- 15.Wall JS, Hainfeld JF. Mass mapping with the scanning transmission electron microscope. Annu. Rev. Biophys. Biophys. Chem. 1986;15:355–376. doi: 10.1146/annurev.bb.15.060186.002035. [DOI] [PubMed] [Google Scholar]
- 16.Wiener EC, Brechbiel MW, Brothers H, et al. Dendrimer-based metal chelates: a new class of magnetic resonance imaging contrast agents. Magn. Reson. Med. 1994;31:1–8. doi: 10.1002/mrm.1910310102. [DOI] [PubMed] [Google Scholar]
- 17.Xu H, Regino CA, Bernardo M, et al. Toward improved syntheses of dendrimer based magnetic resonance imaging contrast agents: new bifunctional diethylenetriaminepentaacetic acid ligands and nonaqueous conjugation chemistry. J. Med. Chem. 2007;50:3185–3193. doi: 10.1021/jm061324m. [DOI] [PubMed] [Google Scholar]
- 18.Aronova MA, Kim YC, Zhang G, Leapman RD. Quantification and thickness correction of EFTEM phosphorus maps. Ultramicroscopy. 2007;107:232–244. doi: 10.1016/j.ultramic.2006.07.009. [DOI] [PMC free article] [PubMed] [Google Scholar]
- 19.Hofer F. Determination of inner-shell cross-sections for EELS-quantification. Microsc. Microanal. Microstruc. 1991;2:215–230. [Google Scholar]
- 20.Egerton RF. Electron Energy-Loss Spectroscopy in the Electron Microscope. NY, USA: Plenum Press; 1996. [Google Scholar]
- 21.Rez P. Scattering cross-sections in electron microscopy and analysis. Microsc. Microanal. 2001;7:356–362. doi: 10.1017.S1431927601010340. [DOI] [PubMed] [Google Scholar]
- 22.Sousa AA, Leapman RD. Quantitative STEM mass measurement of biological macromolecules in a 300 kV TEM. J. Microsc. 2007;228:25–33. doi: 10.1111/j.1365-2818.2007.01819.x. [DOI] [PubMed] [Google Scholar]
- 23.Xu H, Regino CAS, Koyama Y, et al. Preparation and preliminary evaluation of a biotin-targeted, lectin-targeted dendrimer-based probe for dual-modality magnetic resonance and fluorescence imaging. Bioconj. Chem. 2007;18:1474–1482. doi: 10.1021/bc0701085. [DOI] [PubMed] [Google Scholar]
- 24.Sarin H, Kanevsky AK, Wu H, et al. Effective transvascular delivery of nanoparticles across the blood-brain tumor barrier into malignant glioma cells. J. Transl. Med. 2008;6:80. doi: 10.1186/1479-5876-6-80. [DOI] [PMC free article] [PubMed] [Google Scholar]
- 25.Lengyel JS, Milne JLS, Subramanian S. Electron tomography in nanoparticle imaging and analysis. Nanomedicine. 2008;3:125–131. doi: 10.2217/17435889.3.1.125. [DOI] [PMC free article] [PubMed] [Google Scholar]


