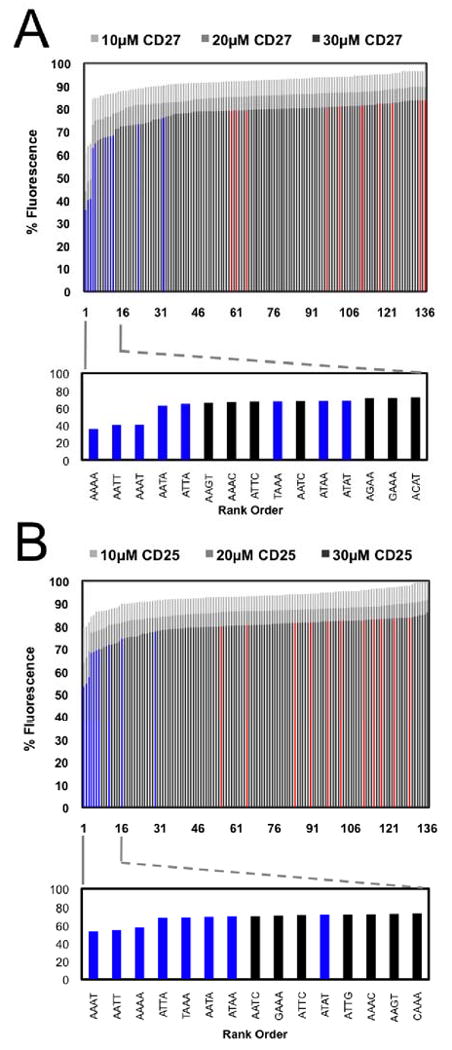
Figure 2.

FID results cast as merged-bar histograms and identification (lower expansion) of the top 15 four base pair cassettes selected (red bars depict GC-only four base pair cassettes, blue bars depict AT-only four base pair cassettes, and black bars depict mixed sequence four base pair cassettes). (A) CD27 analyzed at 10, 20, and 30 μM concentrations and (B) CD25 analyzed at 10, 20, and 30 μM concentrations.
