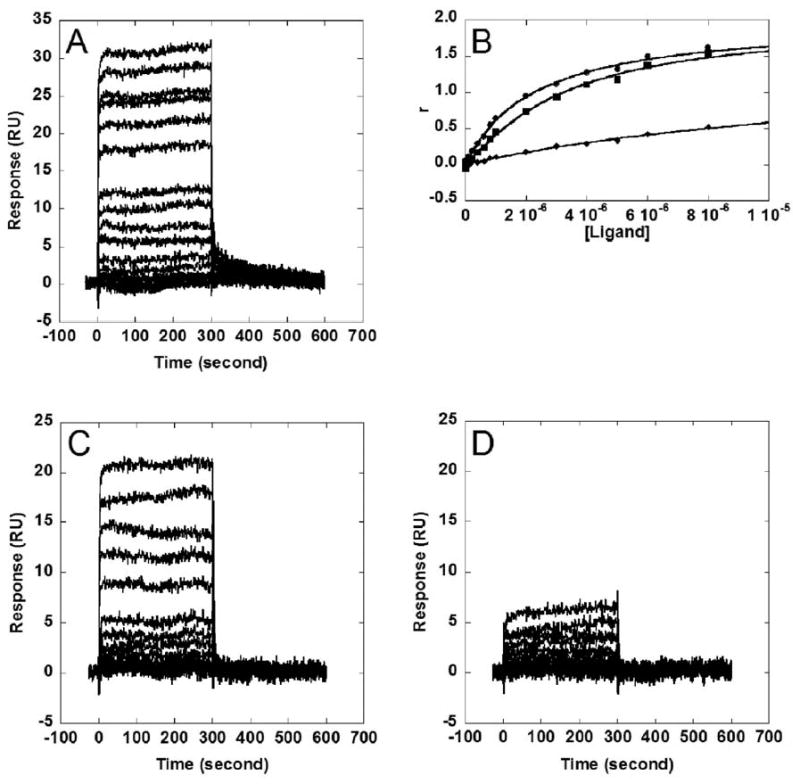
Figure 3.

(A) Sensorgrams for the interaction of CD27 with the AATT hairpin. (B) Binding curves of CD27 to three different DNA hairpins; AATT (circles), alternating AT (squares), and alternating CG (diamonds). The strongest binding was observed with AATT hairpin. (C) Sensorgrams for the interaction of CD25 with (AT)4 hairpin and (D) with (CG)4 hairpin. The plots illustrate preferential binding to the AT sequences. Both plots have the same concentration range from 1 nM (lowest sensorgram) to 8 μM (highest sensorgram).
