Abstract
Suppressor of cytokine signalling 2 (SOCS-2), a dual effector of growth hormone signalling, was found to be heterogeneously expressed in murine liver parenchyma. Data from Affymetrix gene arrays, confirmed by quantitative RT-PCR using preparations of periportal and pericentral hepatocyte subpopulations as well as immunohistochemical detection, showed a preferential expression of SOCS-2 in pericentral hepatocytes. Stimulation of cultured periportal and pericentral hepatocyte subpopulations by different concentrations of growth hormone for 1 h resulted at 100 ng mL−1 in a 1.6-fold and 4.3-fold increase of SOCS-2 mRNA, respectively. Likewise, insulin-like growth factor-1, another physiological target of growth hormone, was stimulated preferentially in pericentral hepatocytes. As growth hormone receptor was found to be homogeneously expressed in mouse liver parenchyma, our data indicate that growth hormone signalling downstream of growth hormone receptor is more sensitive and/or effective in pericentral than in periportal hepatocytes. Presumably, the heterogeneous distribution of SOCS-2 may contribute to the pericentral preference of growth hormone action via differential feedback.
Keywords: growth hormone, hepatocytes, insulin-like growth factor-1, liver, suppressor of cytokine signalling 2
Introduction
Despite its relatively uniform morphological and histological structure, liver displays a striking functional heterogeneity between hepatocytes from the periportal and pericentral zones of the liver lobule (for a review see Gebhardt, 1992). All major metabolic pathways are located either periportally or pericentrally, leading to the concept of metabolic zonation (Jungermann, 1988). The heterogeneity of enzymes has been recently confirmed using large-scale gene arrays (Braeuning et al. 2006).
However, little is known about the zone-specific heterogeneity of signalling pathways and their receptors. The epidermal growth factor (EGF) receptor, for example, is predominantly expressed in periportal hepatocytes (Marti & Gebhardt 1991). As a consequence, periportal hepatocytes show a higher proliferation rate after induction with EGF compared to pericentral cells (Gebhardt & Marti 1992). Other components of signalling cascades, such as the arginine vasopressin receptor A1 (Tordjmann et al. 1998), the G protein-coupled receptor 49 and the cAMP-specific phosphodiesterase 4B have a strong pericentral expression (Braeuning et al. 2006), indicating that periportal and pericentral hepatocytes differ in their response to external signals. Benhamouche et al. (2006) showed that the Wnt/β-catenin pathway is involved in the metabolic heterogeneity of nitrogen metabolism and Werth et al. (2006) showed that not only the Wnt/β-catenin pathway but also the Jak/Stat cascade influences the expression of glutamine synthetase, one of the key enzymes of the nitrogen metabolism. Thus, one can conclude that the metabolic zonation is a result of the heterogeneous expression of signalling cascades within the liver acinus.
Cytokines and hormones play an important role in the differentiation and regeneration of liver tissue. One of the intensively studied hormones is growth hormone (GH), the main regulator of longitudinal growth. It is important in the regulation of lipid, nitrogen, carbohydrate and mineral metabolism, and stimulates growth and differentiation of different cells in different tissues. GH signal transduction is initiated after binding of GH to the growth hormone receptor (GHR), which results in phosphorylation of Stat5b by the Janus kinase 2 (JAK2). Stat5b translocates into the nucleus and regulates the expression of Stat5b-sensitive genes (Vidal et al. 2007). One of the main mediators of GH stimulation is insulin-like growth factor (IGF)-1, a secreted protein whose transcription is induced by GH (Woelfle et al. 2003).
The protein family of suppressors of cytokine signalling (SOCS) has been identified as classical feedback inhibitors for the signalling of many different cytokines, growth factors and hormones (Krebs & Hilton 2000). So far, eight members of the SOCS family are known: SOCS-1 to SOCS-7 and CIS (cytokine-inducible SH2-containing protein). SOCS-2 seems to be the most important regulator of GH action (Davey et al. 1999; Flores-Morales et al. 2006; Rico-Bautista et al. 2006). SOCS-2-deficient mice show changes similar to an over-expression of GH (Rico-Bautista et al. 2005). Besides the regulation of GH, SOCS-2 has further functions, as it interacts with other SOCS members: it can stimulate cytokine action, depending on the presence and concentrations of other members of the SOCS family (Favre et al. 1999; Piessevaux et al. 2006).
In this report we show that SOCS-2 is differentially expressed in murine liver parenchyma showing a preferential higher expression in pericentral hepatocytes. Our results are based on (i) Affymetrix gene arrays, (ii) confirmation by quantitative RT-PCR using preparations of nine pericentral and seven periportal subpopulations of murine hepatocytes, and (iii) confirmation at the protein level using immunohistochemistry. This study extends our knowledge of heterogeneously expressed signalling components in the murine liver acinus, showing for the first time that SOCS-2 is expressed more highly in pericentral hepatocytes. Finally, we investigated the effect of GH stimulation on SOCS-2 and IGF-1 expression in pericentral and periportal hepatocytes to elucidate possible signalling consequences of the heterogeneous expression of SOCS-2.
Materials and methods
Liver tissue and cell isolation and cultivation
Sixteen male C57BL/6N mice (8–12 weeks old) were obtained from the Medizinisch-Experimentelles Zentrum of the Medical Faculty of the University of Leipzig and were allowed free access to food and water. All experiments were approved by the Ethics Committee of the Medical Faculty of the University Leipzig. Mice were killed and livers for immunohistochemistry were either embedded in paraffin or mounted on filter paper and frozen in liquid nitrogen. Cryosections (6 µm thick) and paraffin sections were prepared using cryomicrotomes (Microm GmbH, Walldorf, Germany).
Periportal and pericentral hepatocyte subpopulations were isolated using the digitonin/collagenase perfusion technique (Quistorff et al. 1985) as modified by Gebhardt (1998). Immediately after isolation the cells were suspended in RA1 solution (Machery & Nagel, Düren, Germany) and stored at –80 °C for further analysis. Isolated hepatocytes were cultivated for 2 h in Williams E (Lonza Verviers, S.p.r.l., Verviers, Belgium) supplemented with 10−7 M dexamethasone (Sigma, Taufkirchen, Germany), 2 mM glutamine (Carl Roth, Karlsruhe, Germany), penicillin/streptomycin (Sigma) and 10% fetal calf serum, and then in medium without calf serum as recently summarized by Klingmüller et al. (2006). GH was a product of Calbiochem and obtained from VWR International GmbH (Darmstadt, Germany).
RNA isolation, cDNA synthesis, and Light Cycler PCR
Total RNA was isolated from nine pericentral and seven periportal freshly isolated hepatocyte preparations as well as from cultured cells using the Nucleo Spin RNA II Kit (Macherey & Nagel, Düren, Germany) according to the manufacturer's instructions, which included DNase I digestion. Isolated RNA was stored at –80 °C. Total RNA 3 µg was reverse transcribed using oligo(dT) primer and Superscript II Reverse Transcriptase (Invitrogen GmbH, Karlsruhe, Germany) in a 30-µL reaction. The cDNA was diluted 1 : 10 and 3 µL was used for amplification of SOCS-2, GS, GHR, IGF-1 and β-actin (internal control) using the Light Cycler FastStart DNA MasterPLUS SYBR Green I Kit (Roche Diagnostics GmbH, Mannheim, Germany). The optimal annealing temperature for each primer pair was determined experimentally using temperature gradient PCR (Eppendorf Mastercycler ep, Hamburg, Germany) and a subsequent agarose gelelectrophoresis. For quantitative real time PCR the annealing temperature specific for only one specific PCR product was applied. The PCR reactions were performed in duplicate in a 20-µL volume containing 3–5 µL cDNA, 0.5 µM of each primer (Invitrogen GmbH) and 4 µL five-fold SYBR-Green Master Mix (Roche Diagnostics GmbH, Mannheim, Germany) using a Light Cycler 2.0 (Roche Diagnostics GmbH). The fold induction was calculated from the ratio of the mean expression level of the target gene in pericentral hepatocyte subpopulations vs. periportal subpopulations using the relative quantification method of the LightCycler 4.05 software (Roche Diagnostics GmbH). Briefly, ΔCp values were calculated from the crossing points of the target and the corresponding reference gene (β-actin), the relative expression (r. E.) was calculated according to r.E. = 2ΔCp(control–target) and the fold increase after stimulation with GH was calculated using the 2−ΔΔCp method (Pfaffl, 2001). To confirm the specificity of PCR products, a melting curve analysis was carried out after each run. Only amplifications with a single peak were included in the analysis. Primer sequences and cycling conditions are given in Table 1.
Table 1.
Primer orientation is given in 5′ to 3′ direction. The annealing temperature (Ta) and the extension time (text) are specific for each primer pair. All other cycle parameters were kept constant: 3 s denaturation at 94 °C, 5 s annealing time and 72 °C extension temperature. As an internal reference mouse β-actin primer pairs (Tagawa et al. 2004) were used
| gene | sequence | Ta[°C] | text[s] | size [bp] | locus |
|---|---|---|---|---|---|
| IGF-1 | fw: ctg agc tgg tgg atg ctc tt | 60 | 6 | 112 | NM_010512 |
| rev: cac tca tcc aca atg cct gt | |||||
| SOCS-2 | fw: gtt gcc gga gga aca gtc cc | 60 | 12 | 206 | NM_007706 |
| rev: tcg gtc cag ctg acg tct taa c | |||||
| GS | fw: cac tac cgg gcc tgc ttg tat | 61 | 12 | 250 | NM_008131 |
| rev: gca tgg cct tgg tgc taa agt tg | |||||
| GHR | fw: gtg aga tcc aga caa cgg agc | 60 | 22 | 502 | NM_010284 |
| rev: tgt cag ggt cgt aac agc tgg | |||||
| β-ACTIN | fw: tgc gtg aca tca aag aga ag | 60–61 | 6–22 | 190 | NM_007393 |
| rev: gat gcc aca gga ttc cat a |
Microarray analysis
Briefly, before microarray analysis, RNA integrity and concentration was examined on an Agilent 2100 Bioanalyzer (Agilent Technologies, Palo Alto, CA) using the RNA 6.000 LabChip Kit (Agilent Technologies) according to the manufacturer's instructions. Then, microarray analysis was conducted at the microarray core facility of the Interdisziplinäres Zentrum für klinische Forschung (IZKF) Leipzig (Faculty of Medicine, University of Leipzig). Total RNA 5 µg was used to prepare double-stranded cDNA (Superscript II, Life Technologies, Gaithersburg, MD) primed with oligo-dT containing a T7 RNA polymerase promoter site (Genset SA, Paris, France). cDNA was purified by phenol-chloroform extraction before in vitro transcription using the IVT labelling kit (Affymetrix, Santa Clara, CA) to synthesize cRNA. After the in vitro transcription, unincorporated nucleotides were removed using the RNeasy kit (QIAGEN, Hilden, Germany). The cRNA was fragmented and hybridized to GeneChip® Mouse Genome 430 2.0 Array (Affymetrix). The washing and staining of the probe array was performed according to the manufacturer's instructions. The array was scanned with a third generation Affymetrix GeneChipScanner 3000 with the 7G upgrade.
The gene expression data were pre-processed using affyPLM packages (Bolstad, 2004) of the bioconductor Software (Gentleman et al. 2004). After normalization using Probe-level Linear Models the log-ratios of expression values were calculated from periportal hepatocyte subpopulations vs. pericentral subpopulations. Probesets representing differentially expressed genes were selected by a fold change above 2.0.
Immunohistochemistry
Frozen (–80 °C) liver sections of five different mice were air-dried for 30 min and each slice was circled by a DakoCytomation pen (Glostrup, Denmark). Subsequently, fixation was performed using 100 µL cold paraformaldehyde (3.5%) for 15 min at room temperature. After washing 2 × 5 min in 0.1 M TRIS/HCl buffered saline (TBS; pH 7.4) the cells were permeabilized by washing two times in TBST (TBS with 0.2% Tween 20) for 5 min. Slices were blocked by incubation with 15% goat serum (Sigma) in TBST for 30 min at room temperature in a humid chamber.
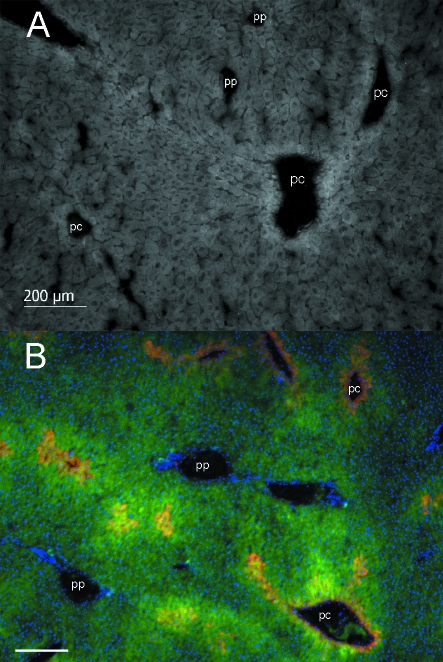
For the glutamine synthetase (GS) and the SOCS-2 staining the procedure was optimized for each antibody separately (e.g. refer to Fig. 3A) and the specimens then incubated with 150 µL of a mixture of the two following antibodies in a humid chamber at 4 °C overnight: (i) polyclonal rabbit anti-SOCS-2 antibody (Invitrogen GmbH; Cat.-No: 34-6900), diluted 1 : 50 and monoclonal mouse anti-glutamine synthetase (BD Transduction Laboratories, Heidelberg, Germany; Cat.-No: 610517), diluted 1 : 1000 in TBST, containing 10% goat serum. A slight improvement in the SOCS-2 staining was obtained after longer incubations, indicating that the antibody has a low affinity for the epitope. The control sections on the same slide were incubated with TBST with 10% goat serum. The next day the slides were washed 3 × 5 min in TBST and incubated for 1 h with a mixture of the following two antibodies: goat anti-rabbit-IgG-Cy5 (GE Healthcare Bio-Sciences AB, Uppsala, Sweden; Cat.-No. 25600308), diluted 1 : 400 and goat anti-mouse-IgG-Cy3 (Dianova, Hamburg, Germany; Cat.-No: 115-166-003), diluted 1 : 1000. Specimens were washed 2 × 5 min in TBS and incubated for 5 min in DAPI (1 µg mL−1). After a final washing step in TBS the slides were embedded using a buffer composed of 0.2 M TRIS/HCl (pH 8.5), 25% glycerol (Carl Roth), 0.1 g mL−1 Mowiol® 40–88 and 0.1% 1,4-diazabicyclo[2.2.2]octane (both obtained from Sigma).
Fig. 3.
(A) Representative immunohistochemical staining of SOCS-2 in a cryosection of C57BL/6N mice liver. Pericentral (pc) and periportal (pp) vessels are labeled. (B) Representative immunohistochemical staining of SOCS-2 (green) and glutamine synthetase (red) in liver of C57BL/6N mice. Glutamine synthetase shows the well-known strict pericentral localization and SOCS-2 co-localizes with glutamine synthetase positive areas, resulting in yellow overlay colour. Pericentral (pc) and periportal (pp) vessels are labeled for better orientation. Nuclei, stained by DAPI are shown in blue. Bar represents 200 µm.
Paraffin-embedded slices were used for staining the GHR. After rehydration in ethyl alcohol the endogenous peroxidase activity was destroyed by incubation with 0.3% H2O2 in TBS for 30 min. The specimens were then boiled for 15 min in 0.1 M citrate buffer (pH 6) and slowly cooled down for 24 h. Unspecific binding was blocked using 0.5% avidin in TBS, 0.01% biotin in TBST and 10% fetal calf serum in TBST (all obtained from Sigma) for 30 min. Subsequently, slices were incubated in 150 µL of 10 µg mL−1 biotinylated monoclonal anti-GHR antibody (R&D Systems GmbH, Wiesbaden-Nordenstadt, Germany; Cat-No: BAF1360) overnight. The control sections were treated as described above. After washing, the POD-extravidin complex (Sigma) was added for 2 h. Staining was performed in 0.1 M TRIS/HCl buffer (pH 7.6), composed of 0.05% diaminobenzidine, 2% aminotriazole and 0.033% H2O2. Counterstaining of nuclei was performed with hematoxylin for 5 min, followed by differentiation for 10 min using tap water. Finally, the slices were dehydrated in ethyl alcohol and embedded using Roti-Histokit (Carl Roth).
Images were taken with a Leica DM5000B equipped with a DFC 350FX fluorescence and a DCF 320 colour camera using a Leica HC PL Fluorotar 10×/0.3 phase contrast objective.
Enzymatic determination
Determination of glutamine synthetase activity was performed according to the method of Levintow (1954) with the modifications described by Gebhardt & Williams (1986). Briefly, cells were homogenized by sonication (Sonopuls, Bandelin, Berlin, Germany). Then, 100 µL of the homogenate was used for the GS activity assay and the absorbance was determined at 540 nm. Protein concentration was determined using the Bradford assay (Bradford, 1976) and the specific GS activity of each sample was expressed in mU mg−1.
Statistical analysis
The Mann–Whitney U-test and correlation analysis were performed using GraphPadInStat version 3.06 for Windows (GraphPad Software, San Diego, CA) with a significance level of P < 0.05.
Results
Gene array analysis
Affymetrix gene arrays were used to study heterogeneously expressed genes related to signalling cascades in the mouse liver parenchyma. A total of 275 probesets were found to be differentially expressed by a fold above 2, consisting of genes related to metabolism, extracellular matrix proteins and signalling cascades (data not shown).
The quality of the periportal and pericentral hepatocyte isolation was determined using two marker genes. The expression of glutamine synthetase was 4.86-fold (± 0.74) higher in the pericentral hepatocyte preparation and the expression of glutaminase (GLS2) was two-fold higher in the periportal hepatocytes. In addition, specific glutamine synthetase activity was 144.7 mU mg−1 and 57.3 mU mg−1 in these pericentral and periportal hepatocyte subpopulations, respectively. This proved that the hepatocytes studied by the gene array analysis were from the periportal or pericentral site of the acinus.
Interestingly, SOCS-2 was 13.8-fold more highly expressed in pericentral mouse hepatocytes compared to periportal hepatocytes. SOCS-2 is the main negative feed-back inhibitor of GH signalling and therefore we were interested in whether the heterogeneous expression of SOCS-2 is a general phenomenon within the liver acinus.
Analysis of SOCS-2 and GS mRNA expression in periportal and pericentral hepatocyte subpopulations
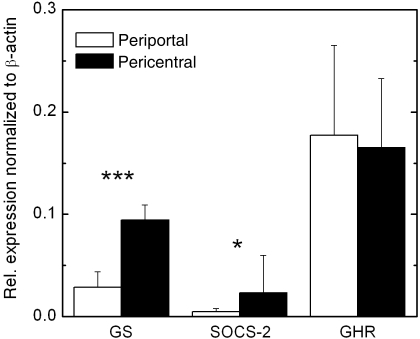
As microarray experiments indicated a higher expression of SOCS-2 in the pericentral compartment, the expression of SOCS-2 was quantified in nine pericentral and seven periportal hepatocyte preparations using quantitative real-time PCR (see Table 1 for details). Figure 1 shows that the SOCS-2 expression is significantly 4.76-fold higher (P = 0.031) in pericentral hepatocytes compared to periportal hepatocytes.
Fig. 1.
Relative mRNA expression of glutamine synthetase (GS), SOCS-2 and growth hormone receptor (GHR) in 9 pericentral and 7 periportal mouse hepatocyte preparations. Values are normalized to β-actin. Significances were tested using the Mann-Whitney U-test (*P < 0.05; ***P < 0.001).
In all preparations the expression of the marker gene GS and the specific activity of GS were determined to characterize the preparation. Figure 1 shows that the relative expression of GS was significantly 3.3-fold higher (P = 0.0002) in pericentral hepatocyte subpopulations. This correlates with a higher specific enzyme activity, being 360.1 ± 118 mU mg−1 (n = 9) and 61.3 ± 14.7 mU mg−1 (n = 7) in the pericentral and periportal compartment, respectively. The coefficient of correlation between the relative GS expression and the specific enzyme activity was r = 0.81 (data not shown), confirming earlier data of Gebhardt et al. (1988).
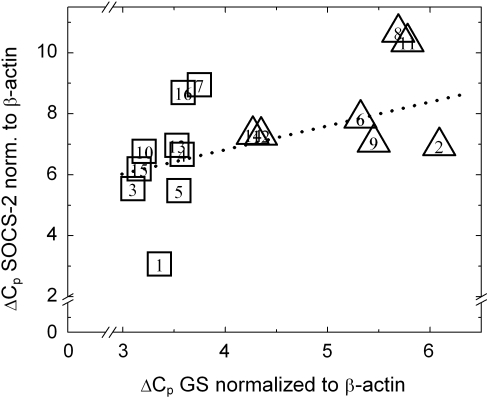
Figure 2 shows the ΔCp values (crossing point, corrected for β-actin expression) of SOCS-2 and GS mRNA for all preparations. A low ΔCp value represents a high target gene concentration. There is a correlation (r = 0.694; P < 0.003) between the relative mRNA concentration of SOCS-2 and GS in all samples, underlining that both are co-expressed. In summary, quantitative PCR measurements confirmed the over-expression of SOCS-2 mRNAs in pericentral hepatocytes.
Fig. 2.
Correlation of crossing points (ΔCp) of SOCS-2 and ΔCp GS mRNA in 9 pericentral ( ) and 7 periportal (
 ) hepatocyte preparations, determined by rt-PCR. Numbers in the squares represent the individual preparations. Each square represents the ΔCp values of a single hepatocyte preparation in which the SOCS-2 and GS crossing points were determined in duplicates. Data were normalized to β-actin. The Spearman correlation coefficient is r= 0.694 (P < 0.003).
Identification of SOCS-2 protein expression by immunohistochemistry
Next we studied whether the predominant pericentral expression of SOCS-2 is also reflected at the protein level. Figure 3A shows a representative image (of five animals) of the heterogeneous expression of SOCS-2 within the liver acinus. It co-localizes with GS expression (Fig. 3B), supporting the data of the quantitative real-time PCR (Fig. 1). However, in contrast to the sharp expression of GS, closely confined to one to three cell layers around the pericentral vessels, SOCS-2 showed a broader range of expression. In summary these data show that both SOCS-2 mRNA and protein are heterogeneously expressed within the murine acinus.
Distribution of GH receptor in isolated hepatocyte subpopulations and the liver acinus
GH induces the expression of SOCS-2, which is a negative feedback inhibitor of the GH signalling cascade (Greenhalgh et al. 2005). Therefore we investigated whether the higher expression of SOCS-2 in the pericentral compartment correlates with a higher expression of the GHR. It has been reported before that the EGF receptor, for example, shows a predominantly periportal expression (Marti & Gebhardt, 1991). Figure 1 shows that the GHR mRNA is strongly expressed in periportal and pericentral hepatocytes and that the level of expression is equal in both subpopulations.
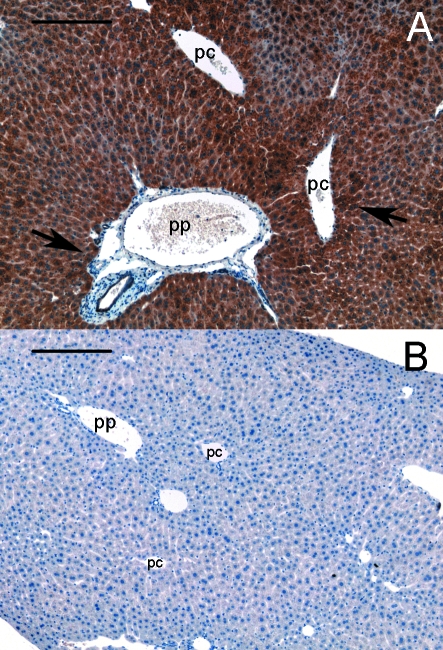
Immunohistochemical staining of GHR in liver slices proved that the GHR is strongly expressed in all hepatocytes. In addition, a slight increase in the protein concentration was detected in hepatocytes surrounding periportal as well as pericentral vessels (Fig. 4). This increase varied in the number of hepatocytes involved and on some occasions only one row of hepatocytes showed this increase.
Fig. 4.
Distribution of GHR in the liver parenchyma. (A) A strong expression is shown throughout liver parenchyma with an increase in the vicinity of periportal (pp) and pericentral (pc) vessels (arrows). Midzonal regions seemed to have a slightly reduced concentration. (B) No staining is detected in the corresponding negative control section. Nuclei, stained with hematoxylin are shown in blue. Bar represents 200 µm.
In summary the data show that the growth hormone receptor is strongly expressed in all hepatocytes with a slightly higher concentration in the vicinity of vessels. In contrast, SOCS-2, one of the targets of GH action, is heterogeneously expressed and consequently there is no direct relationship between GHR and SOCS-2 expression.
Induction of SOCS-2 and IGF-1 in hepatocyte subpopulations by growth hormone stimulation
Next we were interested in the extent to which GH stimulation affects the expression of SOCS-2 and IGF-1 in cultured periportal and pericentral hepatocyte subpopulations. Hepatocytes were isolated from four different mice (two periportal and two pericentral preparations) and cultivated for 18 h as previously described (Klingmüller et al. 2006). Different concentrations of GH were then added for 1 h and the expression of SOCS-2 and IGF-1 determined.
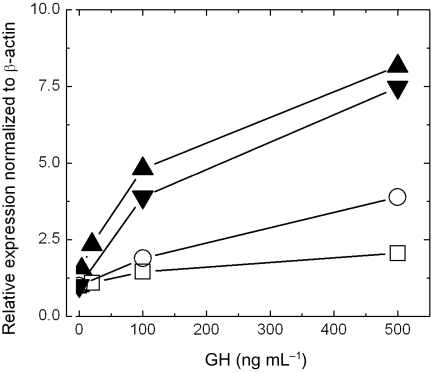
In all preparations, GH induced expression of SOCS-2 in a concentration-dependent manner (Fig. 5). However, the induction of SOCS-2 was higher in pericentral hepatocytes. At 100 ng mL−1 the induction was on average 1.6- and 4.3-fold greater in periportal and pericentral hepatocytes, respectively. At 500 ng mL−1 the SOCS-2 expression increased further, being on average 3-fold and 7.8-fold greater in periportal and pericentral hepatocytes, respectively.
Fig. 5.
GH dependent induction of SOCS-2 mRNA in pericentral ( ,
,  ) and periportal (
 ,
,  ) mouse hepatocytes cultures. The hepatocytes subpopulations were prepared from 4 different mice (2 × pp and 2 × pc). GH stimulation was performed one day after isolation for 1 h with the indicated concentrations of GH. Each point represents a duplicate determination and the relative expression was calculated using the 2−ΔΔCp method. All data were normalized to β-actin.
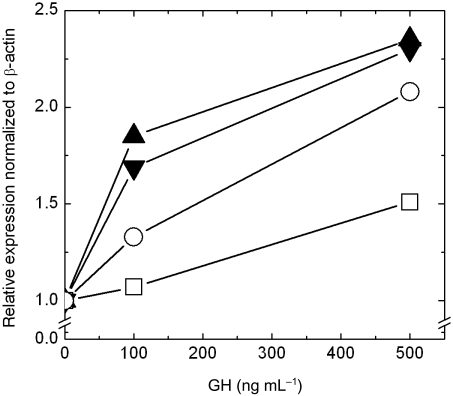
IGF-1 is a direct and physiological important target of GH stimulation. Therefore we asked whether GH stimulation affects IGF-1 expression in periportal and pericentral hepatocytes to a different extent. Figure 6 shows that 100 ng mL−1 GH resulted on average in a 1.2-fold and 1.8-fold induction of IGF-1 in periportal and pericentral hepatocytes, respectively. This induction increased at 500 ng mL−1 GH to a 1.8- and 2.3-fold higher expression, respectively.
Fig. 6.
GH dependent induction of IGF-1 in 2 separate pericentral ( ,
,  ) and 2 separate periportal (
 ,
,  ) mouse hepatocytes cultures. Data show, that pericentral hepatocytes respond with a higher IGF-1 expression after GH stimulation. Experimental conditions are the same as in Figure 5.
From these data we conclude that GH stimulation induces IGF-1 and SOCS-2 expression mainly in pericentral hepatocytes and, to a lesser extent, in periportal hepatocytes.
Discussion
Hepatocytes along the liver acinus differ in the metabolism of lipids, amino acids, carbohydrates and the synthesis of bile acids. This concept of metabolic zonation seems to be related to the heterogeneous expression of signalling cascades within the liver acinus. In male C3H/He mice, 198 genes and sequences are differentially expressed (Braeuning et al. 2006), including metabolic, regulatory and structural proteins. Similarly, in male C57BL/6N mice, 274 genes are heterogeneously expressed. Here we show for the first time that the suppressor of cytokine signaling-2 (SOCS-2), one of the main regulators of GH action, is expressed predominantly in pericentral hepatocytes (Figs 1 & 3).
SOCS-2 is one of the target genes of the GH-JAK2-Stat5b axis. Therefore we investigated whether the heterogeneous SOCS-2 expression is related to the expression of GHR within the liver acinus. Figure 1 shows that the GHR mRNA is strongly expressed in all hepatocytes, as has been reported before (Zimmermann et al. 2000). The level of expression is equal in periportal and pericentral hepatocyte subpopulations. Immunohistochemical investigations on liver tissue showed, however, that an increase in staining intensity occurs in the vicinity of periportal and pericentral vessels, which has also been reported for human tissue by Simard et al. (1996). As the GHR distribution is similar in periportal and pericentral hepatocytes – the increase close to the vessel occurred in both the periportal and pericentral compartments – it can be concluded that the GHR distribution does not directly affect the level of SOCS-2 expression.
Stimulation of periportal and pericentral hepatocyte subpopulations with GH for 1 h resulted in a markedly different response of SOCS-2 and IGF-1 (Figs 5 & 6). The up-regulation of IGF-1 and SOCS-2 was less prominent in periportal mouse hepatocytes compared to pericentral hepatocytes. Therefore, we conclude that pericentral hepatocytes respond more effectively to GH stimulation.
It has been shown in cell culture experiments (Favre et al. 1999) as well as in a transgenic mouse model (Greenhalgh et al. 2002) that SOCS-2 can have two opposite effects. At low SOCS-2 concentrations GH signalling is inhibited, whereas at high concentrations it is enhanced (Greenhalgh & Alexander 2004). Therefore, one may speculate whether low concentrations of SOCS-2 in periportal hepatocytes inhibit GH-dependent gene expression, whereas higher concentrations of SOCS-2 enhance the expression of GH-responsive genes in the pericentral compartment. This idea is further supported by the following results: (i) Waxman et al. (1995) showed that the pericentral expression of Cytochrome P450 enzymes can be stimulated by GH or GH pulses, and SOCS-2−/– knock-out mice (Greenhalgh et al. 2005) showed a down-regulation of Cytochrome P450 enzymes. This suggests that the higher expression and induction of SOCS-2 in pericentral hepatocytes may play an important role in GH-dependent gene expression. (ii) It has been shown that GH affects the expression of glutamine synthetase (Gebhardt & Mecke 1979). Werth et al. (2006) demonstrated that a Stat5 and a LEF/TCF binding site are important for the induction of GS. Deletion of the Stat5 binding site resulted in decreased expression of the GS gene. One may assume that the heterogeneous expression of glutamine synthetase might be influenced by the different responsiveness of periportal and pericentral hepatocytes after GH stimulation.
Although there is no experimental evidence to date that SOCS-2 is a target for regulation by β-catenin, it is tempting to speculate that GS and SOCS-2 are subject to a common regulatory mechanism. This hypothesis is strikingly supported by the identification, using a computer search, of three putative TCF/LEF binding sites (Vandewetering et al. 1991) and four putative Stat5b binding sites (LeBaron et al. 2005) in the 5′-flanking region of the SOCS-2 gene (data not shown). Furthermore, to our surprise one of the LEF/TCF sites overlaps with a Stat5b binding site, and another Stat5b binding site is in close proximity to a TCF/LEF site, similar to the far-upstream enhancer region of the GS gene (Werth et al. 2006). Whether this indicates a common regulatory mechanism for SOCS-2 and GS gene in the pericentral compartment remains to be determined in further experiments.
The present data show that SOCS-2 is significantly higher expressed in pericentral murine hepatocytes after stimulation with GH. The stimulation with GH also results in a heterogeneous IGF-1 expression, being higher in pericentral murine hepatocytes. Therefore, it can be concluded that the pericentral compartment of the murine liver acinus responds more effectively to GH stimulation, despite an equally expressed growth hormone receptor. In addition, this study shows that receptor distribution does not always correlate to differences in signalling cascades and that unknown factors of the GH/Jak/Stat pathway may affect the heterogeneous gene expression within the liver acinus.
Acknowledgments
We would like thank K. Heise, D. Mahn, C. Schulze and F. Struck for excellent technical assistance as well as K. Krohn and P. Süptitz for microarray analysis, conducted at the IZKF Leipzig, Faculty of Medicine of the University Leipzig (Projekt Z03). We would like to acknowledge the German Federal Ministry for Education and Research BMBF within the program ‘Systems of Life – Systems Biology’ (FKZ 0313081F and FZK 0313078D) as well as the European Project ‘Nature-inspired Smart Information Systems’ (NISIS) within the Task Force ‘Multitasking of Liver Tissue’ for financial support.
References
- Benhamouche S, Decaens T, Godard C, et al. Apc tumor suppressor gene is the ‘zonation-keeper’ of mouse liver. Dev Cell. 2006;10:759–770. doi: 10.1016/j.devcel.2006.03.015. [DOI] [PubMed] [Google Scholar]
- Bolstad B. Low Level Analysis of High-Density Oligonucleotide Data: Background, Normalization and Summarization. Berkeley: University of California; 2004. [Google Scholar]
- Bradford MM. A rapid and sensitive method for the quantitation of microgram quantities of protein utilizing the principle of protein-dye binding. Anal Biochem. 1976;72:248–254. doi: 10.1016/0003-2697(76)90527-3. [DOI] [PubMed] [Google Scholar]
- Braeuning A, Ittrich C, Kohle C, et al. Differential gene expression in periportal and perivenous mouse hepatocytes. FEBS J. 2006;273:5051–5061. doi: 10.1111/j.1742-4658.2006.05503.x. [DOI] [PubMed] [Google Scholar]
- Davey HW, McLachlan MJ, Wilkins RJ, Hilton DJ, Adams TE. STAT5b mediates the GH-induced expression of SOCS-2 and SOCS-3 mRNA in the liver. Mol Cell Endocrinol. 1999;158:111–116. doi: 10.1016/s0303-7207(99)00175-6. [DOI] [PubMed] [Google Scholar]
- Favre H, Benhamou A, Finidori J, Kelly PA, Edery M. Dual effects of suppressor of cytokine signaling (SOCS-2) on growth hormone signal transduction. FEBS Lett. 1999;453:63–66. doi: 10.1016/s0014-5793(99)00681-x. [DOI] [PubMed] [Google Scholar]
- Flores-Morales A, Greenhalgh CJ, Norstedt G, Rico-Bautista E. Negative regulation of growth hormone receptor signaling. Mol Endocrinol. 2006;20:241–253. doi: 10.1210/me.2005-0170. [DOI] [PubMed] [Google Scholar]
- Gebhardt R. Metabolic zonation of the liver – regulation and implications for liver-function. Pharmacol Ther. 1992;53:275–354. doi: 10.1016/0163-7258(92)90055-5. [DOI] [PubMed] [Google Scholar]
- Gebhardt R. Isolation of periportal and pericentral hepatocytes. In: Phillips IR, Shephard EA, editors. Methods in Molecular Biology, Cytochrome P450 Protocols. Totowa, NJ: Humana Press Inc; 1998. pp. 319–328. [DOI] [PubMed] [Google Scholar]
- Gebhardt R, Marti U. Heterogeneous distribution of the epidermal growth-factor receptor in rat-liver parenchyma. Prog Histochem Cytochem. 1992;26:164–168. doi: 10.1016/s0079-6336(11)80092-6. [DOI] [PubMed] [Google Scholar]
- Gebhardt R, Mecke D. Role of growth-hormone, dexamethasone and triiodothyronine in the regulation of glutamine-synthetase in primary cultures of rat hepatocytes. Eur J Biochem. 1979;100:519–525. doi: 10.1111/j.1432-1033.1979.tb04197.x. [DOI] [PubMed] [Google Scholar]
- Gebhardt R, Williams GM. Amino-Acid-Transport in established adult-rat liver epithelial-cell lines. Cell Biol Toxicol. 1986;2:9–20. doi: 10.1007/BF00117703. [DOI] [PubMed] [Google Scholar]
- Gebhardt R, Ebert A, Bauer G. Heterogeneous expression of glutamine-synthetase messenger-RNA in rat-liver parenchyma revealed by in situ hybridization and northern blot analysis of RNA from periportal and perivenous hepatocytes. FEBS Lett. 1988;241:89–93. doi: 10.1016/0014-5793(88)81037-8. [DOI] [PubMed] [Google Scholar]
- Gentleman RC, Carey VJ, Bates DM, et al. Bioconductor: open software development for computational biology and bioinformatics. Gen Biol. 2004;5:R80. doi: 10.1186/gb-2004-5-10-r80. [DOI] [PMC free article] [PubMed] [Google Scholar]
- Greenhalgh CJ, Alexander WS. Suppressors of cytokine signalling and regulation of growth hormone action. Growth Horm IGF Res. 2004;14:200–206. doi: 10.1016/j.ghir.2003.12.011. [DOI] [PubMed] [Google Scholar]
- Greenhalgh CJ, Metcalf D, Thaus AL, et al. Biological evidence that SOCS-2 can act either as an enhancer or suppressor of growth hormone signaling. J Biol Chem. 2002;277:40181–40184. doi: 10.1074/jbc.C200450200. [DOI] [PubMed] [Google Scholar]
- Greenhalgh CJ, Rico-Bautista E, Lorentzon M, et al. SOCS2 negatively regulates growth hormone action in vitro and in vivo. J Clin Invest. 2005;115:397–406. doi: 10.1172/JCI22710. [DOI] [PMC free article] [PubMed] [Google Scholar]
- Jungermann K. Metabolic zonation of liver parenchyma. Semin Liver Dis. 1988;8:329–341. doi: 10.1055/s-2008-1040554. [DOI] [PubMed] [Google Scholar]
- Klingmüller U, Bauer A, Bohl S, et al. Primary mouse hepatocytes for systems biology approaches: a standardized in vitro system for modelling of signal transduction pathways. IEE Proc Sys Biol. 2006;153:433–447. doi: 10.1049/ip-syb:20050067. [DOI] [PubMed] [Google Scholar]
- Krebs DL, Hilton DJ. SOCS: physiological suppressors of cytokine signaling. J Cell Sci. 2000;113:2813–2819. doi: 10.1242/jcs.113.16.2813. [DOI] [PubMed] [Google Scholar]
- LeBaron MJ, Xie JW, Rui H. Evaluation of genome-wide chromatin library of Stat5 binding sites in human breast cancer. Mol Cancer. 2005;4:6. doi: 10.1186/1476-4598-4-6. [DOI] [PMC free article] [PubMed] [Google Scholar]
- Levintow L. The glutamyltransferase activity of normal and neoplastic tissues. J Natl Cancer Inst. 1954;15:347–352. [PubMed] [Google Scholar]
- Marti U, Gebhardt R. Acinar heterogeneity of the epidermal growth-factor receptor in the liver of male-rats. Eur J Cell Biol. 1991;55:158–164. [PubMed] [Google Scholar]
- Pfaffl MW. A new mathematical model for relative quantification in real-time RT-PCR. Nucleic Acids Res. 2001;29:2002–2007. doi: 10.1093/nar/29.9.e45. [DOI] [PMC free article] [PubMed] [Google Scholar]
- Piessevaux J, Lavens D, Montoye T, et al. Functional cross-modulation between SOCS proteins can stimulate cytokine signaling. J Biol Chem. 2006;281:32953–32966. doi: 10.1074/jbc.M600776200. [DOI] [PubMed] [Google Scholar]
- Quistorff B, Grunnet N, Cornell NW. Digitonin perfusion of rat-liver – a new approach in the study of intra-acinar and intracellular compartmentation in the liver. Biochem J. 1985;226:289–297. doi: 10.1042/bj2260289. [DOI] [PMC free article] [PubMed] [Google Scholar]
- Rico-Bautista E, Greenhalgh CJ, Tollet-Egnell P, et al. Suppressor of cytokine signaling-2 deficiency induces molecular and metabolic changes that partially overlap with growth hormone-dependent effects. Molr Endocrinol. 2005;19:781–793. doi: 10.1210/me.2004-0040. [DOI] [PubMed] [Google Scholar]
- Rico-Bautista E, Flores-Morales A, Fernandez-Perez L. Suppressor of cytokine signaling (SOCS) 2, a protein with multiple functions. Cytokine Growth Factor Rev. 2006;17:431–439. doi: 10.1016/j.cytogfr.2006.09.008. [DOI] [PubMed] [Google Scholar]
- Simard M, Manthos H, Giaid A, Lefebvre Y, Goodyer CG. Ontogeny of growth hormone receptors in human tissues: an immunohistochemical study. J Clin Endocrinol Meta. 1996;81:3097–3102. doi: 10.1210/jcem.81.8.8768881. [DOI] [PubMed] [Google Scholar]
- Tagawa N, Muraoka K, Okamoto Y, Nishida M, Katagiri M, Kobayashi Y. 17 Alpha-hydroxylase/C17–20 lyase cytochrome P450 mRNA expressions and enzyme activities during the development of arthritis in collagen-induced arthritis mice. Biol Pharm Bull. 2004;27:1663–1665. doi: 10.1248/bpb.27.1663. [DOI] [PubMed] [Google Scholar]
- Tordjmann T, Berthon B, Jacquemin E, et al. Receptor-oriented intercellular calcium waves evoked by vasopressin in rat hepatocytes. EMBO J. 1998;17:4695–4703. doi: 10.1093/emboj/17.16.4695. [DOI] [PMC free article] [PubMed] [Google Scholar]
- Vandewetering M, Oosterwegel M, Dooijes D, Clevers H. Identification and cloning of tcf-1, a lymphocyte-t-specific transcription factor containing a sequence-specific HMG box. EMBO J. 1991;10:123–132. doi: 10.1002/j.1460-2075.1991.tb07928.x. [DOI] [PMC free article] [PubMed] [Google Scholar]
- Vidal OM, Merino R, Rico-Bautista E, et al. In vivo transcript profiling and phylogenetic analysis identifies suppressor of cytokine signaling 2 as a direct signal transducer and activator of transcription 5b target in liver. Mol Endocrinol. 2007;21:293–311. doi: 10.1210/me.2006-0096. [DOI] [PubMed] [Google Scholar]
- Waxman DJ, Ram PA, Pampori NA, Shapiro BH. Growth-hormone regulation of male-specific rat-liver P450S 2A2 and 3A2 – induction by intermittent growth-hormone pulses in male but not female rats rendered growth-hormone deficient by neonatal monosodium glutamate. Mol Pharmacol. 1995;48:790–797. [PubMed] [Google Scholar]
- Werth M, Gebhardt R, Gaunitz F. Hepatic expression of glutamine synthetase in rats is controlled by STAT5 and TCF transcription factors. Hepatology. 2006;44:967–975. doi: 10.1002/hep.21322. [DOI] [PubMed] [Google Scholar]
- Woelfle J, Billiard J, Rotwein P. Acute control of insulin-like growth factor-I gene transcription by growth hormone through STAT5B. J Biol Chem. 2003;278:22696–22702. doi: 10.1074/jbc.M301362200. [DOI] [PubMed] [Google Scholar]
- Zimmermann EM, Li LN, Hoyt EC, Pucilowska JB, Lichtman S, Lund PK. Cell-specific localization of insulin-like growth factor binding protein mRNAs in rat liver. Am J Physiol-Gastrointest Liver Physiol. 2000;278:G447–G457. doi: 10.1152/ajpgi.2000.278.3.G447. [DOI] [PubMed] [Google Scholar]


