

Abstract
Fluorescence is typically isotropic in space and collected with low efficiency. In this paper we describe surface plasmon-coupled emission (SPCE), which displays unique optical properties and can be collected with an efficiency near 50%. SPCE occurs for fluorophores within about 200 nm of a thin metallic film, in our case a 50-nm-thick silver film on a glass substrate. We show that fluorophore proximity to this film converts the normally isotropic emission into highly directional emission through the glass substrate at a well-defined angle from the normal axis. Depending on the thickness of the polyvinyl alcohol (PVA) film on the silver, the coupling efficiency of sulforhodamine 101 in PVA ranged from 30 to 49%. Directional SPCE was observed whether the fluorophore was excited directly or by the evanescent field due to the surface plasmon resonance. The emission is always polarized perpendicular to the plane of incidence, irrespective of the polarization of the incident light. The lifetimes are not substantially changed, indicating a mechanism somewhat different from that observed previously for the effects of silver particles on fluorophores. Remarkably, the directional emission shows intrinsic spectral resolution because the coupling angles depend on wavelength. The distances over which SPCE occurs, 10 to 200 nm, are useful because a large number of fluorophores can be localized within this volume. The emission of more distant fluorophores does not couple into the glass, allowing background suppression from biological samples. SPCE can be expected to become rapidly useful in a variety of analytical and medical sensing applications.
Fluorescence detection is now a dominant method for high-sensitivity detection in a wide range of biotechnology applications, including gene expression, PCR, medical diagnostics, forensics, and increasingly for biohazard detection. In all these applications there is a need for increased sensitivity to allow detection of a small number of target molecules. The real-world applications of fluorescence would also benefit from suppression of the autofluorescence present in most biological samples. Methods to improve sensitivity include the use of long-lifetime probes with gated detection [1,2], probes with multiple chromophores such as phycobiliproteins [3,4], and amplified methods such as enzyme-linked immunosorbent assay and PCR. In all of these methods we accept the properties of fluorophores in transparent media, free-space conditions, where the emission is isotropic in space. With careful optical design and methods to decrease background emission, single-molecule detection is possible, but remains a challenge. Given the complexity of the optical systems required for single-molecule detection [5], and the high efficiency of modern detectors, further increases in sensitivity will require a fundamental change in fluorescence technology.
In several recent papers [6–10] we described the use of subwavelength-size silver particles to increase the intensities and quantum yields of a variety of fluorophores. In this case the increased intensities were obtained not by increased efficiency of the collection optics or detectors but by modification of the free-space conditions of the fluorophores. Increased rates of radiative decay can result in increased quantum yields and photostability. The presence of a nearby metallic particle changes the intrinsic radiative decay rate of fluorophores [6,11,12].
In the present paper we describe a different but related approach to changing the environment around the fluorophore. This approach depends on the interactions of excited fluorophores with a continuous thin silver film. Gold and silver films are known to display dramatically reduced reflectance at specific angles of incidence on the metal through a glass substrate. This effect is due to excitation of surface plasmon resonances (SPR)1 in the metal film [13,14]. In a recent paper [15] we described that the opposite process can occur: an excited fluorophore near the metal film can excite a surface plasmon [15]. This plasmon then radiates into the glass substrate at the SPR angle for the emission wavelength. We refer to this radiation as surface plasmon-coupled emission (SPCE). The SPCE displays unique properties that can be useful in sensing applications. These properties include strongly directional emission, unique polarization, high-efficiency coupling, and wavelength resolution by selection of the observation angle.
Materials and methods
Sample preparation
Glass microscope slides (plain; Corning) were coated by vapor deposition by EMF Co. (Ithaca, NY). A 50-nm-thick layer of silver was deposited on the glass, followed by a 5-nm-thick layer of SiO2 to serve as a spacer and protect the silver surface. Fluorophores were deposited on the surface by spin coating at 3000 rpm a 0.5 or 1% by weight solution of low-molecular-weight polyvinyl alcohol (PVA) in water. The PVA solution contained sulforhodamine 101 (S101) or rhodamine 123 from Aldrich or Py2 from Exciton. The thicknesses of the PVA films were estimated from the known concentrations of S101 in the solution and the optical density of S101 at 587 nm. The optical densities of S101 in 0.5 and 1.0% PVA spin-coated films were 0.0016 and 0.0033, respectively. Control samples, 15- and 30-μm, films, were prepared by evaporation. For these control samples the S101 concentration was fivefold lower than that used for spin coating. The optical densities were 0.30 and 0.61, respectively. We estimated the thickness of our spin-coated films to be about 15 and 30 nm.
Fluorescence measurements
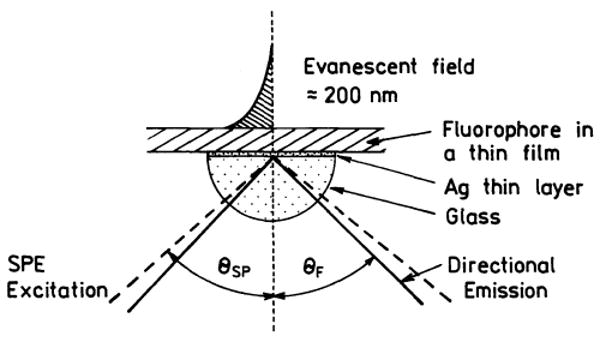
The spin-coated slides were attached to a hemi-cylindrical prism made of BK7 glass (Scheme 1). This combined sample was positioned on a precise rotary stage (Fig. 1) which allows excitation and observation at any desired angle relative to the vertical axis along the cylinder. Two modes of excitation were used (Scheme 2). The sample could be excited through the prism. In this case the incident light was completely reflected at all angles except when the incident angle θI equaled the surface plasmon angle θSP. For incident angles near θSP there exists an evanescent wave in the air sample side, distal from the incident light. This evanescent field extends about 200 nm into the air or sample. This field is enhanced about 20-fold by the resonance interaction [16-19]. This mode of illumination is called the Kretschmann (KR) configuration (Scheme 2). The sample can also be excited from the air or sample side which has a refractive index lower than that of the prism. In this case it is not possible to excite surface plasmons. The angle of incidence does not matter but we used normal incidence. This is called the reverse Kretschmann (RK) configuration. Observation of the emission was performed with a 3-mm-diameter fiber bundle, covered with a 200-μm vertical slit, positioned about 15 cm from the sample. This corresponds to an acceptance angle below 0.1°.
Scheme 1.
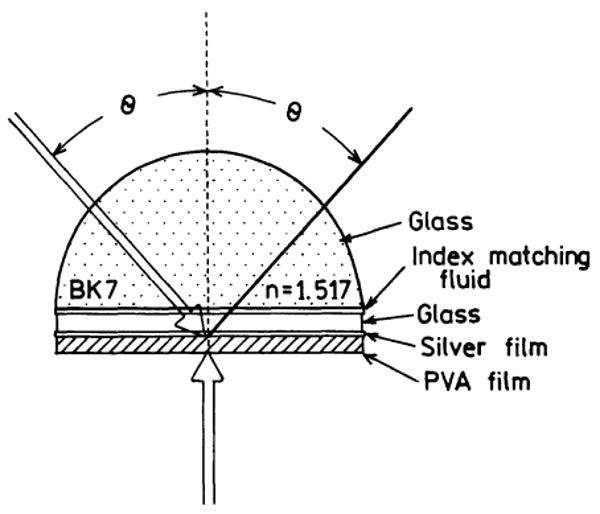
Configuration of the hemi-cylinder and spin-coated slide.
Fig. 1.
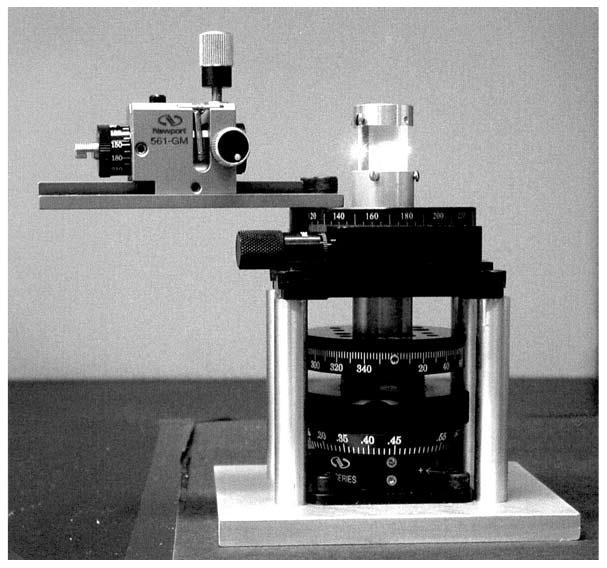
Rotation stage and sample holder for directional excitation and emission measurements.
Scheme 2.
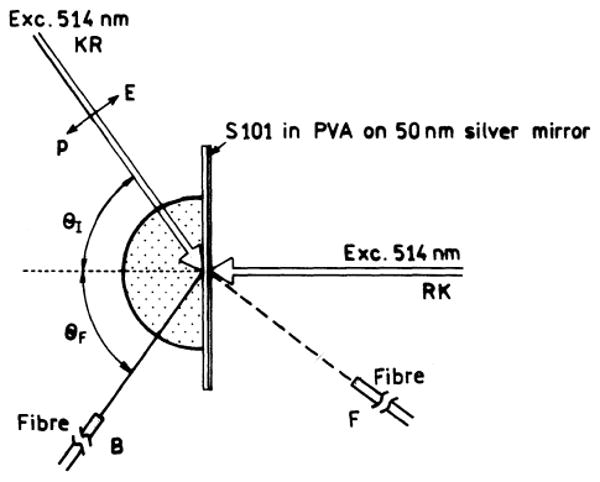
Experimental geometry for measurement of free-space emission (F) and SPCE (B) with the Kretschmann (KR) and reverse Kretschmann (RK) configurations.
For excitation we used the 514-nm output of a mode-locked argon ion laser, 76 MHz repetition rate, 120 ps half-width. Scattered light at 514 nm was suppressed by observation through a holographic supernotch-plus filter (Kaiser Optical System, Inc., Ann Arbor, MI). Emission intensities were observed through a long-wave-pass filter LWP 550 in addition to the notch filter. All emission spectra were recorded through the notch filter. Frequency-domain intensity decays were measured with the 10-GHz instrument described earlier [20]. For the photographs we used 532-nm excitation from solid-state laser (max. output power 30 mW) and the samples were attached to a hemi-spherical prism rather than a hemi-cylinder.
Theory
The theory for SPCE can be understood starting with the theory of surface plasmon resonance. Surface plasmon resonance can be best understood from the optical physics of SPR [13,14] or reviews of the use of SPR to measure macromolecule association reactions [16,17]. The relationship between SPR and SPCE has been described in the companion paper [15]. SPR occurs when light is incident on a thin metal film through a medium of moderate refractive index such as glass (Scheme 1). SPR occurs at a specific angle of incidence (θI) when this angle equals the SPR angle for the incident light (θSP). The reflectivity of the metal film is high except for a small range of angles around θSP.
SPR occurs under specific conditions where the wavevector of the incident light matches the wavevector of the surface plasmon. SPR does not occur if the light is incident on the metal from the side with lower refractive index, typically an aqueous sample or in our case a PVA film. The wavevector of the incident light is given by
| (1) |
where np is the refractive index of the substrate, λ = λ0/np is the wavelength in the prism, λ0 is the wavelength in a vacuum, ω is the frequency in radians/s, and k0 is the wavevector or propagation constant in a vacuum.
Calculation of the wavevector for the surface plasmon is more complex. The refractive index (n) and dielectric constant (ε) of a metal (m) are complex quantities given by
| (2) |
and
| (3) |
where and the subscripts indicate the real (r) and imaginary (im) components. These constants are wavelength (frequency) dependent. To a first approximation the real part of εm is determined by the conductivity of the metal and the imaginary part of εm is due to attenuation (absorption) of the incident light. For a perfect conductor εr = −∞. For a metal the wavevector for the surface plasmon at the metal-sample interface is given by
| (4) |
where εm and εs are the dielectric constants of the metal (m) and sample (s), respectively. εs of the sample is the effective dielectric constant on the PVA side of the silver film. Because the real part of εm is larger than the imaginary part the wavevector can be approximated by
| (5) |
The incident light can interact with the surface plasmon when its x-axis component equals the propagation constant for the surface plasmon. The propagation constant for the incident light in the prism (p) is given by
| (6) |
and the component along the x-axis is given by
| (7) |
where θI is the incidence angle in the prism. The conditions for SPR absorption are satisfied when
| (8) |
Eq. (8) illustrates an important property of surface plasmon resonance. For SPR to occur, the electric vector of the incident light in the metal plane needs to be modified by the angle of incidence. This occurs only if the electric vector is parallel to the plane of incidence (Scheme 2). Such light is said to be p-polarized. Light is s-polarized if the electric vector is perpendicular to the plane of incidence. Under the conditions used in this study s-polarization light does not display SPR. However, this restriction can be changed for certain thicknesses of the sample layer.
In reality SPR occurs not at a single angle but over a relatively narrow range of angles determined by the optical constants and resonance response of the metal. Calculation of the angle-dependent reflectivity curves requires moderately complex equations, which are given in the Appendix along with example reflectivity curves. We have found that the surface plasmon angles for minimum reflectivity correspond to the angles for SPCE, with the appropriate correction for wavelength.
Results
Properties of SPCE with reverse Kretschmann excitation
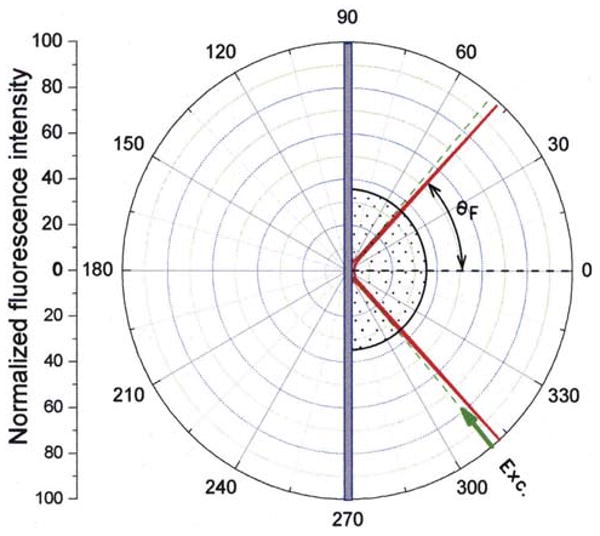
In a recent report [15] we suggested that SPCE should not depend on the mode of excitation. That is, an excited fluorophore should couple with the surface plasmon whether it is excited by the surface plasmon evanescent field (Scheme 2, from the left) or directly using the reverse Kretschmann configuration (Scheme 2, from the right). We felt that the most convincing demonstration of SPCE would be obtained with the RK excitation where the incident light cannot induce surface plasmons. Fig. 2 shows the dependence of the emission intensity on observation angle with RK excitation. On the prism side (back side, B) of the sample the emission is sharply distributed at ±47° or ±50° from the normal for the 15- and 30-nm films, respectively. This small difference in angle is due to the thickness of the PVA film. These angles are roughly equal to the plasmon angle calculated for 600-nm emission with the dielectric constant of silver εm = −17 + 0.6i (Fig. A2 in Appendix). The intensity observed on the front (F) side of the sample was much lower and not sharply distributed at any particular angle. Higher emission intensity on the front side is seen for the thicker sample (Fig. 2B), consistent with lower-efficiency coupling into the surface plasmon for fluorophores more distant from the metal surface. To determine the relative intensities of the coupled and free-space emission, we integrated the intensities observed at all angles on the front side (180° ± 90°) and the back side (0° ± 90°). The total back-to-front intensity ratio (IB/IF) was 0.96 for the 15-nm-thick sample and 0.42 for the 30-nm-thick sample. This suggests that the coupling efficiency for these thicknesses are 49 and 30%, respectively.
Fig. 2.
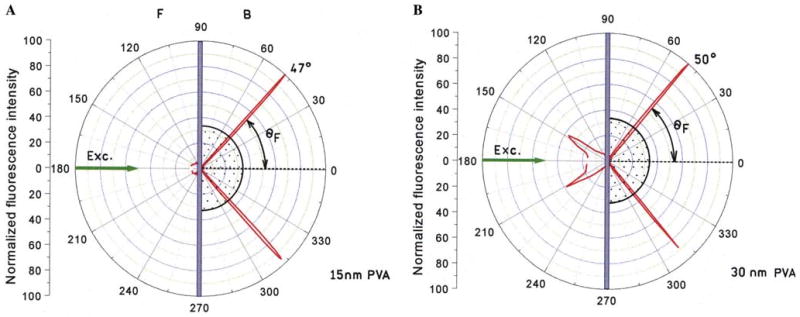
Angular distribution of S101 emission excited using the reverse Kretschmann configuration. The PVA thickness was approximately 15 nm (A) or 30 nm (B). The ratio of the angle-integrated intensities were IB/IF = 0.96 or 0.42, respectively.
Figure A2.
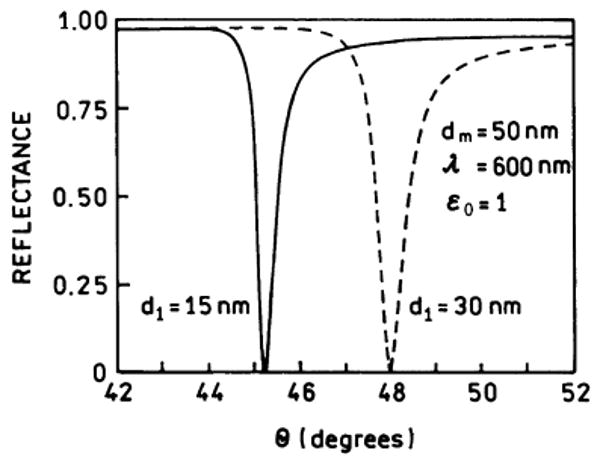
Calculated reflectivity curves for a four-layer system. For this calculation we use , dm = 50 nm, εm = −17 + 0:6i, and . The thickness d1 of the sample (PVA) was assumed to be 15 or 30 nm, with a refractive index .
We considered the possibility that the strong emission near 47° or 50° was due to scattered light or to a reflection. Hence we measured the emission spectra of the directional SPCE (––––) and of the free-space emission (–– –– ––, Fig. 3). We found that the notch filter eliminated the scattered incident light and the emission spectra were consistent with S101. For the 15-nm sample the SPCE, at the maximum angle, is about 10-fold more intense than the free-space emission. For the thicker 30-nm sample the SPCE is about 3-fold more intense, the lower value being due to lower-efficiency coupling with the thicker sample.
Fig. 3.
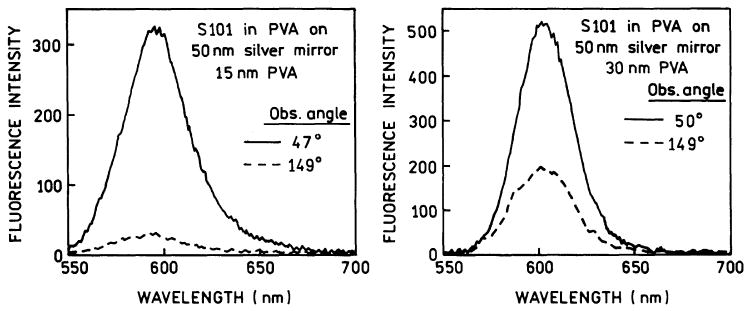
Emission spectra of S101 in PVA. The spectra are for the SPCE (–––––) and the free-space emission (– – –) measured at the indicated angle.
SPR occurs only for p-polarized incident light. Similarly, we expected the SPCE to be p-polarized even with RK excitation. We examined the polarization of the SPCE. When the excitation was horizontally (H) polarized in the lab x–y plane the emission was strongly polarized in the same horizontal direction (Fig. 4, left). The intensity seen through a vertically oriented polarizer (V) is 30-fold less, corresponding to a polarization of 0.94. This is already an unusual value exceeding the limit of 0.5 for an isotropic sample with colinear transition moments [21].
Fig. 4.
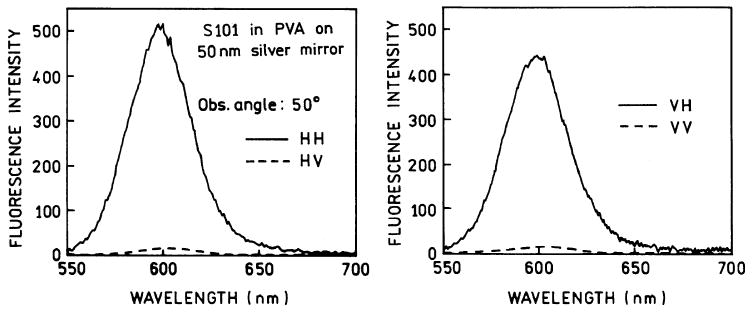
Polarized emission spectra with polarized excitation for the 30-nm-thick sample.
We then examined the sample with vertically polarized excitation. Surprisingly, the SPCE is still strongly polarized in the horizontal direction (Fig. 4, right). In contrast to the SPCE, the free-space emission displayed similar intensities for both polarized components of the emission (Fig. 5). Examination of Fig. 4 shows that the emission is polarized in the plane of incidence (p-polarized) irrespective of the polarization of the excitation. The polarization of the directional emission proves that it is due to coupling with the surface plasmons and that the polarization of the SPCE is independent of the polarization of the normal incidence excitation. Similarly, SPCE is also p-polarized. This suggests that the emission dipoles parallel to the plane of incidence couple into the surface plasmon, and dipoles perpendicular to the plane of incidence do not result in SPCE or at least display less-efficient coupling. For accuracy we note that the relationship between fluorophore orientation and coupling to the metal surface has been studied theoretically, as summarized in [15], but not experimentally. Additionally, we refer to the fluorophore as emitting into the substrate, but one can also consider the surface plasmons to be the source of emission in the substrate.
Fig. 5.
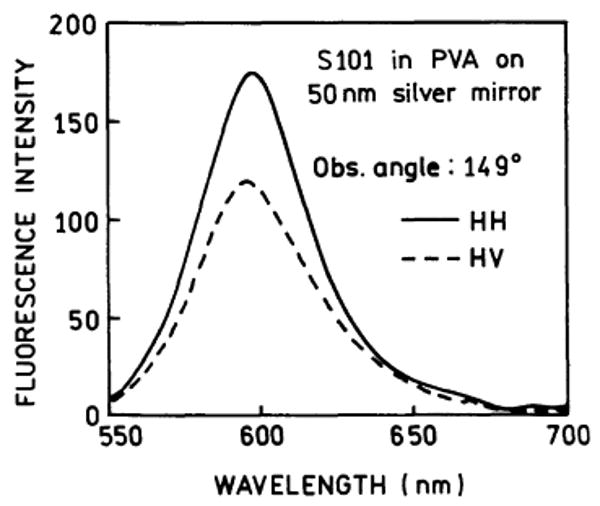
Polarized emission spectra of the free-space emission of S101 in PVA, 30 nm thick.
Since the emission displays the same p-polarization with vertically or horizontally polarized light, one can reason that the emission should be the same for all azimuthal angles (θA) around an axis normal to the metal. The symmetry of the SPCE can be preserved by using a hemi-spherical rather than a hemi-cylindrical prism. In this case we expect the emission to form a cone central around the normal axis (Scheme 3). The SPCE is expected to be p-polarized, which means that in this case the electric vector points radially from the central axis.
Scheme 3.
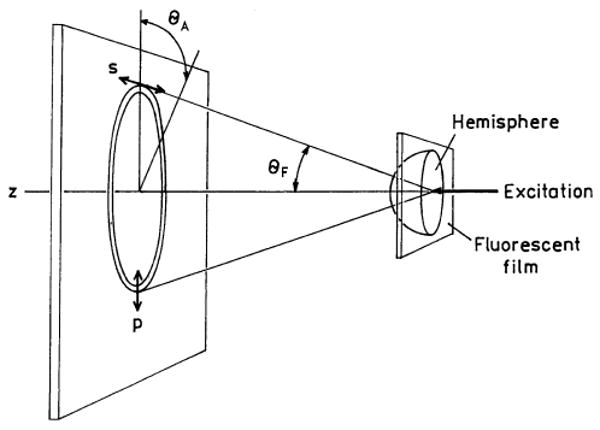
Cone of emission with a hemi-spherical prism.
We looked for a cone of emission using a hemispherical prism. The emission was visualized by incidence on a sheet of tracing paper (Fig. 6). The cone remained unchanged upon rotation of the excitation polarization. When viewed through a polarizer the two sides or the top and bottom of the cone were extinguished, depending on the orientation of the polarizer. This observation, and the polarized intensities shown in Fig. 4, demonstrate that the SPCE is p-polarized, with the electric vector pointing away from the central axis at all azimuthal angles.
Fig. 6.
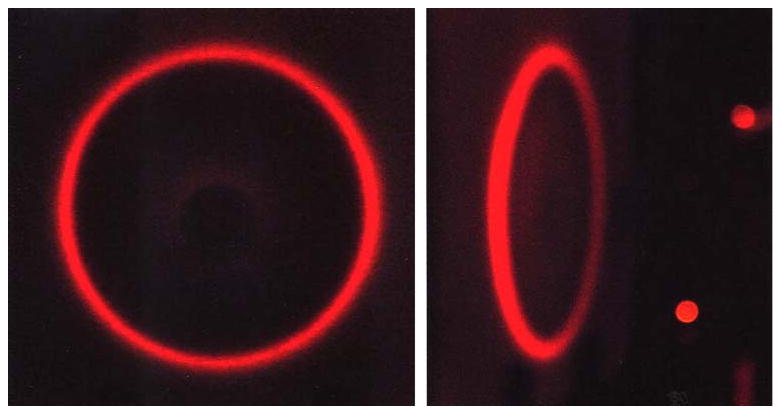
Cone of emission for S101 in PVA observed with a hemi-spherical prism and RK excitation (Scheme 3). The emission was incident on tracing paper and photographed through a LWP 550 nm filter.
In previous studies of the effects of silver particles on fluorophores we observed substantial decreases in lifetimes as the intensities increased [7–10]. We interpreted this effect as an increase in the radiative decay rates near the metal particles [22,23]. In an analogous way we expected the radiative decay rate to be increased in the direction of the surface plasmon angle. Stated alternatively, we imagined that a large fraction of the emission appeared as SPCE because the rate of transfer to the surface plasmon was larger than the rate of spontaneous free-space emission. Hence, we expected the lifetime of SPCE to be shorter than that of the free-space emission.
Fig. 7 shows frequency-domain intensity decays for the free-space emission (top) and the surface plasmon-coupled emission (bottom). Overall, the lifetimes of S101 from 1.2 to 2 ns are shortened from that found for a more dilute sample of S101 in PVA near 3 ns. We attribute this effect to self-quenching. There is a modest effect of thickness of the PVA film, with a shorter mean lifetime for a thinner film. This effect may be due to quenching interactions with the metal surface [24,25]. The more important result is the similar intensity decays for the free-space and SPCE (Fig. 7 and Table 1). This was an unexpected result which we do not fully understand. We carefully considered possible artifacts and the effects of sample geometry, but can conclude only that our experiments indicate that the component of SPCE that we observe occurs without a substantial change in lifetime. At present we do not understand the origin of this discrepancy.
Fig. 7.
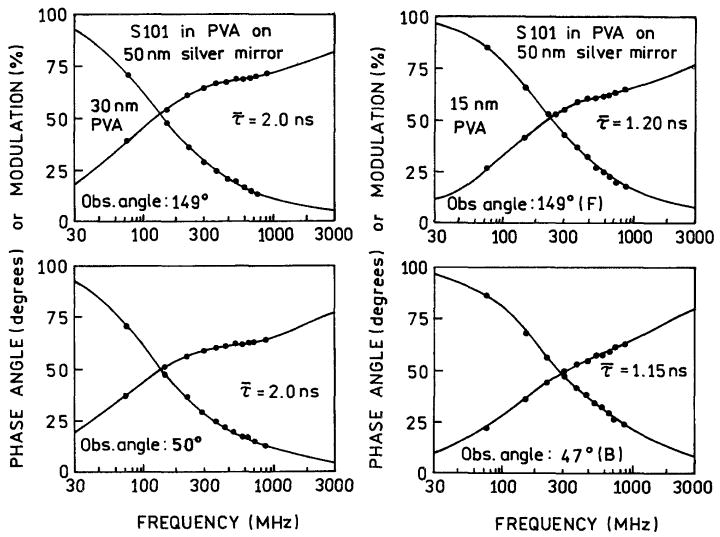
Frequency-domain intensity decays of S101 in PVA. Top, free-space emission. Bottom, surface plasmon-coupled emission.
Table 1.
Multiexponential analysis of the intensity decays of S101 spin coated on 50-nm silver mirror
| Thickness of PVA | Observation angles | τ̄a (ns) | 〈τ〉 (ns) | αi | fi | τi (ns) | ||
|---|---|---|---|---|---|---|---|---|
| Reverse Kretschmann excitation | ||||||||
| 30 nm | 50° | 2.02 | 0.90 | 0.544 | 0.079 | 0.13 | ||
| 0.294 | 0.396 | 1.21 | ||||||
| 0.162 | 0.525 | 2.92 | 1.2 | |||||
| 149° | 2.02 | 1.13 | 0.410 | 0.049 | 0.14 | |||
| 0.333 | 0.347 | 1.18 | ||||||
| 0.257 | 0.604 | 2.65 | 1.6 | |||||
| 15 nm | 47° | 1.15 | 0.59 | 0.554 | 0.157 | 0.16 | ||
| 0.434 | 0.752 | 0.97 | ||||||
| 0.012 | 0.091 | 4.28 | 3.4 | |||||
| 149° | 1.20 | 0.62 | 0.500 | 0.082 | 0.10 | |||
| 0.442 | 0.698 | 0.97 | ||||||
| 0.058 | 0.220 | 2.33 | 2.6 | |||||
| Surface Plasmon excitation | ||||||||
| 30 nm | 50° | 1.71 | 1.02 | 0.369 | 0.034 | 0.09 | ||
| 0.155 | 0.084 | 0.55 | ||||||
| 0.476 | 0.882 | 1.90 | 1.0 | |||||
| 15 nm | 47° | 1.64 | 0.59 | 0.605 | 0.140 | 0.14 | ||
| 0.317 | 0.452 | 0.83 | ||||||
| 0.078 | 0.408 | 3.06 | 2.5 | |||||
The intensity decays were modeled as a multiexponential decay where αi are the preexponential factors, Σ αi = 1.0, and τi are the decay times. The mean lifetime is given by . The amplitude weighted lifetime is given by 〈τ〉 = Σαiτi.
Wavelength resolution of SPCE
Examination of Eqs. (1) and (8) indicate that the surface plasmon angle depends on wavelength. This suggests that fluorophores with different emission maxima will display SPCE at different angles. We tested this possibility using a mixture of three fluorophores in a 30-nm-thick PVA film. The concentrations were adjusted to obtain comparable emission from each fluorophore when exciting at 514 nm and observing the free-space emission (Fig. 8, top). We recorded the emission spectra at different observation angles. These spectra are clearly distinct at each angle, with shorter wavelengths occurring for larger angles. This is consistent with Eq. (8) because a decrease in wavelength increases the magnitude of the wavevector, so that sin θ and θ have to be smaller to satisfy the matching condition. This effect can also be understood by considering the component of the p-polarized incident wavevector in the metal plane. This component increases with an increase in θ. For a larger wavevector (smaller wavelength) the angle has to be smaller to decrease the in-plane component to match kSP. The separation of wavelengths can be seen visually in the horizontal plane. Minor movements in the position of your eye shifts the color of the SPCE from red to green (Fig. 8, right panels). Only a small movement is required, as can be seen from the apparent constant position of the optical hardware.
Fig. 8.
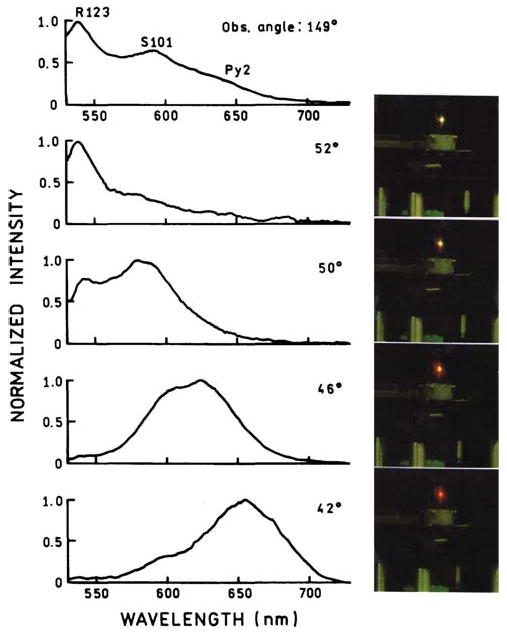
Emission spectra and photographs of SPCE for a three-fluorophore mixture observed at different angles from the normal axis using the hemi-cylindrical prism. All concentrations of dyes in the evaporated films were about 10 mM.
We then examined the SPCE from the fluorophore mixture using the hemi-spherical prism (Fig. 9). The SPCE was imaged on white tracing paper. A circular rainbow pattern was observed with the shorter wavelength appearing at the outer edges of the rainbow. The SPCE could be seen even without a long-pass emission filter but the green incident light was also present (top). Removal of the scattered incident light with a long-pass filter resulted in a easily visible rainbow (middle and bottom). This result demonstrated that SPCE can provide wavelength resolution without additional dispersive optics.
Fig. 9.
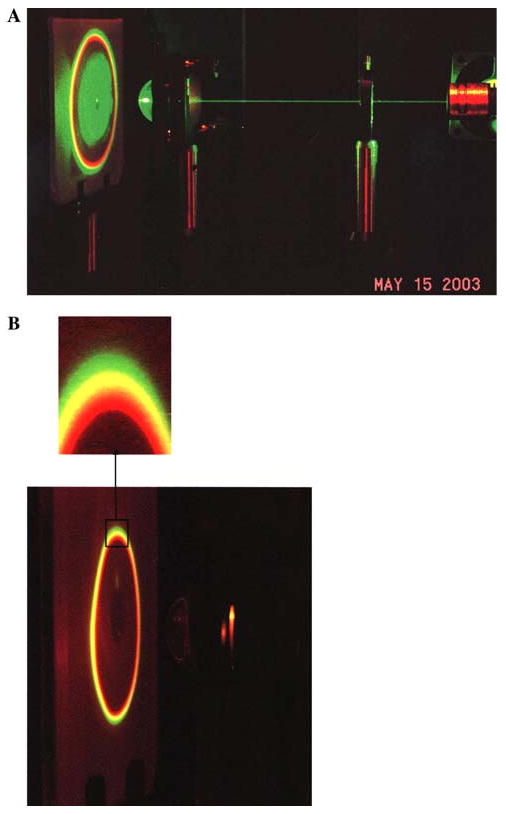
Photograph of SPCE from the mixture of fluorophores using RK excitation and a hemi-spherical prism, 532 nm excitation. Top, no emission filter. Bottom, through a long-pass filter but no notch filter.
Background rejection with SPCE
While there is some quenching for fluorophores within 10 nm of a silver film, SPCE occurs most efficiently for fluorophores near the metal film [15]. This suggests the use of SPCE for selective observation of fluorophores near the metal and rejection of emission fluorophores more distant from the metal. We tested this possibility by adding a “background” fluorophore more distant from the metal. This was accomplished by making the coated silver film part of a 1-mm-thick demountable cuvette. The cuvette was filled with a solution of rhodamine 6G in ethanol. PVA is weakly soluble in ethanol and the dyes remained separate for the course of the experiments. The free-space emission was observed at 149° and the SPCE was observed at 77°. The surface plasmon angle for the emission changed from 50° to 77° due to the higher refractive index of ethanol as compared to air (Appendix). The concentrations were chosen so that the free-space emission was dominated by the R6G background (Fig. 10, –– –– ––). Even with this large background signal the SPCE was dominated by S101 which is closer to the metal film (Fig. 10, –––––). We note that the PVA thickness was only 30 nm, so that some R6G was present within the distance for SPCE, accounting for the remaining intensity of R6G at 550 nm. More effective background suppression can be expected with a thicker PVA or sample film to keep this impurity more distant from the metal film.
Fig. 10.
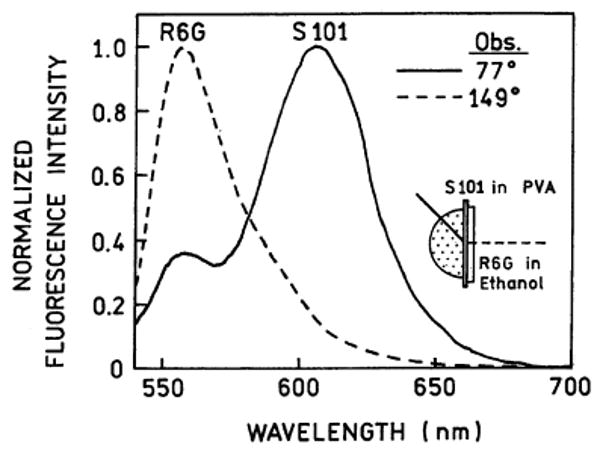
Emission spectra of S101 in PVA with simulated background emission from rhodamine 6G (R6G). The fiber was positioned near the sample and the slit was removed to collect the total emission. RK excitation, 30-nm-thick PVA. The concentration of S101 in the PVA film was about 10 mM and the concentration of R6G in ethanol was about 5 μM.
Properties of SPCE with Kretschmann excitation
It is of interest to examine SPCE using the Kretschmann configuration (Scheme 4), which provides some benefit. With Kretschmann illumination the fluorophores are excited by the evanescent field which occurs when the incident angle equals the surface plasmon angle for the excitation wavelength (θSP). At this angle the incident intensity is amplified about 20-fold due to the resonance interaction [18,19]. Additionally, the evanescent field is localized near the metal film, providing localized excitation near the metal. For a multiphoton processes the increased local intensity would result in a quadratic 400-fold increase in the rate of excitation. Fig. 11 shows the angular distribution of the S101 emission with surface plasmon excitation (SPE). In this case emission is observed on the same side of the metal film as the excitation. The emission appears to be more sharply distributed than that for RK excitation (Fig. 2), but this observation requires further study. In contrast to RK excitation, emission from S101 is observed only when the angle of incidence equals θSP and when the excitation is p-polarized. There appears to be less free-space emission with surface plasmon KR excitation (Fig. 11) than with RK excitation (Fig. 2). This difference is consistent with our expectation that KR excitation is localized near the metal, which excites those fluorophores that are more strongly coupled with the surface plasmon. This coupling is evidenced by the strongly p-polarized emission at 47° (not shown). We compared the relative intensities of the same S101 sample with surface plasmon (KR) or RK excitation (Fig. 12). The emission intensity is about 10-fold larger with SPE, consistent with a resonance-enhanced incident field. We note that the actual increase in SPCE with SPE is likely to be larger than 10-fold because SPE is localized near the metal film and RK excitation is uniform across the film, which increases the amount of free-space emission.
Scheme 4.
Configuration of Kretschmann (KR) excitation. Not drawn to scale, the Ag film is 50 nm thick and the PVA film is 15 or 30 nm thick.
Fig. 11.
Angular distribution of the emission of S101 in 15-nm-thick PVA with Kretschmann excitation of θSP = 50°. The emission maximum was about 47°.
Fig. 12.
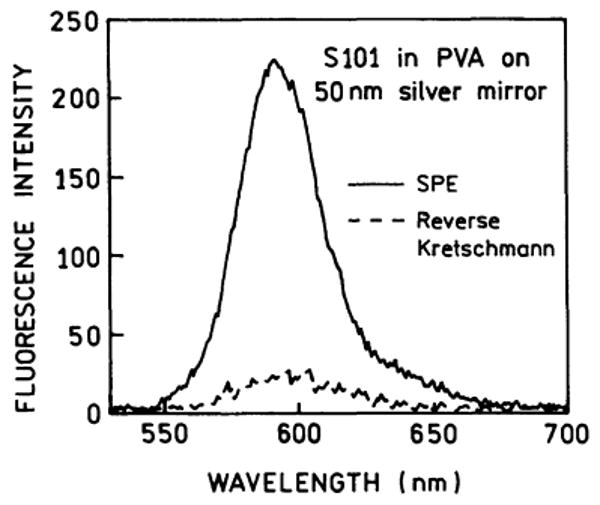
Comparison of the emission intensities of S101 in PVA with surface plasmon and reverse Kretschmann configurations.
As noted for Fig. 7 we were surprised to observe that the mean lifetimes were not dramatically shortened for the SPCE with RK excitation. We reasoned that there may be a large effect on the lifetime with surface plasmon excitation, where the excited state population is localized more closely to the metal film. The frequency-domain intensity decays of S101 with SPE (Fig. 13) revealed mean lifetimes approximately the same as those found with RK excitation (Table 1). SPCE appears to occur without a significant decrease in lifetime. Phenomenologically, it seems that the emission to the prism side of total space is collapsed to a single angle (θF), rather than an increased rate of radiative decay at θF. We also examined the effect of surface plasmon excitation on the angular dispersion of emission wavelength (Fig. 14). The use of RK or KR excitation did not affect this distribution, as can be seen by comparing Figs. 8 and 14.
Fig. 13.
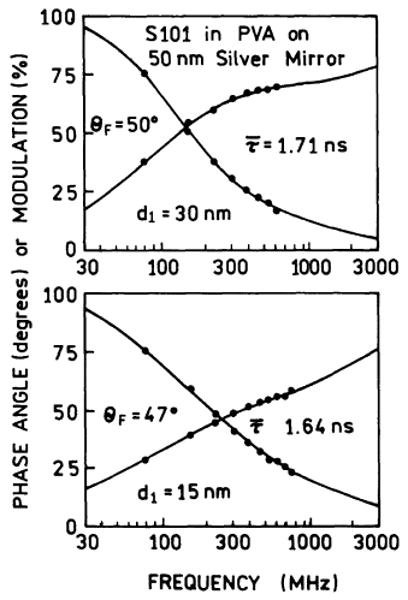
Frequency-domain intensity decays of S101 with surface plasmon excitation.
Fig. 14.
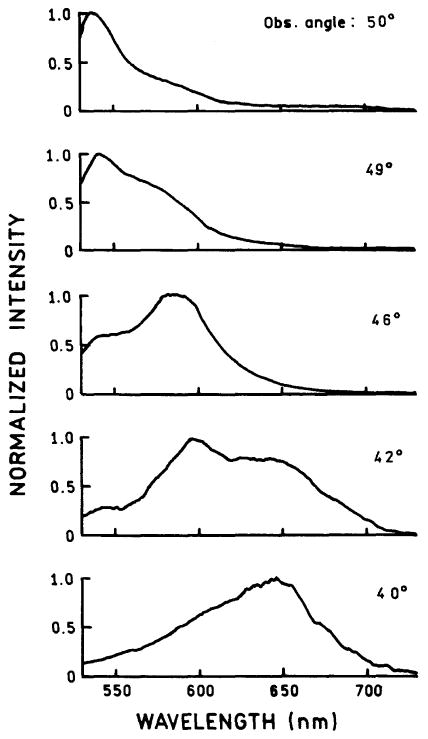
Dependence of the emission spectra for the three component mixture (R123, S101, Py2) on the angle of observation. The angles are defined in Fig. 11.
Background suppression with surface plasmon excitation
In Fig. 10 we showed that fluorophores near the metal coupled more strongly with the surface plasmon, effectively rejecting background emission from more distal fluorophores. We reasoned that background rejection should be more effective with SPE because of its localization near the metal. This concept was tested using S101 in PVA as the desired emission, and a 1-mm-thick ethanol solution of Py2 as the background (Fig. 15). In this figure the concentration of Py2 was increased progressively from top to bottom. For the free-space spectra (· · ·) the emission is dominated by Py2 at all concentrations. For the lowest concentration of Py2 (Fig. 15, top) the surface plasmon-coupled emission with RK excitation (–– –– ––) is dominated by S101, which is closer to the metal film. If the concentration of Py2 is increased the SPCE of Py2 becomes substantial with RK excitation (middle and bottom). However, with surface plasmon KR excitation the emission is always dominated by S101, even at the highest concentration of Py2 (––––––). These spectra demonstrate that the background from fluorophores distal from the metal can be suppressed by observing the SPCE and suppressed further by observation of the SPCE with surface plasmon KR excitation.
Fig. 15.
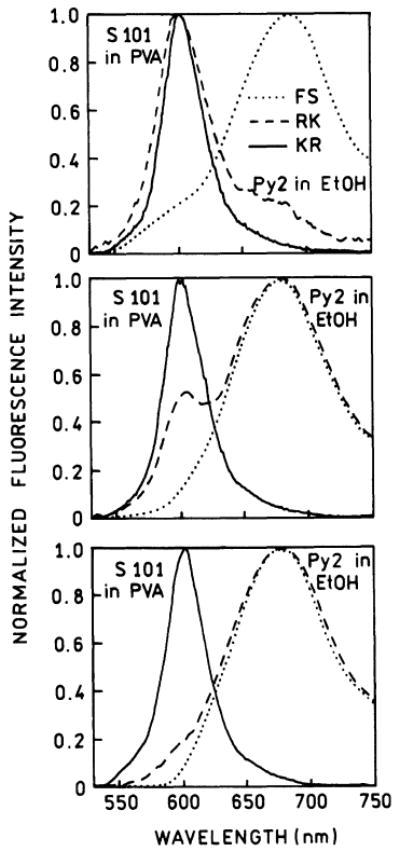
Emission spectra and background rejection as seen with free-space (FS), reverse Kretschmann (RK), and Kretschmann (KR) SPCE. The “background” was Py2 in ethanol in a 1-mm-thick layer adjacent to the PVA film with S101. The concentrations of S101 in PVA was near 10 mM. The concentrations of Py2 in ethanol from top to bottom were 7.5, 15, and 30 μM.
Discussion
Surface plasmon-coupled emission offers numerous advantages for high-sensitivity detection in a wide range of formats. Selective observations of the fluorophores near the metal surface can be useful for any type of surface-bound assay, such as immunoassays and DNA arrays. The extent of background interference will be reduced due to weaker coupling of the more distal fluorophore. The illumination intensity can be decreased due to the amplified incidence field. A larger field may increase the rate of photobleaching, so that total number of photons emitted per fluorophore may not be increased. However a decreased illumination intensity will result in decreased autofluorescence from all the optical components, including the glass or plastic substrates. It would be relatively simple to coat microtiter plates or other surfaces with silver. Silver is somewhat reactive so that surface protection coatings may be needed. Gold is more inert and visually does not require surface protection. In recent experiments we showed that SPCE also occurs with gold films [26], making this technology applicable to any assay using gold films such as SPR to measure bioaffinity reactions [27,28].
SPCE can also facilitate single-molecule detection (SMD). In SMD the total signal level is often limited by the photostabillity of the fluorophores and the collection efficiency for the emitted photons [29]. SMD is also limited by autofluorescence from this sample. The use of SPCE could increase the efficiency of light collection, with higher collection efficiencies being possible with simple shapes [15]. Autofluorescence will be decreased by the factors discussed above. It seems likely that counting of single molecules with high efficiency will be accomplished more readily using SPCE.
Another valuable possibility is combining SPCE with the effects of small metallic particles [6–12]. Subwavelength-size silver particles can increase the quantum yields and photostabilities of fluorophores within about 10 nm of the metal surface. In contrast, SPCE occurs over longer distances and apparently without an increase in the rate of radiative decay. These differences suggest that one could obtain increased signal levels which are the product of these two effects. As an example, silver particles could be immobilized with the distances for SPCE. The sensing chemistry could be immobilized on the silver particles. These fluorophores should then display a dramatic increase in intensity due to interactions with the silver particles and directional emission at the surface plasmon angle of the emission. Of course, there will be interactions between plasmons on the particles and on the metal film, but this is likely only to shift the plasmon angles and not to eliminate the effects.
Acknowledgments
This work was supported by the National Center for Research Resources, RR-08119, HG-002655, EB000682, and EB-00981. The authors thank Mr. Joe Howe from EMF Co. (Ithaca, NY) for helpful suggestions about the metal coatings.
Appendix. Calculation of reflectivity curves for a four-phase system
The previous results show that SPCE is directly related to surface plasmons in the metal films and occurs at angles where surface plasmon resonance (SPR) occurs for the incident light. The occurrence of SPR is usually shown by the angle-dependent reflectivity curves for the metal film. The light is incident through the high-refractive-index medium (prism) because SPR cannot be excited from the air side of the sample. It is valuable to be able to calculate the reflectivity curves for various geometries and optical properties of the glass and solvents.
The equations needed to calculate reflectivity can be found in the literature [30,31], but the correct expressions are difficult to find and interpret. Hence we summarize the expression needed to calculate the reflectivity of a four-phase system (Fig. A1). These calculations can also be performed using web-based software [32], but we found it convenient to program the expressions in MathCad. The system is shown in Fig. A1 and consist of four regions: the medium (0) with dielectric permittivity ε0, the sample (1) of thickness d1 and dielectric permittivity ε1, metal (m) of thickness dm and complex dielectric permittivity εm = εr + iεim, and glass prism (2) with dielectric permittivity ε2. For this system the intensity reflection coefficient R is described by the expression
Figure A1.
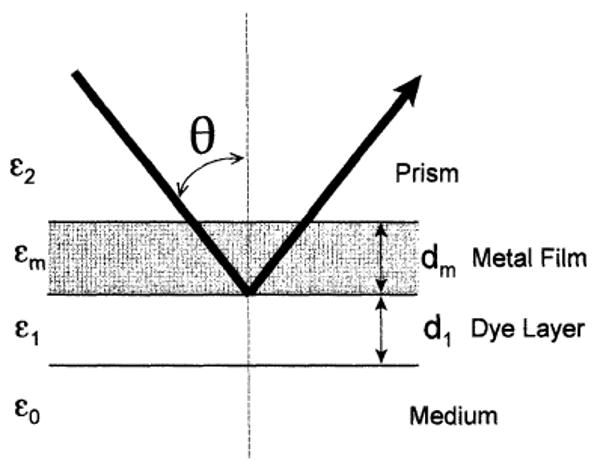
Schematic of a four-layer system with a metal film.
where
| (A.1) |
θ is the angle of incidence of light upon the prism-metal interface that determines wavevector component k that is parallel to the interface; λ is the wavelength of light in vacuum.
It is informative to examine reflectivity curves for parameters similar to those used for the above experiments. Fig. A2 shows the reflectivity curves for two thickness of PVA on a 50-nm-thick silver film, 15 and 30 nm. The reflectivity of the metal film with a 15-nm PVA layer showed a sharp minimum at 46°. The minimum increased to 48° for the thicker PVA layer. This effect occurs because the evanescent field extends beyond 30 nm, so that an increase in PVA thickness results in a higher effective dielectric constant seen by the evanescent field.
The SPR angle is strongly influenced by the medium above the sample film. This is illustrated by Fig. A3, which shows the effect of changing air (ε0 = 1.0) to ethanol with ε0 = 1.847.
Figure A3.
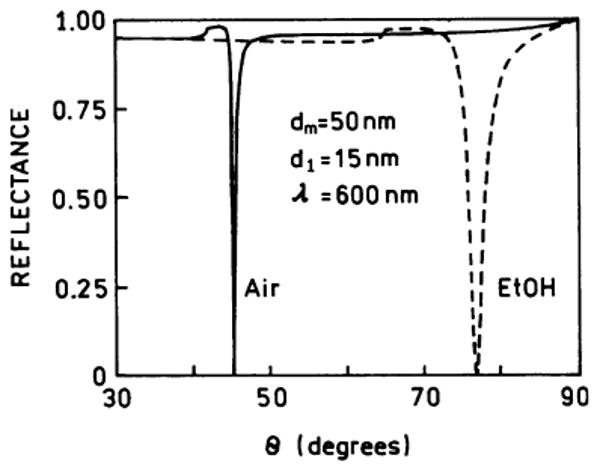
Effect of replacing air (ε0 = 1.0) with ethanol (ε0 = 1.847) on the reflectivity of a 50-nm silver film; εm = −17 + 0.6i and ε2 = 2.25.
Footnotes
Abbreviations used: KR, Kretschmann; SPCE, surface plasmon-coupled emission; PVA, polyvinyl alcohol; Py2, pyridine 2; R6G, rhodamine 6G; RK, reverse Kretschmann; SPE, surface plasmon excitation; SPR, surface plasmon resonance; SPRA, SPR analysis; S101, sulforhodamine 101; TIR, total internal reflectance; SMD, single-molecule detection.
References
- 1.Diamandis EP. Immunoassays with time-resolved fluorescence spectroscopy: principles and applications. Clin Biochem. 1988;21:139–150. doi: 10.1016/0009-9120(88)90001-x. [DOI] [PubMed] [Google Scholar]
- 2.Lövgren T, Pettersson K. Time-resolved fluoroimmunoassay, advantages and limitations. In: Van Dyke K, Van Dyke R, editors. Luminescence Immunoassay and Molecular Applications. CRC Press; New York: 1990. pp. 234–250. [Google Scholar]
- 3.White JC, Stryer L. Photostability studies of phycobiliprotein fluorescent labels. Anal Biochem. 1987;161:442–452. doi: 10.1016/0003-2697(87)90473-8. [DOI] [PubMed] [Google Scholar]
- 4.Kronick MN. The use of phycobiliproteins as fluorescent labels in immunoassays. J Immunol Methods. 1986;92:1–13. doi: 10.1016/0022-1759(86)90496-5. [DOI] [PubMed] [Google Scholar]
- 5.Ambrose WP, Goodwin PM, Jett JH, Van Orden A, Wemer JH, Keller RA. Single molecule fluorescence spectroscopy at ambient temperature. Chem Rev. 1999;99:2929–2956. doi: 10.1021/cr980132z. [DOI] [PubMed] [Google Scholar]
- 6.Lakowicz JR. Radiative decay engineering: biophysical and biomedical applications. Anal Biochem. 2001;298:1–24. doi: 10.1006/abio.2001.5377. [DOI] [PMC free article] [PubMed] [Google Scholar]
- 7.Lakowicz JR, Shen Y, D'Auria S, Malicka J, Gryczynski Z, Gryczynski I. Radiative decay engineering 2: effects of silver island films on fluorescence intensity, lifetimes and resonance energy transfer. Anal Biochem. 2002;301:261–277. doi: 10.1006/abio.2001.5503. [DOI] [PMC free article] [PubMed] [Google Scholar]
- 8.Lakowicz JR, Gryczynski I, Shen Y, Malicka J, Gryczynski Z. Intensified fluorescence. Photon Spectra. 2001:96–104. [Google Scholar]
- 9.Malicka J, Gryczynski I, Fang J, Lakowicz JR. Fluorescence spectral properties of cyanine dye-labeled DNA oligomers on surfaces coated with silver particles. Anal Biochem. 2003;317:136–146. doi: 10.1016/S0003-2697(03)00005-8. [DOI] [PMC free article] [PubMed] [Google Scholar]
- 10.Malicka J, Gryczynski I, Lakowicz JR. Enhanced emission of highly labeled DNA oligomers near silver metallic surfaces. Anal Chem. 2003;75:4408–4414. doi: 10.1021/ac020739m. [DOI] [PMC free article] [PubMed] [Google Scholar]
- 11.Haroche S, Kleppner D. Cavity quantum electrodynamics. Phys Today. 1989:24–30. [Google Scholar]
- 12.Haroche S, Raimond JM. Cavity quantum electrodynamics. Sci Am. 1993:54–62. [Google Scholar]
- 13.Raether H. Surface Plasmons on Smooth and Rough Surfaces and on Gratings. Springer-Verlag; New York: 1988. p. 136. [Google Scholar]
- 14.Liebsch A. Electronic Excitations at Metal Surfaces. Plenum Press; New York: 1997. p. 336. [Google Scholar]
- 15.Lakowicz JR. Radiative Decay Engineering 3. Surface Plasmon-Coupled Directional Emission. Anal Biochem. 2004 doi: 10.1016/j.ab.2003.09.039. in this issue. [DOI] [PMC free article] [PubMed] [Google Scholar]
- 16.Kurihara K, Suzuki K. Theoretical understanding of an absorption-based surface plasmon resonance sensor based on Kretschmannn's theory. Anal Chem. 2002;74:696–701. doi: 10.1021/ac010820+. [DOI] [PubMed] [Google Scholar]
- 17.Salamon Z, Macleod HA, Tollin G. Surface plasmon resonance spectroscopy as a tool for investigating the biochemical and biophysical properties of membrane protein systems. I: theoretical principles. Biochim Biophys Acta. 1997;1331:117–129. doi: 10.1016/s0304-4157(97)00004-x. [DOI] [PubMed] [Google Scholar]
- 18.Neumann T, Johansson ML, Kambhampati D, Knoll W. Surface-plasmon fluorescence spectroscopy. Adv Funct Mater. 2002;12(9):575–586. [Google Scholar]
- 19.Liebermann T, Knoll W. Surface-plasmon field-enhanced fluorescence spectroscopy. Colloids Surfaces. 2000;171:115–130. [Google Scholar]
- 20.Laczko G, Lakowicz JR, Gryczynski I, Gryczynski Z, Malak K. A 10-GHz frequency domain fluorometer. Rev Sci Instrum. 1990;61:233–2337. [Google Scholar]
- 21.Lakowicz JR. Principles of Fluorescence Spectroscopy. second. Kluwer Academic/Plenum Press; New York: 1999. p. 698. [Google Scholar]
- 22.Barnes WL. Fluorescence near interfaces: the role of photonic mode density. J Mod Opt. 1998;45(4):661–699. [Google Scholar]
- 23.Lakowicz JR, Malicka J, Gryczynski I, Gryczynski Z, Geddes CD. Radiative decay engineering: the role of photonic mode density in biotechnology. J Phys D. 2003;36:R240–R249. doi: 10.1088/0022-3727/36/14/203. [DOI] [PMC free article] [PubMed] [Google Scholar]
- 24.Shu QQ, Hansma PK. Fluorescent apparent quantum yields for excited molecules near dielectric interfaces. Thin Solid Films. 2001;384:76–84. [Google Scholar]
- 25.Daffertshofer M, Port H, Wolf HC. Fluorescence quenching of ultrathin anthracene films by dielectric and metallic substrates. Chem Phys. 1995;200:225–233. [Google Scholar]
- 26.Gryczynski I, Malicka J, Gryczynski Z, Lakowicz JR. Surface plasmon-coupled emission using gold films. J Phys Chem B. 2003 doi: 10.1021/jp040221h. submitted. [DOI] [PMC free article] [PubMed] [Google Scholar]
- 27.Malmqvist M. BIACORE: an affinity biosensor system for characterization of biomolecular interactions. Biochem Soc Trans. 1999;27:335–340. doi: 10.1042/bst0270335. [DOI] [PubMed] [Google Scholar]
- 28.Woodbury RG, Wendin C, Clendenning J, Melendez J, Elkind J, Bartholomew D, Brown S, Furlong CE. Construction of biosensors using a gold-binding polypeptide and a miniature integrated surface plasmon resonance sensor. Biosensors Bioelectronics. 1997;13:1117–1126. doi: 10.1016/s0956-5663(98)00060-8. [DOI] [PubMed] [Google Scholar]
- 29.Soper SA, Nutter HL, Keller RA, Davis LM, Shera EB. The photophysical constants of several fluorescent dyes pertaining to ultrasensitive fluorescence spectroscopy. Photochem Photobiol. 1993;57(6):972–977. [Google Scholar]
- 30.Raether H. Surface plasma oscillations and their applications. In: Hass G, Francombe MH, Hoffman RW, editors. Physics of Thin Films, Advances in Research and Development. Vol. 9. Academic Press; New York: 1977. pp. 145–261. [Google Scholar]
- 31.Pockrand I. Surface plasma oscillations at silver surfaces with thin transparent and absorbing coatings. Surface Sci. 1978;72:577–588. [Google Scholar]
- 32.Nelson BP, Frutos AG, Brockman JM, Corn RM. Near-infrared surface plasmon resonance measurements of ultrathin films. 1. Angle shift and SPR imaging experiments. Anal Chem. 1999;71:3928–3934. [Google Scholar]