Summary
Many plants synthesize the volatile phenylpropene compounds eugenol and isoeugenol to serve in defense against herbivores and pathogens and to attract pollinators. Clarkia breweri flowers emit a mixture of eugenol and isoeugenol, while Petunia hybrida flowers emit mostly isoeugenol with small amounts of eugenol. We recently reported the identification of a petunia enzyme, PhIGS1, that catalyzes the formation of isoeugenol, and an Ocimum basilicum (basil) enzyme, ObEGS1, that produces eugenol. ObEGS1 and PhIGS1 both utilize coniferyl acetate, are 52% sequence identical, and belong to a family of NADPH-dependent reductases involved in secondary metabolism. Here we show that C. breweri flowers have two closely related proteins (96% identity), CbIGS1 and CbEGS1, that are similar to ObEGS1 (58% and 59%) and catalyze the formation of isoeugenol and eugenol, respectively. In vitro mutagenesis experiments demonstrate that substitution of only a single residue can substantially affect the product specificity of these enzymes. A third C. breweri enzyme identified, CbEGS2, also catalyzes the formation of eugenol from coniferyl acetate and is only 46% identical to CbIGS1 and CbEGS1 but more similar (>70%) to other types of reductases. We also found that petunia flowers contain an enzyme, PhEGS1, that is highly similar to CbEGS2 (82% identity) and that converts coniferyl acetate to eugenol. Our results indicate that plant enzymes with EGS and IGS activities have arisen multiple times and in different protein lineages.
Keywords: secondary metabolism, biochemistry, protein structure, plant volatile, scent
Introduction
Eugenol and isoeugenol belong to a class of compounds, the phenylpropenes, which are derived from phenylalanine. The phenylpropenes are important constituents in many spices used by humans and have therefore played important roles in human nutrition (Prasad et al., 2004). The phenylpropenes are generally toxic to animals and microorganisms, and many plants synthesize them in their vegetative parts as defense against herbivores and pathogens (Grossman, 1993, Obeng-Ofori and Reichmuth, 1997).
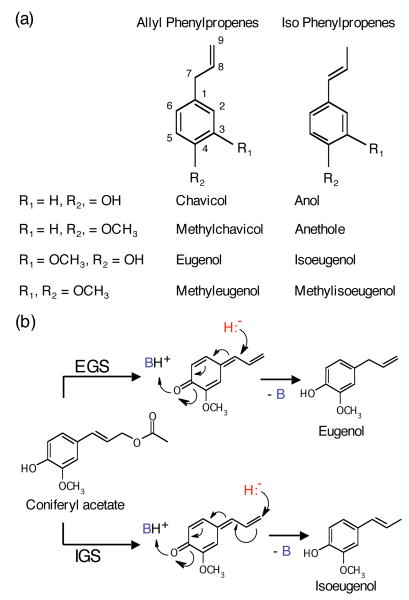
The floral scent bouquet of many species contain volatile phenylpropenes. For example, the flowers of the California annual Clarkia breweri emit a mixture of volatiles that include eugenol, isoeugenol, methyleugenol, and methylisoeugenol (Raguso and Pichersky, 1995) (Figure 1a). Flowers of Petunia hybrida, another moth-pollinated species, emit high levels of isoeugenol, as well as smaller amounts of eugenol (Verdonk et al., 2003). Many herbs, such as basil, also synthesize and store phenylpropenes in glands on their leaves (Gang et al., 2001)
Figure 1. Structures of representative phenylpropenes and reaction mechanism of EGS and IGS enzymes.
(a) Structures of chavicol, anol, eugenol, isoeugenol, and their methylated derivatives. The carbon numbering system used in the text is shown.
(b) The reaction mechanism of EGS and IGS uses a quinone methide intermediate (Louie et al., 2007). B (in blue) represents a general base consisting of K132 and a bridging water molecule. H- (in red) represents the hydride transferred from NADPH.
We have recently shown that petunia flowers possess an NADPH-dependent enzyme, isoeugenol synthase 1 (PhIGS1), which converts coniferyl acetate to isoeugenol, while leaf glands of basil (Ocimum basilicum) possess the enzyme eugenol synthase 1 (ObEGS1) which converts the same precursor to eugenol (Koeduka et al., 2006). The PhIGS1 and ObEGS1 proteins are approximately 50% identical and are also homologous to several other reductases involved in phenylpropanoid metabolism in plants, including pinoresinol-lariciresinol reductase (PLR), isoflavone reductase (IFR), phenylcoumaran benzylic ether reductase (PCBER), leucocyanidin reductase (LAR), and pterocarpan reductase (PTR), collectively termed the PIP reductase family after the first three enzymes discovered in this family (Gang et al., 1999; Min et al., 2003; Tanner et al., 2003; Akashi et al., 2006).
Eugenol and isoeugenol differ in the position of the double bond in the propene side chain (Figure 1a). PhIGS1 and ObEGS1 represent an interesting example of two similar enzymes that use the same substrate but catalyze the formation of a different product. Recently, the crystal structure of ObEGS1 complexed with NADP+ and a coniferyl-acetate analog was obtained (Louie et al., 2007). Examination of this structure shows that the enzyme acts on the substrate via a “push-pull” mechanism, removing the proton of the para hydroxyl group and promoting the cleavage of the acetyl group. In the resultant quinone-methide intermediate, the C7 atom serves as the acceptor of the hydride ion from NADPH (Figure 1b). Presumably, the position of the substrate in the active site of PhIGS1 is such that the hydride is transferred to C9 instead of C7 (Figure 1b). However, the high overall level of divergence between the two enzymes precludes an easy identification of the residues involved without additional structural information, and attempts to crystallize PhIGS1 have so far failed.
Because C. breweri flowers, unlike petunia flowers or basil glands, emit a mixture of both eugenol and isoeugenol in roughly similar proportions, we investigated if a single enzyme is responsible for their synthesis, or, if two or more enzymes are involved, how related they are to each other and to PhIGS1 and ObEGS1. Our results indicate that C. breweri flowers have a eugenol synthase and an isoeugenol synthase (CbEGS1 and CbIGS1) that are closely related to each other and that the differing product specificity is determined by very few residues. Furthermore, C. breweri possesses a second eugenol synthase (CbEGS2) that is very dissimilar to both CbEGS1 and CbIGS1 and more related to non-phenylpropene producing enzymes. We also discovered that petunia has a eugenol synthase that is closely related to CbEGS2. These results suggest that both convergent and divergent evolutionary pathways have given rise to phenylpropene-forming enzymes in plants.
Results
Levels of eugenol synthase and isoeugenol synthase activities in C. breweri
Enzyme activity measurements in crude protein extracts from different floral parts 1 d post anthesis indicated that the highest levels of isoeugenol synthase specific activity were found in petals, followed by stamens, pistil, and sepals, with no activity in leaves (Table 1). The highest specific activity levels of eugenol synthase were found in the stamens, followed closely by the pistil and petals (Table 1). However, since the petal tissue constitutes the bulk of the flower (Pichersky et al., 1994), the highest overall amounts of enzymatic activities for both eugenol synthase and isoeugenol synthase occur in the petals (Table 1). These results are consistent with the previous observations that emission of eugenol, isoeugenol, and their methylated derivatives from C. breweri flowers occurred mostly in petals (Wang et al., 1997).
Table 1.
IGS and EGS activities in crude extracts of different parts of C. breweri flowers at 1 day post anthesis
| Organ | IGS | EGS | ||
|---|---|---|---|---|
| (Total WT per Flower) | Specific Activity (pkat • gFW-1) |
Total Activity (pkat • Flower-1) |
Specific Activity (pkat • gFW-1) |
Total Activity (pkat • Flower-1) |
| Leaves | NDa | NDa | NDa | NDa |
| Sepals (22.5 mg) | 0.03 ± 0.00 | 0.65 ± 0.09 | 0.03 ± 0.01 | 0.72 ± 0.11 |
| Petals (64 mg) | 0.32 ± 0.04 | 20.74 ± 2.37 | 0.05 ± 0.00 | 3.07 ± 0.13 |
| Stamens (24 mg) | 0.13 ± 0.03 | 3.22 ± 0.60 | 0.06 ± 0.01 | 1.54 ± 0.14 |
| Pistil (16 mg) | 0.05 ± 0.01 | 0.72 ± 0.18 | 0.05 ± 0.01 | 0.86 ± 0.10 |
Values are the averages of three independent experiments, +/- SE.
ND- Not detected.
Purification of EGS and IGS activities from petals of C. breweri
IGS and EGS activities were therefore purified from petals in a protocol employing several chromatographic steps (Table 2). Fractions were monitored for both IGS and EGS activities. After DEAE chromatography, a broad peak with both IGS and EGS activities was obtained. Two separate peaks of EGS activity were observed eluting from the Hitrap-Phenyl column, while only a single peak of IGS activity was obtained from this column, coeluting with the earlier peak of EGS activity (EGS peak 1 described in Table 2). The fractions of peak 1 were pooled and loaded on a Hitrap-Q column, and eluted with a KCl gradient. IGS and EGS activities eluting from this column did not separate, and the fractions in the peak of IGS and EGS activities contained three major bands of app. 55, 38, and 36 kDa (Figure 2, lane1). The presence of the 36 kDa protein (marked with an asterisk in Figure 2, lane 1) correlated best with IGS and EGS activities in the various fractions. The fractions containing EGS activity in peak 2 of the Hitrap-Phenyl column were also pooled and loaded onto a second Hitrap-Q column, and activity was eluted with a KCl gradient. A sharp peak of EGS activity was obtained (150-230 mM KCl range), and the pooled fractions of this peak contained a single protein of app. 38 kDa (marked with an asterisk in Figure 2, lane 2) with eugenol synthase activity.
Table 2.
Purification of IGS and EGS from C. breweri petals
| Purification Step | Total Protein (mg) |
Total Activity (pkat) |
Specific Activity (pkat • mg-1) |
Purification (-fold) |
Recovery (%) |
||||
|---|---|---|---|---|---|---|---|---|---|
| IGS | EGS | IGS | EGS | IGS | EGS | IGS | EGS | ||
| Crude Extract | 344.0 | 1448.1 | 367.5 | 4.2 | 1.1 | 1.0 | 1.0 | 100.0 | 100.0 |
| DE-53 | 98.6 | 671.4 | 330.3 | 6.8 | 3.4 | 1.6 | 3.1 | 46.4 | 89.9 |
| Hitrap-Phenyl (Peak 1)1 | 18.8 | 110.5 | 110.4 | 5.9 | 5.9 | 1.4 | 5.4 | 7.6 | 30.0 |
| Hitrap-Phenyl (Peak 2)1 | 3.1 | — | 158.0 | — | 50.6 | — | 46.0 | — | 43.0 |
| Hitrap-Q #1 | 3.6 | 139.6 | 107.4 | 38.8 | 29.8 | 9.2 | 27.1 | 9.6 | 29.2 |
| Hitrap-Q #2 | 0.9 | — | 108.1 | — | 118.8 | — | 108.0 | — | 29.4 |
There were two peaks of EGS activities eluting from the Hitrap-Phenyl column, and the single peak of IGS activity coincided with the first peak of EGS activity on this column, as described in the text. Data in this table labeled Peak 1 and Peak 2 were obtained from pooled fractions constituting each peak.
Figure 2. A composite SDS-PAGE gel showing purified isoeugenol and eugenol synthases from C. breweri petals.
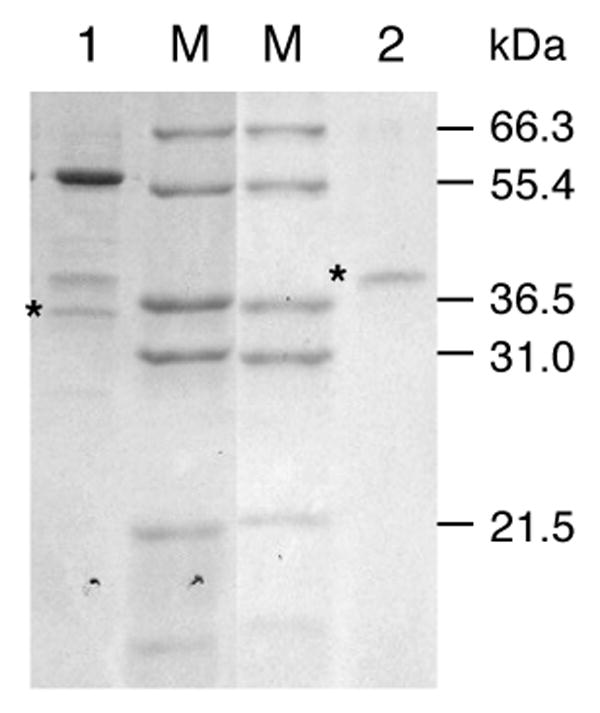
Lane 1, An aliquot of the fraction with peak IGS and EGS activities from Hitrap-Q column #1 (aliquot contains 0.94 pkatal IGS activity). Lane 2, An aliquot of the fraction with peak EGS activity from Hitrap-Q column #2 (0.81 pkatal EGS activity). M, marker lanes (molecular weights indicated on the right). The gels were stained with Coomassie Blue after SDS-PAGE electrophoresis. The bands corresponding to CbEGS1/CbIGS1 (lane 1) and CbEGS2 (lane 2) are marked with asterisks.
Isolation and characterization of C. breweri cDNAs encoding proteins with IGS and EGS activities
The 36 kDa protein band obtained in the final purification step (a Hitrap-Q column) of the peak of mixed EGS/IGS activity originally seen on the Hitrap-Phenyl column (Figure 2, lane 1) was eluted from the gel, trypsinized, and sequenced by LC-MS/MS, followed by screening a C. breweri flower EST database comprising of app. 2,000 sequences (https://sativa.biology.lsa.umich.edu/blast/blast.html, D'Auria et al., 2002). The seven peptide sequences obtained from this 36 kDa protein band were found in the predicted protein sequences encoded by two closely related ESTs that fell into two contigs, and there were no other sequences encoding any of these peptides. Because of the short nature of the sequences in this database (<500 nucleotides) and the few differences between the two contigs, it was not possible to unambiguously assign all seven ESTs into one contig or the other. However, there was one region that was clearly different between the two contigs (Figure 3a), although none of the seven peptides sequence obtained corresponded to this region. We subsequently designated the two genes represented by these two contigs as CbEGS1 and CbIGS1. Based on comparisons with ObEGS1 and PhIGS1, the contig representing CbEGS1 contained a complete open reading frame, but the contig representing CbIGS1 was missing the 5′ end. A 5′ RACE experiment was conducted to obtain the sequence of the beginning CbIGS1, using an internal primer based on sequence in a divergent region between CbEGS1 and CbIGS1 (Supplementary Table 1). The sequence thus obtained showed that the nucleotide sequences of CbEGS1 and CbIGS1 around the beginning of the open reading frame were identical to each other. Based on this information, additional cDNAs (>10) of CbEGS1 and CbIGS1 were generated by RT-PCR with primers designed for the beginning and end of the open reading frame, and the sequences of all cDNAs thus obtained were identical to either CbEGS1 and CbIGS1.
Figure 3. Sequence comparisons of CbIGS1, CbEGS1, CbEGS2, and representative PIP proteins.
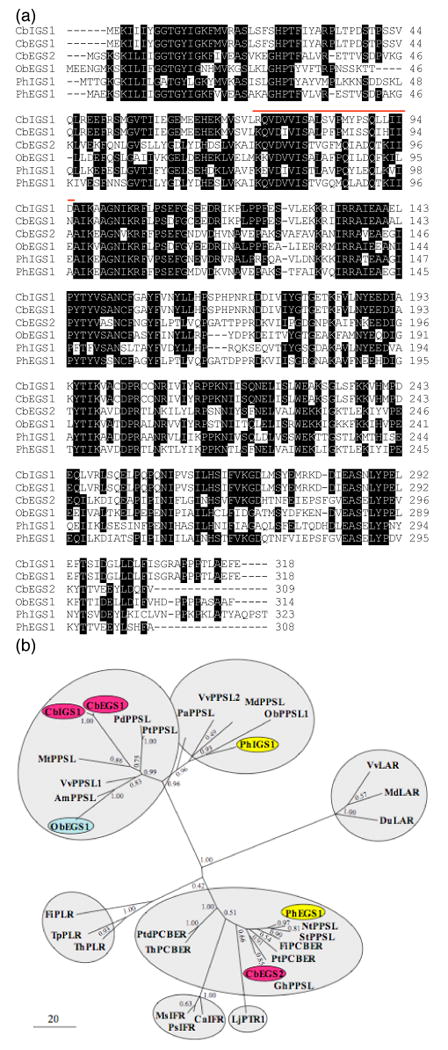
(a) A comparison of amino acid sequences of C. breweri CbIGS1, CbEGS1, and CbEGS2, petunia PhIGS1 and PhEGS1, and basil ObEGS1. White letters on black background represent identical residues in at least four sequences. The region highly divergent between CbEGS1 and CbIGS1 (positions 73-95) is indicated by a red line.
(b) Phylogenetic analysis of selected protein sequences in the PIP family showing an unrooted maximum likelihood tree. The scale indicates the number of substitutions per site. In addition to IGS/EGS-like proteins, the PIP family includes pinoresinol-lariciresinol reductases (PLR), isoflavone reductases (IFR), phenylcoumaran benzylic ether reductases (PCBER), leucocyanidin reductase (LAR), and pterocarpan reductase (PTR). Proteins biochemically characterized in C. breweri, basil, and petunia are shown on red, blue, and yellow background, respectively. Proteins for which no specific activity has been assigned are designated here as PPSL (phenylpropene synthase-like). The position of the PLR branch is uncertain (bootstrap value of 0.42), and in the neighbor-joining and maximum parsimony trees (not shown) it is closer to the ObEGS1/PhIGS1 clades. The only other disagreement among the three trees - the positions of the IFR branch and the PTR branch, which is also uncertain in the maximum likelihood tree - is discussed in the text. Am, Antirrhinum majus; Ca, Cicer arietinum; Cb, Clarkia breweri; Du, Desmodium uncinatum; Fi, Forsythia intermedia; Gh, Gossypium hirsutum; Lj, Lotus japonica; Md, Malus domestica; Ms, Medicago sativa; Mt, Medicago truncatula; Nt, Nicotiana tabacum; Ob, Ocimum basilicum; Pa, Persea americana; Pd, Populus deltoides; Ph, Petunia hybrida; Ps, Pisum sativum; Pt, Populus trichocarpa; Ptd, Pinus taeda; St, Solanum tuberosum; Th, Tsuga heterophylla; Tp, Thuja plicata; Vv, Vitis vinifera. The accession numbers of the proteins are given in Supplementary Table 2.
The single protein of app. mol. mass of 38 kDa present in the fractions constituting the peak EGS activity eluting from the second Hitrap-Q column (Figure 2, lane 2) was analyzed in the same way. The sequence of 11 peptides obtained from it matched the sequence of a protein encoded by a gene represented by four ESTs in the database constituting a single contig that was deemed to contain the entire coding region (based on comparison with PCBER proteins, see below). We consequently designated this gene as CbEGS2 and the protein it encodes as CbEGS2 (Figure 3a). There were no other EST variants encoding any of these peptides.
Transcript levels of CbEGS1, CbIGS1, and CbEGS2 were measured and found highest in petals, and no transcripts were found in leaves (Figure 4a).
Figure 4. Detection of CbIGS1, CbEGS1, CbEGS2, PhIGS1, and PhEGS1 transcripts in different organs by qRT-PCR and northern blot.
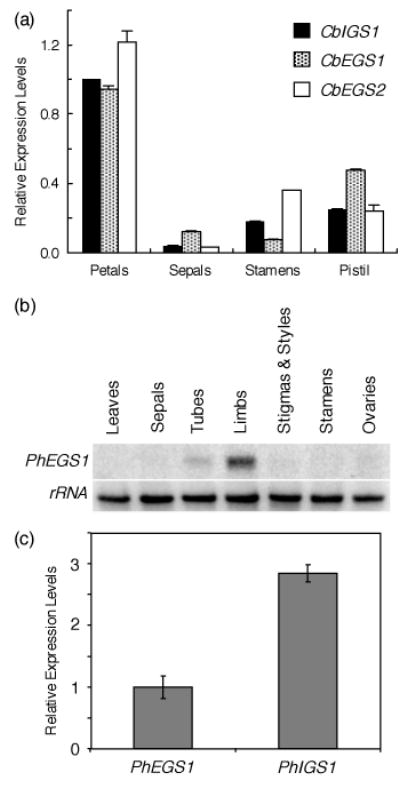
(a) CbIGS1, CbEGS1, and CbEGS2 transcript levels from different floral organs at 1 day pre-anthesis (when mRNA levels of these genes are highest). Each graph represents the average of three replications for two independent experiments using two biological samples. Bars indicate SE.
(b) Tissue specificity of PhEGS1 mRNA. Shown is a representative RNA gel blot of total RNA (5 μg per lane), isolated from leaves and different organs of 2-day-old petunia flowers, probed with PhEGS1 (top). The blot was rehybridized with an 18S rDNA probe (bottom) to ascertain equal loading of RNA.
(c) The relative PhIGS1 and PhEGS1 mRNA levels in corollas of 2-day-old petunia flowers as determined by qRT-PCR. PhEGS1 expression was set as 1. Bars indicate SE.
Both CbEGS1 and CbIGS1 encode proteins of 318 amino acids with a calculated molecular mass of 36.0 kDa. When CbIGS1 and CbEGS1 were expressed in E. coli, the resulting (non-His-tagged) proteins co-migrated on SDS-PAGE with the 36 kDa protein from Figure 2, lane 1 (data not shown). CbEGS2 encodes a protein of 309 amino acids with a calculated mol. mass of 34.2 kDa. Expression of full-length, non-fusion cDNA of CbEGS2 in E. coli resulted in a protein co-migrating with the 38 kDa from Figure 2, lane 2 (data not shown). These results indicate that the characterized cDNAs of CbEGS1, CbIGS1, and CbEGS2 each contain the complete coding information for the respective proteins.
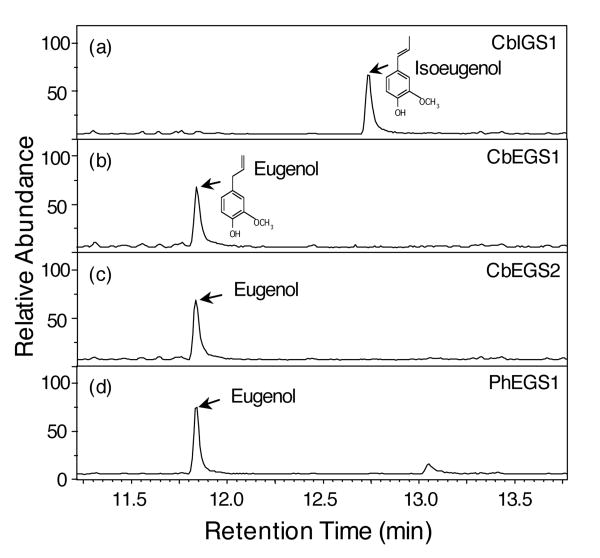
The full-length cDNAs of CbEGS1, CbIGS1, and CbEGS2 were expressed in E. coli to produce His-tagged CbEGS1, CbIGS1, and CbEGS2 proteins, which were then purified and assayed for activity with coniferyl acetate. The purified CbIGS1 enzyme catalyzed the formation of only isoeugenol (Figure 5a). The purified CbEGS1 and CbEGS2 proteins produced only eugenol (Figure 5b,c, respectively).
Figure 5. Product analysis of reactions catalyzed by CbIGS1, CbEGS1, CbEGS2, and PhEGS1 using coniferyl acetate as substrate.
Enzyme assays contained 0.5 mM coniferyl acetate, 1 mM NADPH, and 1 μg purified enzymes, and were incubated for 30 min at RT. Reaction products were analyzed by GC-MS. Relative abundance is shown in arbitrary units, based on Total Ion Current measurement.
(a) Reaction catalyzed by C. breweri IGS1.
(b) Reaction catalyzed by C. breweri EGS1.
(c) Reaction catalyzed by C. breweri EGS2.
(d) Reaction catalyzed by petunia EGS1.
Analysis of the evolutionary relatedness of CbEGS1, CbIGS1 and CbEGS2 to each other and to other PIP proteins
The CbEGS1 and CbIGS1 proteins are 95.9% identical to each other. A phylogenetic analysis based on the maximum likelihood method (Figure 3b) as well as other methods including neighbor-joining and maximum parsimony (not shown) all indicated that CbEGS1 and CbIGS1 are most closely related, among biochemically characterized proteins, to ObEGS1 (52% identity) as well as to PhIGS1 (51% identity) (Figure 3b). CbEGS2, however, is more closely related to several enzymes previously characterized (Gang et al., 1999) to have PCBER activity (Figure 3b). For example, it is 78% identical to Populus trichocarpa PCBER, but only 46% identical to CbEGS1 or CbIGS1.
Isolation of a petunia eugenol synthase 1 (PhEGS1) closely related to CbEGS2
Since petunia flowers emit small amounts of eugenol in addition to high levels of isoeugenol (eugenol levels are <3% those of isoeugenol, Verdonk et al., 2003), and the previously characterized PhIGS1 catalyzes the formation of isoeugenol but not eugenol, the origin of eugenol in petunia was not clear. A search of petunia flower EST databases (containing >3,000 ESTs) identified several cDNAs encoding a protein of 308 aa with 82.1% identity to CbEGS2 (Figure 3), but no other cDNAs encoding proteins with similarity to known IGS and EGS sequences. This 308 aa protein, designated as Petunia hybrida eugenol synthase 1 (PhEGS1), has only 47.7% amino acid identity to PhIGS1. Characterization of purified PhEGS1 produced in E. coli revealed that the protein catalyzes the formation of eugenol from coniferyl acetate (Figure 5d). PhEGS1 is expressed specifically in the scent-producing parts of the flowers (limbs and tube) but not in other parts of the flowers nor in leaves (Figure 4b). PhEGS1 transcript levels were app. 3-fold lower than those of PhIGS1 (Figure 4c).
Enzymatic properties of C. breweri IGS1, EGS1, and EGS2 and P. hybrida EGS1
The apparent Km values of CbIGS1, CbEGS1, and CbEGS2 for coniferyl acetate were 212±28 μM, 93±6 μM, and 311±45 μM, respectively (Table 3). The apparent kcat value of CbIGS1 was 0.99±0.13 per s and the corresponding values for CbEGS1 and CbEGS2 were 0.26±0.01 and 0.25±0.02 per s. Thus, the apparent catalytic efficiency (kcat/Km) of CbIGS1 is app. 2-fold higher than CbEGS1 and 6-fold higher than that of CbEGS2 (Table 3). PhEGS1 has a Km value for coniferyl acetate of 245 μM and a kcat of 0.60 per s, similar to the re-measured Km value for PhIGS1, but its turnover rate is two-fold lower than that of PhIGS1 (Table 3).
Table 3.
Kinetic parameters of C. breweri and P. hybrida EGS and IGS enzymes for coniferyl acetate
| Enzymes |
Km (μM) |
Vmax (nmol • s-1 • mg-1) |
kcat (s-1) |
kcat/Km (s-1 • mM-1) |
|---|---|---|---|---|
| CbIGS1 | 211.5 ± 27.9 | 27.6 ± 3.7 | 0.99 ± 0.13 | 4.7 |
| CbEGS1 | 93.3 ± 6.3 | 7.3 ± 0.2 | 0.26 ± 0.01 | 2.8 |
| CbEGS2 | 310.5 ± 45.2 | 6.9 ± 0.6 | 0.25 ± 0.02 | 0.8 |
| PhEGS1 | 245.3 ± 58.0 | 18.4 ± 1.6 | 0.60 ± 0.05 | 2.4 |
| PhIGS1 | 226.1 ± 70.3 | 35.7 ± 5.9 | 1.3 ± 0.2 | 5.7 |
Values are averages of three independent experiments, +/- SE.
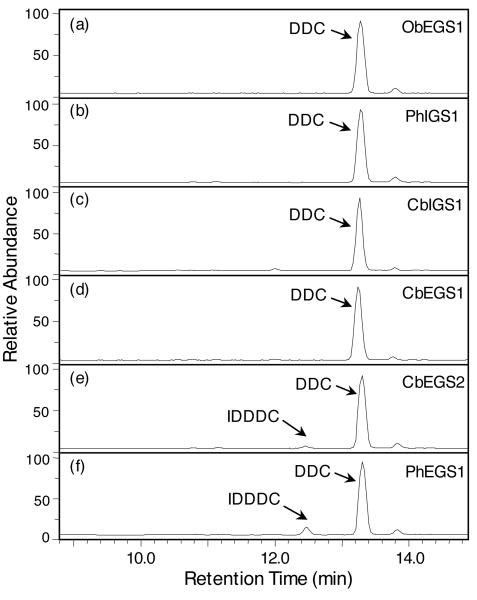
Because of the sequence similarity of CbEGS2 and PhEGS1 to proteins characterized as PCBER enzymes, we tested them as well as CbEGS1, CbIGS1, and the previously characterized ObEGS1 and PhIGS1 (Koeduka et al., 2006) for their ability to reduce the PCBER substrate dehydrodiconiferyl alcohol (DDC) to isodihydrodehydrodiconiferyl alcohol (IDDDC). No IDDDC product was detected in any of these reaction assays after 1 h. [In the control assays containing coniferyl acetate instead of DDC with the same amount of protein and carried out for 1 h, >35% of the substrate was converted to the product]. When the enzymatic assays using DDC as a substrate were carried out over longer time periods (>3 h) and with a 23-fold increase in protein concentration, ObEGS1, PhIGS1, CbIGS1, and CbEGS1 were still not able to reduce any DDC to IDDC (Figure 6a-d), however CbEGS2 and PhEGS1 catalyzed the formation of a small amount of IDDDC (Figure 6e,f) at the calculated rates of 6.7 and 24.4 nmol/h/mg protein, respectively. These rates compare with the rate of 53 and 104.2 nmol/h/mg protein reported for Populus trichocarpa and Pinus taeda PCBERs, respectively (Gang et al., 1999), but are app. 2,700-4,000-fold slower than the rates in which PhEGS1 and CbEGS2, respectively, catalyze the production of eugenol from coniferyl acetate (Table 3).
Figure 6.
Product analyses of reactions catalyzed by CbIGS1, CbEGS1, CbEGS2, PhEGS1, PhIGS1, and ObEGS1, using dehydrodihydroconiferyl alcohol as substrate. Enzyme assays contained 0.5 mM DDC, 1 mM NADPH, and 22.5 μg purified enzymes, and were incubated for 19 h. Reaction products were analyzed by LC. Relative abundance is shown in arbitrary units, based on absorbance at 279 nm. The small peak to the right of DDC, at 13.85 min, is a contaminant found in the substrate solution.
(a) Reaction catalyzed by ObEGS1.
(b) Reaction catalyzed by PhIGS1.
(c) Reaction catalyzed by CbIGS1.
(d) Reaction catalyzed by CbEGS1.
(e) Reaction catalyzed by CbEGS2.
(f) Reaction catalyzed by PhEGS1.
Amino acid residues in CbIGS1, CbEGS1, and other EGS and IGS proteins involved in determining product specificity
Sequence comparison of CbIGS1 and CbEGS1 show that they differ at only 13 positions, and nine of these positions reside in a small region between positions 73-95 (Figure 7). To identify the specific residues that determine their product specificity, we first produced a hybrid protein by fusing the first 95 codons of CbEGS1 with codons 96-318 of CbIGS1. This hybrid protein catalyzed the formation of mostly eugenol, with small proportion of isoeugenol (mutant 1 in Table 4) [The reciprocal hybrid protein, which was soluble and stable to a similar degree as the first hybrid protein, did not show any activity.] Since the result suggested that the product specificity mostly resides in region 73-95, site-directed mutagenesis of CbIGS1 was used to change individual residues or a cluster of residues in this region to the corresponding amino acids found in CbEGS1. Changing residues 83, 84, 87 and 88 (mutant 3) gave a protein with the highest ratio of eugenol/isoeugenol production, 85:15. Changing residues 73, 77, 83 and 84 (mutant 2) gave a product with 29:71% eugenol/isoeugenol ratio. In contrast, changing amino acids at positions 91, 92, and 95 (mutant 4) did not affect the product preference. These data suggested that residues at position 83, 84, 87, and 88, or at least some of them, affect the product discrimination significantly.
Figure 7. Divergence in EGS and IGS sequences.
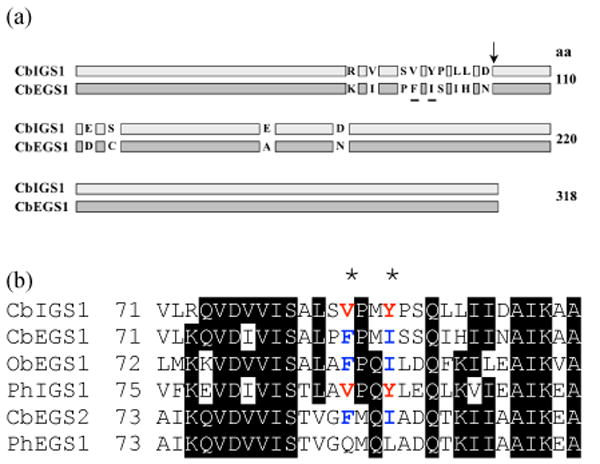
(a) Schematic representation of differences between CbIGS1 and CbEGS1. Amino acid residues shown to account for significant differences in product specificity are underlined. The position delineating the splice site in the construction of the hybrid proteins is marked with an arrow.
(b) Amino acid sequence alignments of phenylpropene synthases in a segment encompassing the highly divergence region between CbEGS1 and CbIGS1. The positions of the two amino acids found to account for most of the differences in product specificity are marked by asterisks, and the conserved V and Y in IGS enzymes and the conserved F and I in EGS enzymes at these positions are shown by red and blue, respectively.
Table 4.
The preferential product formation in EGS and IGS
| Species | Mutant No. | Mutation | Product proportions (EGS : IGS) |
|---|---|---|---|
| Clarkia | CbIGS1 | Wild type | 0:100 |
| 1* | R73K, V77I, S83P, V84F, Y87I, P88S, L91I, L92H, D95N | 76:24 | |
| 2 | R73K, V77I, S83P, V84F | 29:71 | |
| 3 | S83P, V84F, Y87I, P88S | 85:15 | |
| 4 | L91I, L92H, D95N | 0:100 | |
| 5 | S83P, V84F | 16:84 | |
| 6 | Y87I, P88S | 66:34 | |
| 7 | V84F, Y87I | 75:25 | |
| 8 | V84F | 39:61 | |
| 9 | Y87I | 62:38 | |
| CbEGS1 | Wild type | 100:0 | |
| 10 | F84V, I87Y | 31:69 | |
| CbEGS2 | Wild type | 100:0 | |
| 11 | F86V, I89Y | 88:12 | |
| Basil | ObEGS1 | Wild type | 100:0 |
| 12 | F85V, I88Y | 64:36 | |
| Petunia | PhIGS1 | Wild type | 0:100 |
| 13 | V88F, Y91I | 39:61 | |
| PhEGS1 | Wild type | 100:0 | |
| 14 | Q86V, L89Y | 81:19 |
Asterisk indicates the hybrid protein, CbEGS1/CbIGS1
To narrow down the contribution of these residues to product specificity, five additional mutants were generated (mutants 5-9 in Table 4). Among these mutants, mutant 7, in which residue V84 was changed to F and residue Y87 was changed to I, had a highest ratio of eugenol to isoeugenol formation, 75:25, followed by mutant 6 (66:34). Moreover, even the single substitution at position 87 produced a protein which catalyzed the formation of more eugenol than isoeugenol (62:38, mutant 9 in Table 4).
Affects of amino acid changes in CbIGS1 on the specific activity of the mutant enzymes
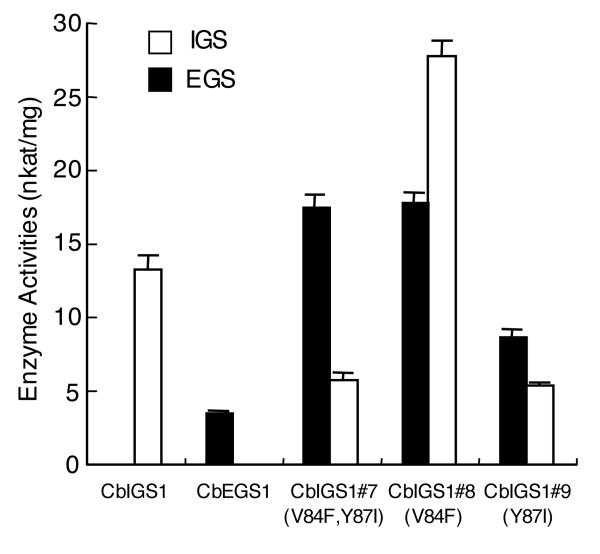
To determine how the amino acid changes described above affected the specific activity of the proteins, we measured this parameter in mutants 7, 8, and 9. Mutants 7 and 8 exhibited 1.8- and 3.4-fold higher total activity, respectively, compared with the wild type enzyme (Figure 8). In contrast, the change at position 87 (mutant 9, Y87I) had no significant effect on total specific activity of the protein (Figure 8), even though the amino acid at this position appears to contribute most to the product specificity (Table 4).
Figure 8. Specific activities of wild type and C. breweri IGS1 mutants.
Each value in the figure is an average of three independent experiments. Bars indicate SE.
Site-directed mutagenesis of CbEGS1, ObEGS1, PhIGS1, PhEGS1, and CbEGS2
Since positions 84 and 87 in CbIGS1 were identified as key positions determining product specificity, we examined the specific amino acids in the corresponding positions in the other EGS and IGS proteins identified in this and previous studies (Figure 7b; these positions are numbered slightly differently in each protein because of differences in upstream sequences, but for clarity the numbers referring to the CbIGS1 positions are used in the text to discuss comparisons). At position 84, both IGS enzymes (CbIGS1 and PhIGS1) have a V, while three EGS enzymes have F and one (PhEGS1) has Q. At position 87, both IGS proteins have Y, while three EGS proteins have I and one (again, PhEGS1) has L. The amino acids in these two positions in each protein were then changed to the corresponding residues in CbIGS1 (for EGS enzymes) or CbEGS1 (for PhIGS1). In each case, some change in product specificity, ranging from 12% to 69%, was observed (Table 4, mutants 10-14).
Discussion
C. breweri and P. hybrida have distinct synthases for eugenol and isoeugenol biosynthesis
Purification of eugenol and isoeugenol synthase activities from C. breweri flowers yielded three distinct proteins, two of which display only eugenol synthase activity and the third possessing only isoeugenol synthase activity. One of the C. breweri eugenol synthases identified in this approach of direct protein purification and characterization, CbEGS2, proved to be only distantly related to the previously characterized basil eugenol synthase and petunia isoeugenol synthase, and its sequence was used to identify a gene from petunia, PhEGS1, that encodes a eugenol synthase. All three newly characterized C. breweri enzymes and the new petunia eugenol synthase, as well as the previously characterized PhIGS1 and ObEGS1, use coniferyl acetate to make a single product – either eugenol or isoeugenol - and they have similar affinity to the substrate, although their catalytic efficiencies may differ by as much as 6-fold. The lower catalytic efficiency of PhEGS1 and its lower level of expression compared with PhIGS1 may explain the much lower levels of eugenol, as compared with isoeugenol, emitted from petunia flowers.
Few residues in EGS and IGS enzymes have major effect on product specificity
Our earlier crystallographic studies (Louie et al., 2007) of ObEGS1 in complex with an analog of coniferyl acetate, (7S,8S)-ethyl (7,8-methylene)-dihydroferulate (EMDF), clearly revealed the substrate-binding mode within the ObEGS active site (Figure 9a). The guaiacol ring is stacked against the nicotinamide ring of the cofactor, and the side chain, which in EMDF bears a cyclopropyl group and is distinctly kinked, is accommodated in a predominantly hydrophobic pocket at the top of the active-site pocket. Most notably, the coniferyl acetate substrate would be most appropriately positioned for acceptance at C7 of a hydride from the cofactor nicotinamide, consistent with the formation of the eugenol product (Figure 9a).
Figure 9. Views of the active sites of ObEGS1, ObEGS1 (F85V, I88Y), and the CbEGS1.
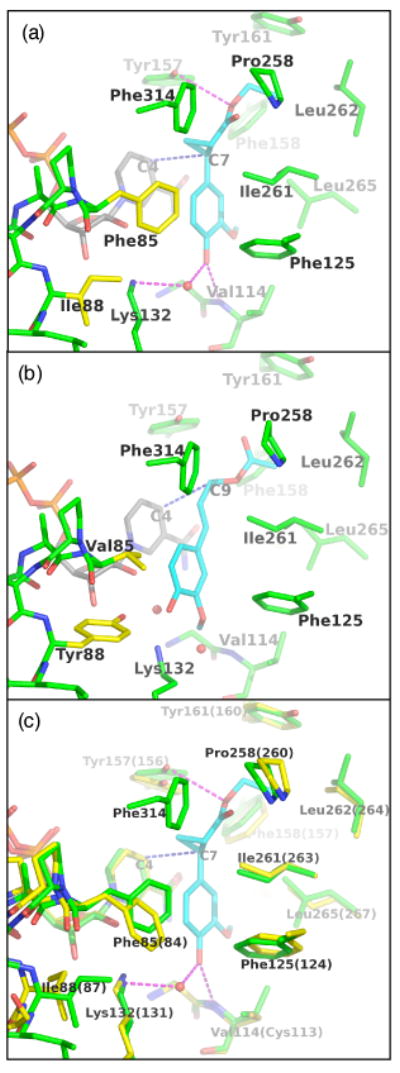
(a) ObEGS1 complexed with EMDF (Louie et al., 2007). Green - EGS active site residues; yellow - sites of amino-acid substitutions; gray - NADP+ cofactor; cyan - substrate.
(b) Crystal structure of ObEGS1 (F85V, I88Y) with modeled coniferyl acetate. The binding of the substrate was modeled manually based initially on the observed binding mode of EMDF with wild-type ObEGS1, and adjusted to fill the space vacated by F85 side chain and to form a hydrogen bond between Y88 and the substrate C4-OH. Color coding is as in (a).
(c) Comparison of the active sites of ObEGS1 (green) and CbEGS1 (yellow, residue numbering in parentheses) superimposed. EMDF is shown from the complex with ObEGS1.
The results from our in vitro mutagenesis experiments suggest that the residues at positions 84 and 87 in CbIGS1 and at the corresponding positions in the other EGS and IGS proteins in this study (Figure 7b) are major determinants of product specificity. Through a protocol identical to that used for the crystallographic analysis of wild-type ObEGS1 (Louie et al., 2007), we have now determined the structure of the ObEGS1 (F85V, I88Y) variant (mutant 12 in Table 4). This structure shows that the Y88 side chain projects into the base of the substrate-binding pocket (Figure 9b). The positioning of the Y88 side chain is assisted by the accompanying replacement of F85 by a residue bearing a smaller side chain, V. The bulky Y ring causes a slight displacement of neighboring residues within the active site, most notably the K132 side chain. The altered positioning of K132, the enlarged space arising from the loss of the bulky F85 side chain, and the introduction of an additional hydrogen bonding group (OH of Y88) that could interact with the C3 or C4 oxygen atoms of the substrate likely lead to a shift in the location of the substrate binding site, so that C9 is more appropriately positioned as the hydride acceptor, with the consequence that the altered enzyme produces a significant level (36%) of isoeugenol.
We have also elucidated the structure of the holoenzyme form of CbEGS1, without additional bound substrate or product analogs. The active sites of the CbEGS1 and ObEGS1 are shown to be nearly identical (Figure 9c). Therefore, for these two enzymes, equivalent amino-acid replacements would be expected to effect similar outcomes in product specificity, and in general, this prediction is borne out by the results of the mutagenesis experiments. Nevertheless, in comparison to the ObEGS1 (F85V, I88Y) variant, the corresponding CbEGS1 (F84V, I87Y) variant (mutant 10 in Table 4) produces a much greater proportion of isoeugenol (69% vs. 36%). In addition, the reciprocal changes in CbIGS1 (V84F, Y87I) produce more striking effects on product specificity (75% eugenol, mutant 7 in Table 4) than in petunia IGS (39% eugenol). A detailed understanding of the greater effect of these amino acid replacements on C. breweri EGS1 and IGS1, which are not apparent through modeling, must await structural analysis of these enzymes in complex with substrate, product(s), or analog.
The observations that changes of just a few residues can lead to new substrate or product specificity are also consistent with what has been found in other families of enzymes involved in specialized metabolism (Pichersky et al., 2006), for example the terpene synthase family, which also consists of several groups of enzymes that, within each group, use the same substrate but produce a different product (and, sometimes, multiple products from this same substrate).
Evolution of enzymatic function in the PIP reductase family
The previously identified petunia PhIGS1 and basil ObEGS1 were shown to be members of the PIP family of reductases, which also includes isoflavone reductase (IFR), pinoresinol-lariciresinol reductase (PLR), phenylcoumaran benzylic ether reductase (PCBER), pterocarpan reductase (PTR), and leucoanthocyanidin reductase (LAR) (Figure 3b). Our phylogenetic analyses indicate with high degree of certainty that PhIGS1 and ObEGS1 fall into close but separate clades, and that CbEGS2 and PhEGS1, on the other hand, are closely related to a complex clade that contains proteins biochemically characterized to possess PCBER, IFR, and PTR activities.
The highly similar CbIGS1 and CbEGS1 (96% identity) both fall into the same clade with ObEGS1. The basal position of ObEGS1 in this clade suggests that the ancestor of CbIGS1 and CbEGS1 had eugenol synthase activity. However, since no other protein in this clade besides these three proteins has been biochemically characterized, such a conclusion is tentative. However, it is clear that the function of these two proteins diverged recently, and thus the origin of the isoeugenol synthase activity of CbIGS1 evolved independently of PhIGS1 (alternatively, if the ancestral protein in this clade had isoeugenol synthase activity, then the eugenol synthase activity of CbEGS1 evolved independently of ObEGS1).
Surprisingly, the CbEGS2 and PhEGS1 proteins fall in a clade in which proteins characterized to have PCBER activity as well as IFR and PTR enzymes also reside (Figure 3b). In this clade, the branching of IFR enzymes and the single PTR enzyme presently known, all from legumes, is uncertain: in the neighbor joining tree the position of these two branches is reversed relative to each other, and in the maximum parsimony tree (legend to Figure 3b), all these four sequences are monophyletic. However, in all of these trees the gymnospermous PCBER sequences (PtdPCBER from Pinus taeda and ThPCBER from Thuja plicata) constitute an outgroup to the IFRs, PTR, the angiospermous PCBER sequences (PtPCBER from Populus trichocarpa and FiPCBER from Forsythia intermedia), and CbEGS2 and PhEGS1.
Gang et al. (1999), in their original report on the characterization of PCBER enzymes, pointed out that the Pinus taeda and Populus trichocarpa PCBER enzymes (the only PCBER enzyme for which Vmax values have been reported) have an extremely low turnover rate with DDC that “cannot be explained at the present time”. They showed that they could not reduce pinoresinol, but, understandably, they did not test these enzymes with coniferyl acetate as eugenol and isoeugenol synthases and their substrate were not known at the time. We show here that CbEGS2 and PhEGS1 also have very low turnover rates for the reduction of DDC that are comparable to that of P. trichocarpa and P. taeda PCBER enzymes. On the other hand, CbEGS2 and PhEGS1 each have a turnover rate for coniferyl acetate that is several thousand-fold higher than their rates with DDC and similar to the turnover rates of CbEGS1, CbIGS1, ObEGS1 and PhIGS1 with coniferyl acetate. These results indicate that CbEGS2 and PhEGS1 are bona fide eugenol synthases, and they further suggest that the sequences currently characterized as PCBER enzymes, as well as other sequences in this branch, might in fact prefer coniferyl acetate or other related substrates to DDC. While writing this report, Vassão et al. (2007) reported that a PCBER-related protein (despite their title, the protein investigated was more similar to PCBER than to PLR) in the creosote bush (Larrea tridentate) is capable of synthesizing phenylpropenes from esters of alcohols of lignin precursors. However, this activity was not linked to specific phenylpropenes in the plant, nor was the PCBER activity of this protein examined.
Whether the ancestral protein of this clade was a bona fide eugenol synthase that used coniferyl acetate or another type of enzyme, and what are the biochemical activities of the many other uncharacterized proteins in this clade (deduced from ESTs and representing a wide variety of plant species) are intriguing questions that will require additional studies to resolve. However, the phylogenetic analysis suggests that the protein that was ancestral to this clade as well as to the LAR and PLR clades was unlikely to be a eugenol/isoeugenol synthase. It thus appears likely that phenylpropene synthases have evolved independently at least twice during plant evolution. A less likely scenario is that the ancestor of the entire family possessed phenylpropene synthase activity, in which case it appears that the phenylpropene synthases eventually evolved for unknown reasons into two distinct lineages.
Koeduka et al. (2006) have presented indirect evidence that ObEGS1 and PhIGS1 use a quinone methide intermediate-based mechanism to generate an intermediate to which the reductive transfer of the reducing hydride can then be easily accomplished, and Akashi et al. (2006) have proposed that some other PIP enzymes may also use the same mechanism on substrates that, like coniferyl acetate, contain a para-hydroxybenzyl moiety. The recent structure-function studies utilizing the crystal structure of basil eugenol synthase indeed support this hypothesis (Louie et al., 2007). Thus, the potential to generate a quinone-methide intermediate with a variety of substrates that share a para-hydroxybenzyl moiety appears to underlie the basis for the multiple types of substrates that the PIP family enzymes have evolved to handle. In addition to the previously demonstrated diversity of the PIP family, we now show here that the same product specificity, and most likely the same substrate specificity, have evolved independently more than once. Overall, these results highlight the strong potential for evolution of new functions inherent in this family.
Experimental procedures
Plant materials and growth condition
C. breweri were grown as described in Raguso and Pichersky (1995). Petunia hybrida cv Mitchell (Ball Seed, West Chicago) plants were grown in the greenhouse with a 16 h light period (supplemented to 100 μmol·m-2.s-1) and temperature of 21 °C, and an 8 h dark period at 16 °C.
Chemicals and Substrates
Chemicals were from Sigma-Aldrich unless noted. Coniferyl acetate was synthesized as previously described (Koeduka et al., 2006). Dehydrodiconiferyl alcohol was synthesized and verified according to Gang et al. (1999).
Enzyme assays
EGS and IGS enzymatic reactions were performed and products were analyzed as previously described (Koeduka et al., 2006), except that a temperature gradient from 50°C to 275°C at 14°C min−1 was applied during GC-MS. For PCBER enzymatic assays, we used identical conditions to the one employed for EGS/IGS assays, except that the substrate DDC was used instead of coniferyl acetate. The product of the reaction was identified by the published retention value (Gang et al., 1999) and by its UV absorption spectrum.
Protein purification
All manipulations were carried out at 4°C unless stated otherwise. Crude extract (50 ml, representing 5.0 g fresh weight petal tissue) was loaded onto a DEAE-cellulose column (8 ml of DE53, Whatman, Fairfield, NJ) that was pre-equilibrated with a solution containing 25 mM Bis-Tris, pH 7.0, and 1 mM DTT (buffer A). After a wash with 20 ml of buffer A, IGS and EGS activities were eluted with 20 ml of buffer A containing 200 mM KCl. Fractions with the highest IGS and EGS activities (which co-eluted) were pooled and loaded on a Hitrap-Phenyl HP column (0.7 × 2.5 cm, Pharmacia Biotech Inc.) pre-equilibrated with 1 M (NH3)2SO4 in buffer A at a flow rate of 0.5 ml/min. After washing with 5 ml of 1 M (NH3)2SO4 in buffer A, the activities were eluted with a linear reverse gradient (15 ml) from 1 M (NH3)2SO4 in buffer A to 0 M (NH3)2SO4 in buffer A followed by an additional 15 ml of buffer A. Fractions containing peak IGS activity and the first peak of EGS activity (which co-eluted) were pooled (total 6.75 ml) and loaded onto Hitrap-Q HP column (0.7 × 2.5 cm, Pharmacia Biotech Inc.) previously equilibrated with buffer A, followed by a wash with 5 ml of buffer A and then IGS and EGS activities were eluted with 20 ml linear gradient (0-400 mM) of KCl in buffer A at flow rate of 0.5 ml/min. Fractions containing the second peak of EGS activity from the Hitrap-Phenyl HP column were pooled and similarly loaded onto a second Hitrap-Q HP column and the column treated similarly.
Protein sequencing
The 36 kDa protein band (Figure 2, lane 1) was eluted from the gel, trypsinized, and subjected to LC-MS/MS analysis as previously described (Chen et al., 2005), followed by searching the C. breweri flower EST database using the program MASCOT (Perkins et al., 1999). Seven unique peptides obtained from this 36 kDa protein band [RSMGVTIIEGEMEEHEKM, KFVLNYEEDIAKY, RIVIYRPPKN, KSGLSFKK, KVHMPDEQLVRL, RLSQELPQPQNIPVSILHSIFVKG, RKDDIEASNLYPELEFTSIDGLLDLFISGRA] matched the two closely related protein sequences encoded CbEGS1 and CbIGS1 (see Results) at a significance threshold of 0.001. At this stringency no peptides hits were found in a randomized database of the same size and amino acid composition suggesting a very low false positive rate. The single protein of app. mol. Mass of 38 kDa in the peak EGS activity eluting from the second Hitrap-Q column (Figure 2, lane 2) was analyzed in the same way, and 11 peptide sequences obtained from it [KILIIGGTGYIGKF, KFIVEASVKE, KEGHPTFALVRE, RETTVSDPVKGKL, KFQNLGVSLLYGDLYDHDSLVKA, KQVDVVISTVGFMQIADQTKI, KIIAAIKE, KEAGNVKRF, KRFFPSEFGNDVDHVNAVEPAKS, KSVAFAVKA, RDKVIIPGDGNPKA] matched the protein sequence encoded by CbEGS2 (Figure 3a).
qRT-PCR
Total RNA was isolated from C. breweri as previously described (Dudareva et al., 1996) and from petunia as described by Boatright et al. (2004). For qRT-PCR, first-strand cDNA synthesis and qPCR reactions with gene-specific primers (Supplementary Table 1) were performed as previously described (Varbanova et al., 2007).
Isolation, characterization, and expression in E. coli of C. breweri cDNAs encoding proteins with IGS and EGS activities
As described in Results, a 5′RACE experiment (Chenchik et al., 1996; Matz et al., 1999) was performed, using internal primers (Supplementary Table 1), to obtain the complete sequence of CbIGS1. To construct E. coli expression vectors, full-length cDNAs were amplified by RT-PCR from flower RNA with forward and reverse primers (Supplementary Table 1), the PCR fragments were spliced into pENTR (Invitrogen, Inc.), and analyzed by sequencing and the cDNA fragment transferred to the expression vector pHIS9, a modified pET/T7 vector (Varbanova et al., 2007), to give an N-terminal in-frame addition of a peptide containing 9 His residues. Expression in E. coli (BL21-CodonPlus-RIL) and DEAE and His-tag affinity purification of the proteins were performed as previously described (Koeduka et al., 2006; Nishimoto et al., 2007). CbEGS1, CbIGS1, and CbEGS2 were also amplified and spliced directly into the E. coli expression vector pEXP5-CT/TOPO (Invitrogen, Inc.) for production of non-fused, non-tagged proteins.
In vitro mutagenesis
EGS and IGS mutants were constructed in the pEXP5-CT/TOPO TA Expression vector (Invitrogen, Inc.) with the PCR method (Ho et al., 1989). The mutagenic primers for each mutation were designed in complementary pairs (Supplementary Table 1). Mutations were confirmed by sequencing both strands.
Structural studies
Crystals of the ObEGS1 (F85V, I88Y) variant were obtained using the same protocol previously employed for wild-type ObEGS1 (Louie et al., 2007). Structure determination of the ObEGS1 variant was initiated with the isomorphous, orthorhombic crystal structure of wild-type ObEGS1 (PDB entry 2QX7), and yielded a refined atomic model at a resolution of 2.15 Å with a crystallographic R-factor of 0.261 (free R 0.292). Crystals of CbEGS1 were grown from solutions of the protein mixed with 0.1 M sodium citrate (pH 5.4), 20% (v/v) isopropanol, 20% (w/v) polyethylene glycol 4000, and 5 mM NADP+. These crystals belong to space group C2 with unit-cell parameters a=67.3 Å, b=87.4 Å, c=51.5 Å, and β=101.3. The initial structure solution of CbEGS1 was obtained by molecular replacement with a homology model constructed from ObEGS1. The atomic model of CbEGS1 was refined against X-ray data to 1.8 Å resolution with a crystallographic R-factor of 0.188 (free R 0.217). All crystallographic procedures employed were as described previously (Louie et al., 2007). X-ray diffraction data were measured at beamline 8.2.2 of the Advanced Light Source (Lawrence Berkeley National Laboratory). The atomic coordinates and structure factors were deposited in the Protein Data Bank under PDB accession codes XXXX (ObEGS1 [F85V, I88Y]) and XXXX (wild-type CbEGS1).
Phylogenetic analyses
Multiple alignments of 32 PIP protein sequences were constructed using the MUSCLE (Edgar, 2004) program. Alignment columns containing more than 16 gap characters were removed prior to tree reconstruction. Sequence distance matrix was constructed using the PROTDIST program of the PHYLIP package (Felsenstein, 1996) with Jones-Taylor-Thornton evolutionary model (Jones et al., 1992). Neighbor-Joining and Least Squares trees were constructed using the NEIGHBOR and FITCH programs of the PHYLIP package respectively. Maximum parsimony tree was constructed using the PROTPARS program of the PHYLIP package. Maximum likelihood tree was constructed using the ProtML program of the MOLPHY package (Hasegawa et al., 1991) by optimizing the least-squares tree with local rearrangements (Jones-Taylor-Thornton evolutionary model with adjustment for observed amino acid frequencies). Reliability of the internal branches was estimated using 10000 RELL bootstrap replications using the ProtML program of the MOLPHY package.
Supplementary Material
Acknowledgments
We thank Dr. Yuri I. Wolf (Associate Investigator, NCBI/NLM/NIH) for performing the phylogenetic analyses. This work was supported by National Science Foundation grants 0331353, 0312466, and 0718152 to E.P., by National Science Foundation grant 0718064 to J.N.P., by National Research Initiative of the U.S. Department of Agriculture Cooperative State Research, Education, and Extension Service grant 2005-35318-16207 and National Science Foundation/USDA-NRI Interagency Metabolic Engineering Program grant 0331333 to N.D., and by a grant from the Fred Gloeckner Foundation, Inc to N.D.
Footnotes
References
- Akashi T, Koshimizu S, Aoki T, Ayabe S. Identification of cDNAs encoding pterocarpan reductase involved in isoflavan phytoalexin biosynthesis in Lotus japonicus by EST mining. FEBS Lett. 2006;580:5666–5670. doi: 10.1016/j.febslet.2006.09.016. [DOI] [PubMed] [Google Scholar]
- Boatright J, Negre F, Chen X, et al. Understanding in vivo benzenoid metabolism in petunia petal tissue. Plant Physiol. 2004;135:1993–2011. doi: 10.1104/pp.104.045468. [DOI] [PMC free article] [PubMed] [Google Scholar]
- Chen H, Wilkerson CG, Kuchar JA, et al. Jasmonate-inducible plant enzymes degrade essential amino acids in the herbivore midgut. Proc Natl Acad Sci USA. 2005;102:19237–19242. doi: 10.1073/pnas.0509026102. [DOI] [PMC free article] [PubMed] [Google Scholar]
- Chenchik A, Zhu Y, Diatchenko L, et al. Generation and use of high-quality cDNA from small amounts of total RNA by SMART PCR. In: Siebert P, Larrick J, editors. RT-PCR methods for gene cloning and analysis. Westborough, MA: BioTechniques Books; 1996. pp. 305–319. [Google Scholar]
- D'Auria JC, Chen F, Pichersky E. Characterization of an acyltransferase capable of synthesizing benzylbenzoate and other volatile esters in flowers and damaged leaves of Clarkia breweri. Plant Physiol. 2002;130:466–476. doi: 10.1104/pp.006460. [DOI] [PMC free article] [PubMed] [Google Scholar]
- Dudareva N, Cseke L, Blanc VM, Pichersky E. Evolution of floral scent in Clarkia: novel patterns of S-linalool synthase gene expression in the C. breweri flower. Plant Cell. 1996;8:1137–1148. doi: 10.1105/tpc.8.7.1137. [DOI] [PMC free article] [PubMed] [Google Scholar]
- Edgar RC. MUSCLE: multiple sequence alignment with high accuracy and high throughput. Nucleic Acids Res. 2004;32:1792–1797. doi: 10.1093/nar/gkh340. [DOI] [PMC free article] [PubMed] [Google Scholar]
- Felsenstein J. Inferring phylogenies from protein sequences by parsimony, distance, and likelihood methods. Methods Enzymol. 1996;266:418–427. doi: 10.1016/s0076-6879(96)66026-1. [DOI] [PubMed] [Google Scholar]
- Gang DR, Kasahara H, Xia ZQ, et al. Evolution of plant defense mechanisms. Relationships of phenylcoumaran benzylic ether reductases to pinoresinol-lariciresinol and isoflavone reductases. J Biol Chem. 1999;274:7516–7527. doi: 10.1074/jbc.274.11.7516. [DOI] [PubMed] [Google Scholar]
- Gang DR, Wang J, Dudareva N. An investigation of the storage and biosynthesis of phenylpropenes in sweet basil. Plant Physiol. 2001;125:539–555. doi: 10.1104/pp.125.2.539. [DOI] [PMC free article] [PubMed] [Google Scholar]
- Grossman J. Botanical pesticides in Africa. Int Pest Manag Pract. 1993;15:1–9. [Google Scholar]
- Hasegawa M, Kishino H, Saitou N. On the maximum likelihood method in molecular phylogenetics. J Mol Evol. 1991;32:443–445. doi: 10.1007/BF02101285. [DOI] [PubMed] [Google Scholar]
- Ho SN, Hunt HD, Horton RM, et al. Site-directed mutagenesis by overlap extension using the polymerase chain reaction. Gene. 1989;77:51–59. doi: 10.1016/0378-1119(89)90358-2. [DOI] [PubMed] [Google Scholar]
- Jones T, Taylor WR, Thornton JM. The rapid generation of mutation data matrices from protein sequences. CABIOS. 1992;8:275–282. doi: 10.1093/bioinformatics/8.3.275. [DOI] [PubMed] [Google Scholar]
- Koeduka T, Fridman E, Gang DR, et al. Eugenol and isoeugenol, characteristic aromatic constituents of spices, are biosynthesized via reduction of coniferyl alcohol esters. Proc Natl Acad Sci USA. 2006;103:10128–10133. doi: 10.1073/pnas.0603732103. [DOI] [PMC free article] [PubMed] [Google Scholar]
- Louie GV, Baiga TJ, Bowman ME, Koeduka T, et al. Structure and reaction mechanism of basil eugenol synthase. PloS One. 2007;2:e993. doi: 10.1371/journal.pone.0000993. [DOI] [PMC free article] [PubMed] [Google Scholar]
- Matz M, Lukyanov S, Bogdanova E, et al. Amplification of cDNA ends based on template-switching effect and step-out PCR. Nucleic Acids Res. 1999;27:1558–1560. doi: 10.1093/nar/27.6.1558. [DOI] [PMC free article] [PubMed] [Google Scholar]
- Min T, Kasahara H, Bedgar DL, et al. Crystal structures of pinoresinol-lariciresinol and phenylcoumaran benzylic ether reductases and their relationship to isoflavone reductases. J Biol Chem. 2003;278:50714–50723. doi: 10.1074/jbc.M308493200. [DOI] [PubMed] [Google Scholar]
- Nishimoto M, Fushinobu S, Miyanaga A, et al. Molecular anatomy of the alkaliphilic xylanase from Bacillus halodurans C-125. J Biochem. 2007;5:709–717. doi: 10.1093/jb/mvm072. [DOI] [PubMed] [Google Scholar]
- Obeng-Ofori D, Reichmuth C. Bioactivity of eugenol, a major component of essential oil of Ocimum suave (Wild.) against four species of stored-product Coleoptera. Int J Pest Manage. 1997;43:89–94. [Google Scholar]
- Perkins DN, Pappin DJ, Creasy DM, Cottrell JS. Probability-based protein identification by searching sequence databases using mass spectrometry data. Electrophoresis. 1999;20:3551–3567. doi: 10.1002/(SICI)1522-2683(19991201)20:18<3551::AID-ELPS3551>3.0.CO;2-2. [DOI] [PubMed] [Google Scholar]
- Pichersky E, Raguso RA, Lewinsohn E, Croteau R. Floral scent production in Clarkia (Onagraceae) I. Localization and developmental modulation of monoterpene emission and linalool synthase activity. Plant Physiol. 1994;106:1533–1540. doi: 10.1104/pp.106.4.1533. [DOI] [PMC free article] [PubMed] [Google Scholar]
- Pichersky E, Noel JP, Dudareva N. Biosynthesis of plant volatiles: nature's diversity and ingenuity. Science. 2006;311:808–811. doi: 10.1126/science.1118510. [DOI] [PMC free article] [PubMed] [Google Scholar]
- Prasad NS, Raghavendra R, Lokesh BR, Naidu KA. Spice phenolics inhibit human PMNL 5-lipoxygenase. Prostaglandins Leukot Essent Fatty Acids. 2004;70:521–528. doi: 10.1016/j.plefa.2003.11.006. [DOI] [PubMed] [Google Scholar]
- Raguso RA, Pichersky E. Floral volatiles from Clarkia breweri and C. concinna (Onagraceae): recent evolution of floral scent and moth pollination. Plant Syst Evol. 1995;194:55–67. [Google Scholar]
- Tanner GJ, Francki KT, Abrahams S, et al. Proanthocyanidin biosynthesis in plants. Purification of legume leucoanthocyanidin reductase and molecular cloning of its cDNA. J Biol Chem. 2003;278:31647–31656. doi: 10.1074/jbc.M302783200. [DOI] [PubMed] [Google Scholar]
- Varbanova M, Yamaguchi S, Yang Y, et al. Methylation of gibberellins by Arabidopsis GAMT1 and GAMT2. Plant Cell. 2007;19:32–45. doi: 10.1105/tpc.106.044602. [DOI] [PMC free article] [PubMed] [Google Scholar]
- Vassão DG, Kim SJ, Milhollan JK, et al. A pinoresinol-lariciresinol reductase homologue from the creosote bush (Larrea tridentata) catalyzes the efficient in vitro conversion of p-coumaryl/coniferyl alcohol esters into the allylphenols chavicol/eugenol, but not the propenylphenols p-anol/isoeugenol. Arch Biochem Biophys. 2007;465:209–218. doi: 10.1016/j.abb.2007.06.002. [DOI] [PubMed] [Google Scholar]
- Verdonk JC, Ric de Vos CH, Verhoeven HA, et al. Regulation of floral scent production in petunia revealed by targeted metabolomics. Phytochemistry. 2003;62:997–1008. doi: 10.1016/s0031-9422(02)00707-0. [DOI] [PubMed] [Google Scholar]
- Wang J, Dudareva N, Bhakta S, Raguso RA, Pichersky E. Floral scent production in Clarkia breweri (Onagraceae). II. Localization and developmental modulation of the enzyme S-adenosyl-L-methionine:(iso)eugenol O-methyltransferase and phenylpropanoid emission. Plant Physiol. 1997;114:213–221. doi: 10.1104/pp.114.1.213. [DOI] [PMC free article] [PubMed] [Google Scholar]
Associated Data
This section collects any data citations, data availability statements, or supplementary materials included in this article.


