Abstract
We present the results of an automated analysis of the morphometry of the pulmonary airway trees of the Sprague Dawley rat. Our work is motivated by a need to inform lower-dimensional mathematical models in order to prescribe realistic boundary conditions for multiscale hybrid models of rat lung mechanics. Silicone casts were made from three age-matched, male Sprague Dawley rats, immersed in a gel containing a contrast agent and subsequently imaged with magnetic resonance (MR). From a segmentation of this data, we extracted a connected graph, representing the airway centerline. Segment statistics (lengths and diameters) were derived from this graph. To validate this MR imaging/digital analysis method, airway segment measurements were compared to nearly one thousand measurements collected by hand using an optical microscope from one of the rat lung casts. To evaluate the reproducibility of the MR imaging/digital analysis method, two lung casts were each imaged three times with randomized orientations in the MR bore. Diameters and lengths of randomly selected airways were compared among each of the repeated imaging datasets to estimate the variability. Finally, we analyzed the morphometry of the airway tree by assembling individual airway segments into structures that span multiple generations, which we call branches. We show that branches not segments are the fundamental repeating unit in the rat lung and develop simple mathematical relationships describing these structures for the entire lung. Our analysis shows that airway diameters and lengths have both a deterministic and stochastic character.
Introduction
The rat has been extensively used as an animal model for respiratory disease and environmental health effects (Mautz et al., 2001; Moss and Wong, 2006; Sydlik et al., 2006). Extrapolation of results from these studies to humans, however, requires an understanding of the relative contribution of each species particular anatomic as well as physiological differences in determining site-specific doses of an environmental or therapeutic agent, whether it is a gas, vapor or aerosol. A quantitative description of the rat lung morphometry is therefore foundational to the development of mathematical models of gas-exchange and particle deposition in the rat, and forms the basis for realistic boundary conditions for computational models of rat lung mechanics that impacts both regional and localized airflows. A morphometric analysis across animals can also define a distribution of important morphometric parameters within a species and thus help to define a ‘normative’ animal upon which to base generalizations of experimental and computational findings. In addition, many histological studies of respiratory disease have been performed in the rat which could be usefully organized within a comprehensive framework for rat lung morphometry that relates specific cell types or lesions with their relative position in the airway-an important consideration when attempting to extrapolate results from the rat to other species, including humans.
The descriptive and quantitative morphometry of mammalian conducting airways, including that of rodents, has been the focus of much past research (Weibel, 1963, 1970; Horsfield et al., 1971; Raabe et al., 1976; Fredberg and Hoenig, 1978; Phalen et al., 1978; Horsfield and Woldenberg, 1986; Rodriguez et al., 1987; Haefeli-Bleuer and Weibel, 1988; Fredberg, 1989; Menache et al., 1991; Kitaoka and Suki, 1997; Kitaoka et al., 1999; Oldham and Phalen, 2002; Palagyi et al., 2003; Mauroy et al., 2004; Wang and Kraman, 2004; Chaturvedi and Lee, 2005; Palagyi et al., 2006). Among these, idealized descriptions of the bronchial tree, the most notable due to Wiebel (Weibel, 1963) and Horsfield (Horsfield et al., 1971; Horsfield and Woldenberg, 1986), are commonly referenced because of their simplicity but are inadequate when branching asymmetry and the spatial distribution of airways cannot be neglected, as is the case in the monopodial rat lung. One of the first comprehensive, quantitative descriptions of pulmonary airway architecture in a rat was derived from a lung cast of a female Long Evans rat (Raabe et al., 1976). The tabulated data from this study - painstakingly collected - included length, diameter, branching angle and gravity angle in addition to a unique binary label for each branch. Due primarily to the challenge of collecting this type of data by hand, no studies have been published that address variability of measurement in the same animal, or the variability between animals of the same age, strain or species. Thus, most quantitative models of airflow in the lung or gas, vapor or particle dosimetry rely upon this particular dataset and a handful of others like it even when modeling different ages, gender or strain of rat.
For example, a stochastic branching design for the bronchial tree based on the relationship between flow and diameter has been proposed and evaluated with reference to this dataset (Kitaoka and Suki, 1997; Kitaoka et al., 1999). This relationship was based on the early work of Murray (Murray, 1926b, 1926a), which has been extensively exploited in similar morphometric descriptions of the arterial system, e.g. (Kassab, 2006). This approach assumes that the flow split at a branch point is a random variable related to diameter, and that the cumulative probability distribution function of flow is proportional to the inverse of flow through a given branch, and further that the cumulative probability distribution function of diameters is proportional to the inverse of a branch diameter. While the relationship was found to be in good accordance with the single available morphometric dataset, it is more representative than predictive. For example, the standard deviation of the exponent relating flow and diameter was found to be quite large. Reconstructions based on this approach further assumed that terminal branches were homogeneously distributed (Kitaoka et al., 1999), which does not apply in the rat.
Preliminary to any morphometric analysis is the task of determining airway statistics, such as airway lengths and diameters. In the last decade this task has been considerably streamlined through the application of image processing and computational geometry to digital images produced by magnetic resonance (MR) and computed tomography (CT) scanners. Many studies have focused on this aspect of airway morphometry, and have as a result made a significant contribution to our understanding of mammalian airway anatomy (Palagyi et al., 2003; Chaturvedi and Lee, 2005; Tschirren et al., 2005a, 2005b; Tschirren et al., 2005c; Zhang et al., 2005; Palagyi et al., 2006). Few studies have examined methods for determining these automated measurements in the rodent (Chaturvedi and Lee, 2005), and to date none have examined a population of rodents no matter how small to begin to assess variability between animals or the reproducibility of the digital measurements.
In addition the shear number of airways and small size, one of the difficulties in quantifying the rat bronchial architecture is that, unlike the idealized models of Weibel and Horsfield, and unlike the bipodial branching network of the human bronchial tree, the definitions of branch and generation are not straightforward. Typically, a branch is defined as an airway segment between two bifurcations, and a generation is the inclusive number of branches between a given branch and the trachea. The monopodial rat airways are asymmetric, with branches laterally arising from a central trunk in a repeatable, self-similar fashion. Wang and Kramen (Wang and Kraman, 2004) recently recognized the fractal nature of this relationship in a canine monopodial lung and derived a novel definition of branch and generation, wherein a branch was defined as a central trunk and a generation was defined as an increment of a central trunk with respect to the trachea. Based on these definitions they derived a relationship between the logarithm of the diameter and the logarithm of a generation.
Parallel work has been ongoing in the study of arterial geometry. Among the many contributions to this field, we mention the work of Karau (Karau et al., 2001) and related studies (Molthen et al., 2004) because they are closest in perspective to our own, and because they examine the pulmonary arterial tree of the Sprague-Dawley rat, whose geometry somewhat mirrors that of the pulmonary airway tree – the focus of our studies. The approach is based on the concept of “self-consistency” (Fredberg and Hoenig, 1978; Fredberg, 1989). These studies eschew the concept of a generation and instead focus on the so-called “principle pathways” of the arterial network. Given this definition they focus on geometric relationships between both the number and the diameter of side branches and the path length down a principle path that they subtend. These relationships are remarkably similar at all measured scales. A very attractive feature of self-consistency, so defined, is that the entire tree can be fully characterized by measuring the dimensions of only the main-pathway and its sub-branches. This latter feature of self-consistency lends itself to our specific modeling goals because it establishes a framework for predicting the downstream tree from morphometric data specific to a given airway. This framework stands in contrast to other important efforts to characterize rat lung morphometry as a whole (Weibel, 1963; Horsfield et al., 1971; Phalen et al., 1978; Haefeli-Bleuer and Weibel, 1988; Kitaoka and Suki, 1997; Mauroy et al., 2004; Majumdar et al., 2005).
In this study, we present the results of an automated morphometric analysis of three silicone pulmonary airway casts of age-matched, male Sprague-Dawley rats based on this concept of self-similarity. The morphometric framework presented enables comparisons among animals and predictions of distal lung morphometry below the resolution of the magnetic resonance data. To establish confidence in the analysis, airway statistics are compared against nearly a thousand manual measurements from a single cast and from repeated imaging and automated digital analysis of the same casts. In addition, we discuss how this analysis can be applied to studies of airway variability and can form a basis for defining realistic boundary conditions for three-dimensional multiscale airflow, gas exchange and aerosol deposition models of the rat lung that can be useful in improving human health risk assessments based upon toxicity studies in the rat or in developing pulmonary drug delivery approaches using the rat as a model system.
Methods
Animals
Specific-pathogen-free adult male Sprague-Dawley rats were obtained from (Charles River Laboratory, Raleigh, NC). Upon arrival, all animals were allowed free access to food and water and housed in laminar flow hoods in Association for Assessment and Accreditation of Laboratory Animal Care International (AAALAC)-approved animal facilities on a 12:12-h light-dark cycle at the University of California, Davis. Animal protocols were reviewed and approved by the University of California, Davis Institutional Animal Care and Use Committee. Prior to preparation of lung casts, the rats (all 7- to 9-wk-old and weighing 296 ± 32 g) were deeply anesthetized with pentobarbital sodium (100 mg/kg) and killed by exsanguination.
Pulmonary Casts
Silicone casts of pulmonary airways were prepared using a procedure similar to that (Perry et al., 2000). Lungs of euthanized, exsanguinated animals were fixed in situ for one hour at 30 cmH2O using Karnovsky’s fixative. Fixed lungs were rinsed with phosphate buffered saline then hung inside a Plexiglas vacuum chamber to a port through the lid. A syringe containing the degassed mixture of silicone (5 – 7 ml of a 77:18:5 mixture (by weight) of white Dow Corning 734 Flowable Sealant, Dow Corning 200 Fluid (20 cS), and acetic acid, respectively) was then connected to the lung through the port of the vacuum chamber. A vacuum of ≈75 mmHg was generated in the chamber to draw the casting material into the lung while relying on experience and careful observation to assure proper filling of the lung; typical filling time was 3 – 5 minutes. The casts were then left to cure overnight, following which the tissue was dissolved by submersing the lung in household bleach until all the tissue was removed, typically 4 – 8 hours.
In preparation for imaging, casts were placed in 50-ml conical tubes and warmed to ~40 °C in a water bath. Tubes were then filled with 4 wt%, low-melting-point agar gel that was simultaneously maintained above its melting point and doped with Magnevist (Berkeley Imaging, Wayne, NJ). The commercial contrast agent (1:250 Magnevist to gel by volume) enhanced the gel visualization with proton (1H) MR imaging. Once immersed in warm gel, airway branches relaxed in a near zero-buoyancy state so that the cast took on a natural appearance more consistent with the original in situ branching angles than when suspended without the gel. This state was achievable because silicone density (~1.02 g/cc) closely matches that of water gel (~ 1.00 g/cc). After each tube was filled with warm gel, its contents were first degassed under light vacuum to minimize bubble formation. Gel was then allowed to harden at room temperature. Once set, the gel prevented cast movement during imaging. Generally, each cast was centered in the tube to minimize contact with terminal airway branches. Nevertheless, analysis of acquired MR data indicated that, on average, contact with the tube walls occurred at an incidence of about 60 terminal branches per cast. However, these airways were typically smaller than the 250-micron size threshold used for analysis and represented a small fraction of total terminal branches observed per cast in this size range (~6000). The small degree of contact that was observed was therefore not expected to have any significant impact on measurement results or conclusions.
MR Imaging
Cast imaging was performed using an Avance spectrometer (Bruker Instruments, Fremont, CA) and a standard imaging probe that mounted inside the system’s 11.7-Tesla, 89-mm diameter, vertical-bore magnet (Magnex Scientific, Oxford, UK). To facilitate cast visualization, each sample was mounted inside the magnet bore on a translation stage so it could be moved vertically between successive 3D acquisitions. Generally, this was necessary since each cast was longer than the viewable imaging region. Each 3D data set was collected on a 2563 matrix in 3.5 h using a standard spin-echo sequence with 2 averages, a 12-ms echo time (TE), and a 100-ms repetition time (TR). Typically, three separate 3D data sets were required to cover the entire cast. Afterward, each was Fourier reconstructed on a 512 × 512 × 256 matrix showing a 3.2 cm × 3.2 cm × 3.2 cm FOV (field of view). Images were then stored as 256 separate slices, and after all data were reconstructed, data from multiple image sets were concatenated to form a single stack of contiguous, two-dimensional (2D) slices.
Segmentation and Surface Extraction
Image data was loaded into TULIP, an in-house image processing software, using appropriate scaling intervals (3.2 cm/512 voxels; 3.2 cm/512 voxels; 3.2 cm/256 voxels) to ensure data were rendered with the correct aspect ratio. The volume was first preprocessed using background normalization to remove the background signal in each 2D image. Background normalization was employed to remove artifacts from the image that result from the data collection method. Using the MRI imaging methods described above, the water outside the cast was the main signal imaged, with the absence of signal indicating the cast. The resulting images generally exhibited a low amount of noise. However, a significant impediment to connected segmentation existed due to nonuniformity in the signal at the edge of the image. To remove these artifacts, the background of each image was normalized. This was accomplished by creating a background image by blurring the original image with a 5 pixel radius Gaussian average. The background image was then subtracted from the original image. Connected-threshold segmentation was then applied to convert the series of grayscale pre-processed images into a binary volume by associating each point in the series of images with either cast or not-cast. By this approach, the set of cast voxels would include every voxel both meeting the threshold criterion and also connected to a user-provided seed point known to be in the cast. Connectedness was restricted to face connectivity to prevent ambiguous representations of the surface between cast and not-cast. Face connectivity was accomplished both by restricting the region growing algorithm to faces and by a post-segmentation connectivity check that reassigns voxels found to possess vertex or edge connectivity.
Imaging artifacts and under resolved, disconnected airway passages were then manually edited and a connected-threshold algorithm (Yoo, 2004) was used to segment airways. A variant of the marching cubes algorithm (Sethian, 1996) was applied to the segmented data to produce a triangulated isosurface. However, because the airways were convoluted and in places under resolved, the generated surface was systematically checked for topological correctness. Any self-intersections in the triangulated data were removed by adjusting the segmented data. Afterward, the airway surface was smoothed using volume-conserving smoothing (Kuprat et al., 2001) to enhance the geometry to be meshed.
Centerline Extraction
The centerline of the triangulated surface was decomposed into a topologically correct skeleton that formed the basic data structure for all morphometric measurements and analysis. Many studies have decomposed the voxelated data based on a computation of the medial axis to obtain this graph. However, this approach typically requires extensive editing to remove spurious branches and is quantized to voxel spacing. In contrast, we based our decomposition on the triangulated surface, as it requires no editing and is capable of sub-voxel resolution. The approach consists of defining a geodesic function on the Voronoi approximation to medial axis whose singularity is an approximate centerline (Dey and Sun, 2006). Prior to decomposition, the surface was refined/derefined as a function of a scale-invariant field described elsewhere (Kuprat and Einstein, 2008). Briefly, this processing of the surface prior to centerline extraction assures that the local edge length of a given airway is approximately a constant function of the airway diameter. This typically decreases the total triangle count and assures that the scale of noise in the centerline is approximately equal at all scales of the lung.
Centerline Analysis
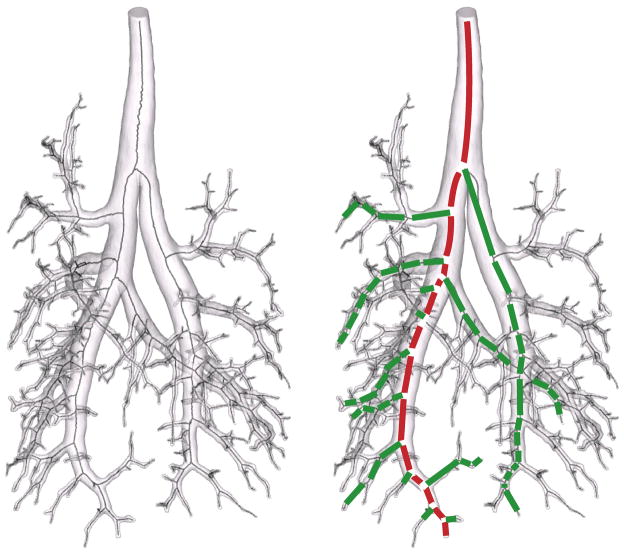
The centerline produced by the medial geodesic function is a disorganized graph of connected line segments, whose density corresponds in rough measure to the density of the original surface triangulation. The raw graph, therefore, follows the curvature of the airways. To simplify the distillation of this graph into airway statistics and because the airways are relatively straight, individual line segments were assembled into segments, defined as the span between bifurcations or between a bifurcation and an endpoint (Fig. 1). Segment assembly considered the topological neighborhood of each node on the centerline and the connectivity between points. A point connected to a single line segment was considered an endpoint; a point connected to exactly two line segments was considered an airway point; and a point connected to more than two line segments was considered a bifurcation point. Though this definition of airway length neglects curvature, the segment curvature was expected to be small. Since the centerline of a correctly segmented airway is acyclic, the centerline was also scanned for cycles due to an incorrect segmentation. When a cycle was identified, the segmentation was revised. In practice, cycles were rare. Segment statistics included the length and diameter of each segment, the segment generation, the path length of the segment to the trachea, the bifurcation angle (defined as the angle between the parent and the daughter segment), and the azimuthal angle. The diameter of each segment was computed at the segment midpoint but with reference to the raw graph. Thus the assumption of straight segments did not influence the diameter measurement. Diameters were defined as twice the minimum distance between the raw centerline and the triangulated surface. Closest point queries were performed with a kd-tree for computational efficiency (Khamayseh and Hansen, 2007). Briefly, a kd-tree is a space-partitioning data structure for organizing points in 3D space. Searches are performed hierarchically, such that points are first located in coarse subdivisions of space and then refined only within smaller scale subdivisions that are subordinate to the coarse subdivisions containing the point. In practice, this accelerates nearest point searches to N.log(N) rather than N2 complexity, where N is the number of points.
Figure 1.
Note that the geometric entity that we refer to as a segment is often referred to as a ‘branch’. In this study, we reserve the term ‘branch’ to refer to an assemblage of segments, spawning possibly multiple offshoots, that runs from a bifurcation off of a parent branch down to the terminal bronchioles (Figs. 1&2). The commonly used definition of branch in lung morphometry has the advantage of being unambiguous. At the same time, we believe it is of limited utility. While the definition of branch adopted herein might appear to be at times a statistical rather than purely geometrical feature, we intend to illustrate that its definition leads to important morphometric relationships. In order to facilitate comparisons between manual and MR-based measurements, all segments were numbered according a modification of the binary numbering system advocated by Rabbe (Raabe et al., 1976). According to this modification, segment ‘1’ is the trachea, spawning two daughter segments ‘11’ and ‘10’, where the suffix ‘1’ designates the larger daughter segment1. This designation is then repeated iteratively for all of the resolved segments. We extend this definition, in this study, by designating branches by their top most segment. Thus, branch ’11’ starts at segment ‘11’ and continues to the limit of the resolution of the data, in the case of MR measurements, or to the last manual measurement in the case of the manual measurements. Branches were assembled from segments according to the following simple heuristics. First, daughter segments with the smallest angular deviation from the parent segment were added to the parent segment’s branch. The daughter segment with the greater angular deviation, was considered to be an offshoot. Second, daughter segments with the greater diameter were added to the parent segment’s branch. The daughter segment with the smaller diameter, was considered to be an offshoot.
Figure 2.
Optical Measurements of Lung Casts and Validation
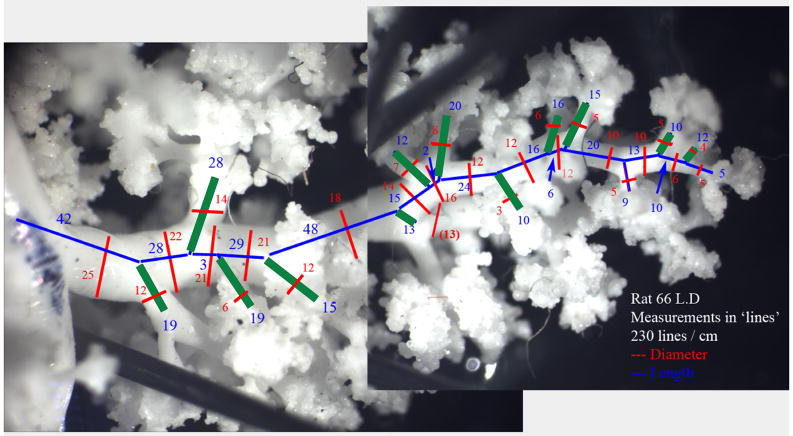
MR measurements in three branches of one of the rats were validated against manual measurements taken with an optical micrometer at high magnification. Silicone airway casts were placed under a stereomicroscope and manipulated so that each airway segment and branch was parallel to the plane of the microscope as it was being measured. Lengths and diameters were determined using an optical micrometer in the microscope eyepiece at a known magnification and then scaled into real units. Segment diameters were measured at the segment midpoint, where possible, and at the most representative diameter if the segment midpoint fell at an anomalous spot (such as across a bifurcation). Segment lengths were measured from centerline branch point to centerline branch point, using intuition to identify these points. Measurements were recorded as they were taken onto a printed photo of the airway tree, and later entered into a database. Note that due to the mode in which these measurements were acquired, it is difficult to assign to them a specific resolution. Some were acquired with one microscope objective, some with another. Regardless, we treated the manual measurements as the gold standard for comparison with digital imaging and image processing. It should be remembered, however, that each measurement type has some degree of uncertainty and stated assumptions for the basis of branchpoint determinations and length and diameter measurements.
Statistical Analysis
Reproducibility Analysis of Digital, MRI-Based Methods
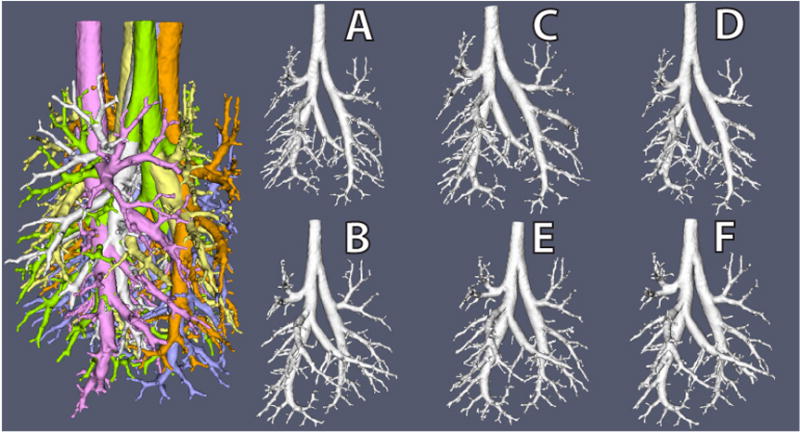
To assess the reproducibility of our MR imaging and digital analysis methods, two lung casts were imaged three separate times (Figure 3). First one cast was imaged, then the other. This was repeated until each cast had been imaged a total of three times. The orientation of each cast in the spectrometer was by chance with each repeat. After each dataset had been segmented and the centerline extracted, we compared length and diameter measurements between each of the three repeats both in terms of distributions and individual segment-by-segment comparisons. Distribution analysis looked at all of the segments cumulatively, by comparing the cumulative distribution of diameters, segment lengths for each repeat. Individual segment-by-segment comparisons consisted of matching 22 randomly selected segments among each of the repeats. Seven segments were randomly selected from the first cast, eight from the second and seven from the third. Each selection was stratified by generation such that one third were selected from generations 1–7, one third from generations 8–14 and one third from generations 15–21. Statistics reported were between segment variation, systematic between image variation, segment-to-segment between image variation, overall between image variation, and total variation.
Figure 3.
Comparison of Digital, MRI-Based vs. Manual Measurements of Lung Casts
The segment by segment MR-based measurements of the lung casts were compared with the corresponding manual measurements using the paired t-test. Both the bias and precision of the comparison were calculated. Bias was defined as the difference between the means of the MRI-based and hand measurements, while precision was defined as the standard deviation of the difference between MRI-based and hand measurements. The Bland-Altman method (Bland and Altman, 1986, 1999) was used to determine if there was a trend in the bias with the increasing magnitude of measurements or whether there was heteroscedasticity of the measurement differences. Finally, the segments measured manually but missed by the MRI method due to threshold cutoffs (250 μm and below) were also noted and expressed as a percentage of all of the segments counted.
Models for Morphometry
We developed models for the tapering diameter of an airway branch, for the cumulative number of offshoots of the branch and for the diameter of offshoots from the main airway branch. Our models followed the methodology developed by Karau and Molthen for pulmonary vasculature morphometry (Karau et al., 2001; Molthen et al., 2004). These models assume that the diameters and cumulative number of airway branches are described by equations with a parametric form common to all branches. This assumption is referred to by Karau as “self-consistency”. Essentially, self-consistency assumes that any airway branch would have geometric properties identical to all other branches if correctly aligned. This latter point is of utmost importance to our applications and will be taken up in the discussion.
To investigate a common model for the tapering of diameter for all branches Karau (Karau et al., 2001) first observes that diameter D of a single branch is a function of the distance x along the branch can fitted by the following functional form
| (1) |
where D0 is the branch diameter at x = 0; Ltot is the total length of the branch and c is the measure of the concavity/convexity of the taper (when c < 1, the curvature of the taper is convex to the branch axis, and when c > 1, the curvature of the taper is concave to the axis). D0/Ltot describes the average taper of the trunk. The error term ε is the deviation from the perfect fit and has some distribution with mean of zero. The standard deviation of the ε distribution is referred to as the standard error of the estimate and describes the combination of systematic deviation of the equation from a true model (lack of fit), biological deviation from the model and measurement error.
Under the assumption of self-consistency for all branches, Equation (1) can be modified to model diameter for every branch, according to
| (2) |
where D0, Ltot and c are the same as in Equation (1) but are assumed to be common to all branches, si is a shift in path length along the main branch to the location where the main branch diameter is equivalent to the diameter of the ith branch and ε is the error term. One should note that this equation describes the narrowing of each given branch, given its initial diameter but does not tell anything about the initial diameter of an offshoot of the main branch or other branches. One should also note that characterization of the main branch - or first branch from the trachea to the distal lung – assumes special importance in this formulation.
A second important feature of the pulmonary tree morphometry is the cumulative number Nbr of offshoots encountered along a branch and their location. For a single branch, we observe the following relationship for Nbr as a function of the distance x along the branch
| (3) |
where Ntot is the estimated total number of offshoots off the branch, Ntot/Ltot describes the average number of branches per unit length, b describes how the distance between branches changes from the beginning of the branch to more distal regions and ε is the error term. Similar to the definition of taper in Equation (1), when b is greater than 1.0, the number of offshoots per unit length increases with x; when b is less than 1.0, the number of offshoots per unit length decreases with x. Ltot is estimated from Equation (1) and substituted into Equation (3).
Under the assumption of self-consistency for all branches, Equation (3) can be generalized for all branches such that
| (4) |
where Ntot, Ltot and b are the same as in Equation (3) but are assumed to be common to all branches; ni is the number of offshoots an individual branch would have to be shifted to match the equivalent distal portion of the main branch, and ε is the error term. Terms si and Ltot are estimated from Equation (2) and substituted into Equation (4).
Finally, we model the diameter Dbr of the offshoots off of the main branch by jointly fitting Equation (1) for the main branch and Equation (5). Equation (5) establishes the relationship between Dbr and the distance x along the main branch
| (5) |
where Dbr(x) represents the expected diameter of the offshoot at distance x along the main branch, Dbr(0) is the estimate of the expected diameter of the offshoot at the beginning of the main branch. Dbr(0)/D(0) represents an estimate of the average ratio of the offshoot-to-main branch diameters. If we are willing to assume self-consistency of the branching ratio across all branches, this model fit for the main branch describes branching ratio of diameters for the entire pulmonary tree. As an alternative to Equation (5), we have performed a linear regression of the smaller daughter segment diameter with respect to the parent daughter diameter.
The parameters in Equations (1) – (5) were estimated in R (Team, 2004) using non-linear least squares fitting via the nl2sol algorithm from the Port package. For some of the branches, it was necessary to introduce the additional constraint that Ltot is larger than any observed x. The models were fit separately for the two halves of each pulmonary tree (left and right). Only branches with at least 4 segments were included. In total for this study, estimates were obtained for the six halves of the pulmonary trees of three rats. We also examined the means and standard deviations of the parameter estimates across animals.
Results
Optical Measurements of Lung Casts and Validation
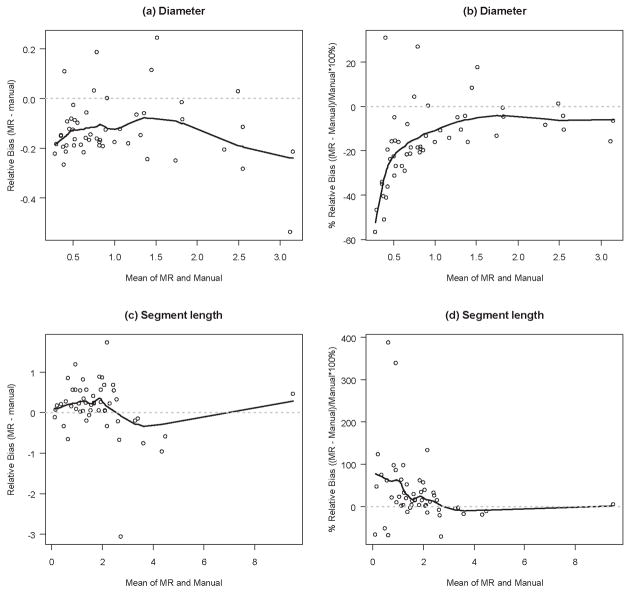
Data from manual measurements for three selected branches (main left branch of the pulmonary tree and its 4th and 5th offshoots) were matched and compared to computer generated data from MRI in order to validate the MR results. The computer-generated wire skeleton of the airway tree was used to identify individual airway structures and to ensure that they were being compared to the same structures on the real cast. For the three selected branches, MR detected 28 segments while the manual measurement revealed presence of 48 segments. Distal-end computer measurements tended to ignore very small offshoots (diameter less than 250 μm2), and thus created the appearance of a single long airway segment where manual inspection found several shorter segments. To account for this discrepancy, segments in the manual measurement dataset that were missed by MR were combined into a single segment so that the resulting segment matched the corresponding MR segment. Therefore, the MR-to-manual comparison included 28 matched segments. The results of the agreement analysis between MR and manual measurements are presented in Table 1 and Figures 4. The computer-generated measurements of the diameter were on the average 0.13mm (95% C.I. −0.16mm to −0.09mm) smaller than the corresponding measurements obtained manually. In all but two cases, optical measurements of diameter were between maximum and minimum MRI-based diameters, plus or minus the resolution of the data, 0.125 mm. The segment length measured by MR was on the average 0.13mm longer than the manual measurements but the difference was not statistically significant. The precisions were 0.13mm and 0.68mm for the diameter and for the segment length, respectively. The average bias of MR relative to manual measurements, expressed in mm, seemed weakly related or unrelated to the magnitude of the measurement (Figures 4a and 4c). This finding is consistent with the finding that the average percent bias is larger with smaller magnitude of the measurement (Figures 4b and 4d).
Table 1.
Relative bias and precision of the MR measurements vs. manual measurements. Bias was defined as the difference between the means of the MRI-based and hand measurements, while precision was defined as the standard deviation of the difference between MRI-based and hand measurements. All measurements are in mm.
| Measurement Parameter | Computer MR measurements | Manual measurements | Relative bias (95% C.I.), Computer MR – Manual | Precision | |||
|---|---|---|---|---|---|---|---|
| mean | SD | mean | SD | bias | p * | ||
| Diameter | 0.96 | 0.74 | 1.09 | 0.76 | −0.13 (−0.16 – −0.09) | <0.001 | 0.13 |
| Segment length | 1.93 | 1.46 | 1.80 | 1.57 | 0.13 (−0.06 – 0.32) | 0.2 | 0.68 |
paired t-test
Figure 4.
Reproducibility Analysis
For the distribution analysis of all of the imaged airways, lengths and diameters (expressed in units of voxels, the fundamental resolution of the measurements) were very consistent (Figure 5) between repeats and differed slightly between casts, as expected. For the matched analysis (Figure 6 & Table 3), reproducibility of set ACD was found to be 98% and 96% for diameter and length measurements, respectively. For repeat BEF, reproducibility was found to be 99% and 96% for diameter and length measurements, respectively. For both sets of images, diameters (ACD = 98%; BEF = 99%) were slightly more consistent than lengths (ACD = 96%; BEF = 96%).
Figure 5.
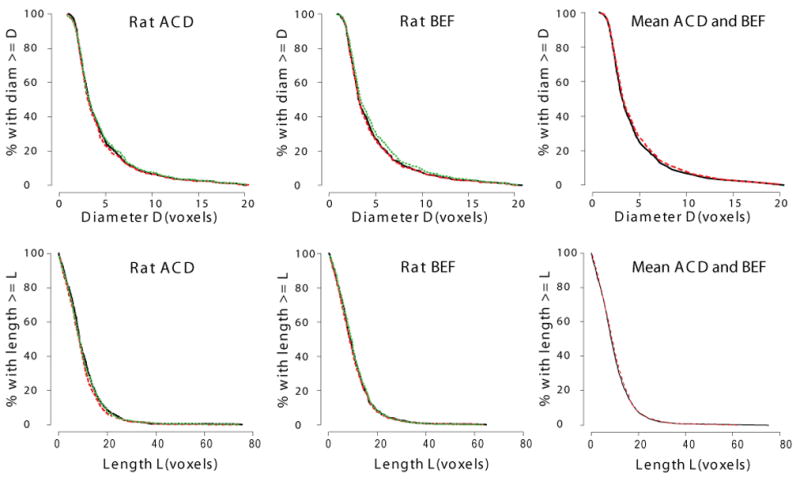
Figure 6.
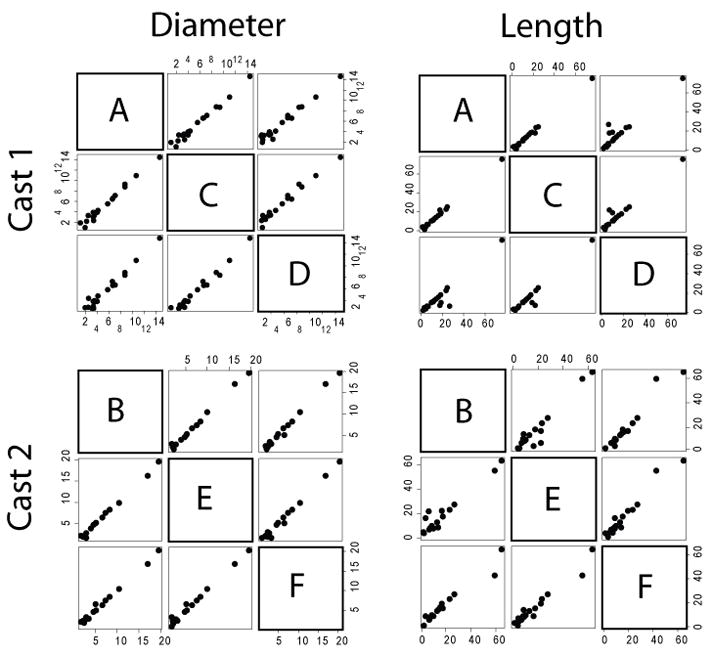
Table 3.
Models for morphometry with trachea and outliers, parameter estimates. NB = total number of branches, NS = total number of segments. Each lung was separated into left (branch 11) and right (branch 10) halves. Only branches with at least 4 segments were included. SEE = standard error of the estimate in the non-linear (least squares) regression. Note the increased error by including at most two outliers, with respect to Table 4.
| Equation 2 | Equation 4 | Equation 5 | ||||||||||||
|---|---|---|---|---|---|---|---|---|---|---|---|---|---|---|
| Pulmonary tree | NB | NS | D0 | Ltot | D0/Ltot | c | SEE | Ntot | b | Ntot/Ltot | SEE | D0 | Dbr | D0/Dbr |
| MRI - rat 66, side 11 MRI- rat 66, side 10 |
23 14 |
172 105 |
3.65 3.59 |
66.5 44.3 |
0.055 0.081 |
0.77 1.02 |
0.17 0.15 |
29.2 25.7 |
1.09 0.74 |
0.44 0.58 |
0.74 0.66 |
3.15 3.27 |
1.64 1.54 |
0.52 0.47 |
| MRI -rat 62, side 11 MRI -rat 62, side 10 | 24 15 |
171 99 |
3.50 3.16 |
52.6 36.7 |
0.067 0.086 |
1.31 1.08 |
0.20 0.19 |
25.9 19.7 |
0.94 0.64 |
0.49 0.54 |
0.80 0.78 |
3.00 3.04 |
1.57 1.69 |
0.52 0.56 |
| MRI -rat 71, side 11 MRI -rat 71, side 10 |
11 11 |
89 67 |
3.36 3.47 |
57.9 40.2 |
0.058 0.086 |
1.94 1.33 |
0.25 0.23 |
29.7 19.6 |
0.67 0.46 |
0.51 0.49 |
0.75 0.74 |
2.75 3.21 |
1.58 1.42 |
0.57 0.44 |
Models for Morphometry
Tables 3 and 4 presents estimates of Equation 2 (diameter tapering), Equation 4 (cumulative number of offshoots) and Equation 5 (offshoot-to-branch diameter ratio) for the two sides of each of the three rats. In the entire pulmonary tree of the three rats, among hundreds of segments, there were only at most two anomalous segments on side 11 and one anomalous segment on side 10. These were deemed anomalous because the diameter widens instead of becoming narrower. These were the initial two (or one) segments of the main branch of either side of the pulmonary tree. Table 3 presents the parameter estimates with these outliers included. Table 4 presents these same parameter estimates with the anomalous segments removed. There is some difference of opinion as to whether this ‘bulging’ is an artifact of the casting process or is ‘true’ anatomical feature. We postpone a discussion of this question to the Discussion. The following presentation of results refers to Table 4.
Table 4.
Models for morphometry without trachea and outliers, parameter estimates. NB = total number of branches, NS = total number of segments. Each lung was separated into left (branch 11) and right (branch 10) halves. Only branches with at least 4 segments were included. SEE = standard error of the estimate in the non-linear (least squares) regression. Note the decreased error by excluding at most two outliers, with respect to Table 3.
| Equation 2 | Equation 4 | Equation 5 | ||||||||||||
|---|---|---|---|---|---|---|---|---|---|---|---|---|---|---|
| Pulmonary tree | NB | NS | D0 | Ltot | D0/Ltot | c | SEE | Ntot | b | Ntot/Ltot | SEE | D0 | Dbr | D0/Dbr |
| MRI - rat 66, side 11 MRI- rat 66, side 10 |
23 14 |
171 104 |
2.95 3.28 |
42.1 39.3 |
0.070 0.084 |
1.24 1.55 |
0.13 0.11 |
29.2 28.4 |
1.23 1.29 |
0.69 0.72 |
0.71 0.61 |
2.69 3.13 |
1.34 1.27 |
0.50 0.41 |
| MRI - rat 66 - mean* | — | — | 3.11 | 40.7 | 0.08 | 1.39 | — | 28.8 | 1.26 | 0.71 | — | 2.91 | 1.31 | 0.45 |
| MRI -rat 62, side 11 MRI -rat 62, side 10 |
24 15 |
169 98 |
2.94 3.09 |
35.6 30.8 |
0.083 0.100 |
1.31 1.08 |
0.17 0.13 |
26.3 22.0 |
1.23 1.25 |
0.74 0.72 |
0.75 0.73 |
2.68 3.06 |
1.20 1.69 |
0.45 0.55 |
| MRI - rat 62 - mean* | — | — | 3.02 | 33.2 | 0.09 | 1.20 | 24.2 | 1.24 | 0.73 | 2.87 | 1.44 | 0.50 | ||
| MRI -rat 71, side 11 MRI -rat 71, side 10 |
11 11 |
88 66 |
3.00 3.28 |
51.2 34.5 |
0.059 0.095 |
1.94 1.33 |
0.21 0.15 |
31.0 20.5 |
1.15 1.04 |
0.61 0.59 |
0.76 0.68 |
2.68 3.09 |
1.01 1.09 |
0.38 0.35 |
| MRI - rat 71 - mean* | — | — | 3.14 | 42.9 | 0.08 | 1.64 | — | 25.8 | 1.09 | 0.60 | — | 2.88 | 1.05 | 0.37 |
| MRI - between animal mean** | — | — | 3.09 | 38.9 | 0.082 | 1.41 | — | 26.2 | 1.20 | 0.68 | — | 2.89 | 1.27 | 0.44 |
| MRI - between animal SO** | — | — | 0.07 | 5.1 | 0.008 | 0.22 | — | 2.3 | 0.09 | 0.07 | — | 0.02 | 0.20 | 0.07 |
| Manual - rat 66 | 18 | 183 | 3.11 | 34.0 | 0.092 | 1.69 | 0.07 | 41.42 | 1.79 | 1.22 | 0.85 | 301 | 1.37 | 0.45 |
Mean of side 11 and side 10
Mean and SD are taken across the estimates for the three rats. The presented SDs are overestimates of the true between animal SDs because they include other sources of variation
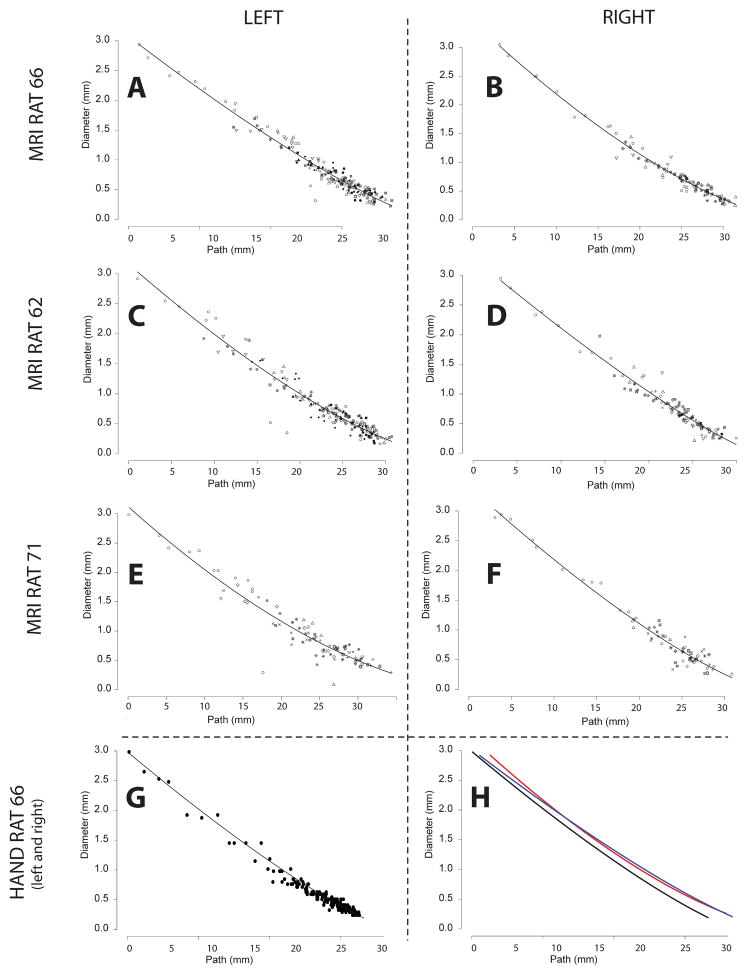
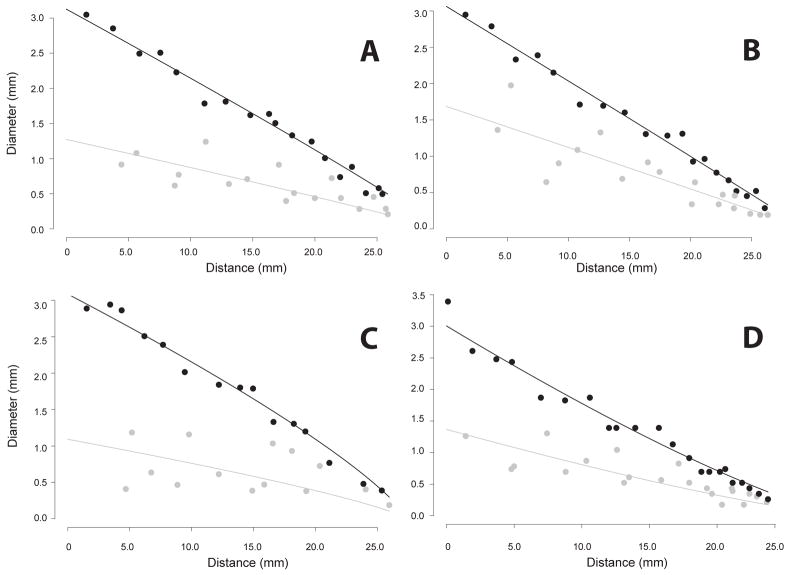
The mean ratio D0/Ltot of shape parameters from Equation 2 (calculated across the three rats using the MR data) was 0.082 (range 0.059 – 0.100). For all pulmonary tree data obtained by MR, parameter c in Equation (2) was greater than 1.0 (range 1.08 – 1.94), suggesting that the average curvature of the branches for each of the pulmonary trees was concave (Figure 7).
Figure 7.
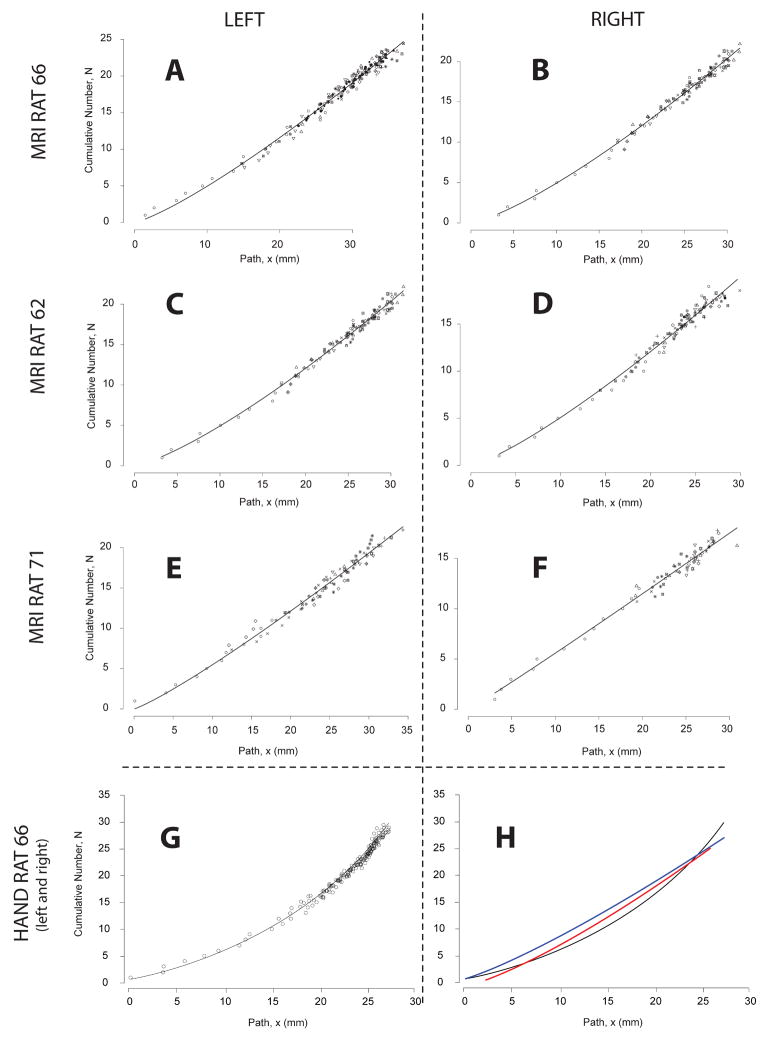
The mean number of branches per length of branch (Ntot/Ltot from Equation 4) determined from the MR data was 0.68 branches per millimeter (range 0.59 – 0.74 branches/mm). Parameter b from Equation 4 was always greater than 1.0 (range: 1.04 – 1.29) for the MR data, suggesting a larger number of offshoots per unit length for the more distal parts of the pulmonary tree. The mean estimated diameter branching ratio Dbr(0)/D0 (Equation 5) based on the MR data was 0.44 (range 0.35 – 0.55).
For one of the rats (Rat 66) estimates of these same parameters were also obtained from the manually measured data for selected branches. Note, for parameterization, the manual data was not matched to the available MR-data. All data, including unmatched segments and segments below the resolution of MR, were included. Parameter estimates in Equation (2) based on the manual data had a stronger curvature parameter c equal to 1.69 (versus 1.39 on MRI) and D0/Ltot = 0.092 (versus 0.077 on MRI). However, these differences were not significant. The fit to Equation (2) was slightly better for the manual than the MR-based data (SEE = 0.07 for manual data vs. 0.13 and 0.11 for MR data). The mean number of offshoots per length of branch (Ntot/Ltot from Equation 4) was 1.22 for the manual data and 0.69 and 0.72 for the MR data, reflecting the greater number of segments included in the analysis. Parameter b in Equation (4) was 1.79 for the manual data compared to 1.23 and 1.29 for the left and right halves of the MR-data, respectively. These differences were not significant. In addition, the diameter branching ratio Dbr(0)/D0 was 0.45 for manual vs. 0.41 and 0.50 for MR-based estimates (Figure 9). No differences between manual and MR-based parameter estimates were significant.
Figure 9.
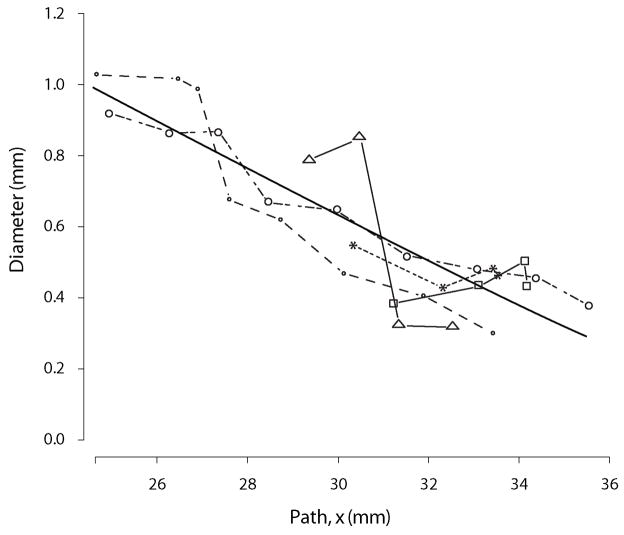
We observed that Equations (1) and (3) provide a very reasonable description for the diameter and the cumulative number of offshoots of the individual airway branches (see Figures 7, 8 and 9). For some branches, even a linear approximation in Equations (1) and (3) would be appropriate. But several branches feature curvature and the power relationship of Equations (1) and (3) seems to provide a good approximation given the simplicity of the functional form. A substantial self-consistency was found among the branches as can be seen in Figures 7 and 8. These figures illustrate a simultaneous fit of Equations (2) and (4) to all considered branches. On the other hand we still observed considerable heterogeneity in curve fits among branches. The excellent fit of the Equations (2) and (4) to all branches visually assessed in Figures 7 and 8 is in part induced by superimposing the curves of the individual branches so that they line up along the curve for the main branch. Therefore looking at the whole range of values in Figures 7 and 8 gives an impression of almost perfect self-consistency among branches. If one zooms into a small section of Figures 7 and 8 one can see important differences in the curve shapes of the individual branches (see Figure 11).
Figure 8.
Figure 11.
Discussion
Over the years, there have been numerous studies that have examined the morphometry of the lungs of various animals. Seminal studies in the field (Weibel, 1963, 1970; Horsfield et al., 1971; Raabe et al., 1976; Phalen et al., 1978; Horsfield and Woldenberg, 1986) in large part established databases that are still in use today (Horsfield and Woldenberg, 1986; Rodriguez et al., 1987; Menache et al., 1991; Kitaoka and Suki, 1997; Kitaoka et al., 1999; Sapoval et al., 2002; Mauroy et al., 2004; Majumdar et al., 2005). We are interested in assembling a database from multiple age-matched, male Sprague-Dawley rats in order to assess inter- and intra-animal variability and to create a normative geometry database for this age, sex and strain of rat for the development of gas, vapor and aerosol dosimetry models - a project that is ongoing. In this study, however, we were specifically interested in establishing a framework wherein the downstream morphometry could be predicted from the upstream morphometry for a given airway and thus extend our computational models beyond the resolution of MR images. This will be accomplished by assigning appropriate airway outlet boundary conditions based upon this morphometric analysis, to our MRI-derived, three-dimensional computational fluid dynamics airflow models.
We found that the automatically generated measurements of airway diameter and length were in reasonable agreement with manual measurements, which served as validation data. With regard to airway diameter there was a systematic bias such that airway diameters based on MR data were on average smaller than manual measurements. This is, at least in part, attributable to the differences in the approaches to airway diameter measurement.
Automatic airway diameter measurement was based on the determination of the minimum distance between the centerline and the airway wall, while manual measurement of diameter was based on the profile of the airway presented to the objective of the microscope. In other words, while the automatic measurements were mathematically rigorously based on minimum diameters, manual measurements were apt to vary between minimum and maximum diameters, based solely on accessibility. This notion was supported by the observation that in all but two cases, the optical measurements of diameter fell between the maximum and minimum MRI-based diameter measurements, plus or minus the resolution of the data. While it is true that there was the option of pruning the cast for better accessibility, we chose not to in order to preserve the cast’s integrity for future work. In addition, the cast is a replica of a real object with much geometric heterogeneity. Thus, the axial location (due to the scale of the rat lung measured in millimeters) of a manual measurement along a given airway influences the reported diameter.
With regard to length, after adjustment for missed segments due to the inherent resolution limitation of about 250 μm in the MR data (twice the actual MR-resolution), there were no significant differences in airway or segment length between the two sets of measurements (Table 1). Finally, Table 1 shows that the relative bias between manual and MR measurements is just 0.13 mm – this is exactly the MRI resolution, as expected.
A major challenge in making manual to MR comparisons was matching of segments with measured airways, as has been noted before (Tschirren et al., 2005c; Palagyi et al., 2006). Though MR-based measurements were in good accordance with hand measurements on a single cast, hand measurements themselves are prone to error. Thus, we were interested in assessing the reproducibility of our measurements in an effort to evaluate measurement and processing error. Such error includes variability in the imaging data, variability in the segmentation, which includes judgments based on intensities and gradients, as well as variability in the construction of the centerline graph. The reproducibility results of the distribution analysis (Figure 5) for both cumulative diameter (all segments less than a given diameter) and cumulative length (all segments less than a given length) were very consistent between repeats and differed slightly between casts, as expected. The reproducibility results for the matched analysis of randomized segments were 98% and 96% for diameter and length measurements for repeat ACD and 99% and 96% for diameter and length measurements for repeat BEF (Figure 6 & Table 3). For both sets of images, diameters (ACD = 98%; BEF = 99%) were slightly more consistent than lengths (ACD = 96%; BEF = 96%). It is likely that this difference is attributable to image intensity non-uniformity at the extreme of the imaging bore. Specifically, when daugther segments are lost, parent segments appear to be longer, thus contributing to greater variability in length measurements. Nevertheless, the high degree of reproducibility in our measurements at all scales, combined with the correspondence between MR-based and hand measurements, give us confidence that our analysis of self-similarity is well-grounded and real.
Another perspective on the correlation between the MR-derived data and the manual validation data is to note that the functional relationships between diameter and shifted path-length3 and shifted path-length and inter segment spacing (number of branches) are similar (Table 4 and Figures 7, 8 & 9). Independently of the merits of the parameterization (Eqs. 2, 4 & 5) of the lung casts, it is important to note that the specific parameters (D0, c, b, D0/DBr) are indeed quite similar among the three MR-based datasets and the manual dataset. Moreover, the standard error for all the fits is small and of comparable magnitude. The standard error for Equation 2 is smaller for the manual data than it is for the MR-based data, but the standard error for Equation 4 is slightly higher. These correlations can be seen plainly in Figures 7, 8 and 9. The importance of this is that morphometry is the study of relationships, and this correlation between the fits of the various models implies that the relationships are conserved. It is also a comment on the robustness of the equations to describe the data. However, it should be noted that the finite resolution of the MR-data4 does affect the ability of Equations 2, 4 and 5 to capture the full curvature of model as the relative uncertainty of airway diameters and lengths grows as these dimensions approach the limit of the data. This is especially evident in the differences in curvature between Figures 8A&B and 8G (see also Figure 8H).
Similar to previous seminal work in lung morphometry (Raabe et al., 1976; Phalen et al., 1978), our databases consist of a vector of airway statistics. Previous morphometric analyses of these data have sought functional relationships between the logarithm of average diameter and airway generation (Menache et al., 1991; Majumdar et al., 2005), or between the logarithm of the diameter and the Strahler order (Jiang et al., 1994). In contrast, we have chosen to examine the relationship between individual airway diameters and the path length along assemblages of segments which we call branches (Fig. 1). Equation 2 describes the narrowing of each of the considered branches when they are aligned by diameter with the main principal path. Because branches are organized by assembling major daughters, another way of saying this is that Equation 2 shows the relationship between path-length and the diameters of the major daughters. This is significant, as it suggests that the diameters of half of all of the airways in the resolved lung follow a clear trend, given that the diameter of the top segment of each branch is known. Figure 9 adds to this interpretation by simultaneously showing the relationship between branch narrowing (Eq. 2) and sub-branch diameter (Eq. 5). The sub-branch diameter relationship is best described as stochastic. The mean is described by Equation 5, but there is clearly a distribution about that mean with notable variation. Thus, the diameters of the major daughters appear to be somewhat predictable, while the diameters of the minor daughters appear to be stochastic.
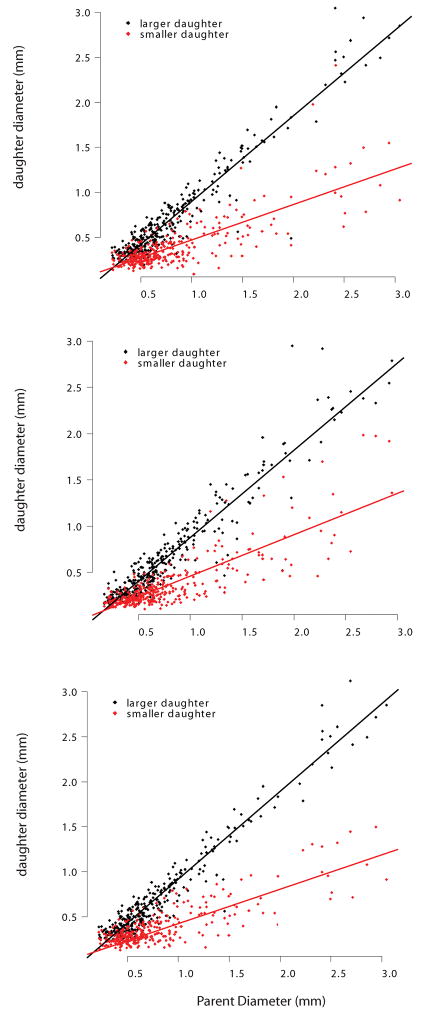
This latter observation implies that there are two distinct segment populations: the minor segment daughters and the major segment daughters. Indeed, if we plot major and minor segment (not branch) daughter diameter as a function of segment parent diameter (Figure 10), we do see that there are two distinct populations, a feature that has long been noted (Raabe et al., 1976; Phalen et al., 1978; Oldham and Phalen, 2002). That these ratios are constant on average has also been noted before (Phalen et al., 1978; Oldham and Phalen, 2002; Majumdar et al., 2005), as has the difference between the ratio of parent-to-major and parent-to-minor daughters; this is typically referred to as branching asymmetry (Phalen et al., 1978; Majumdar et al., 2005). We take this concept of branching asymmetry and add to it in two ways. First, we postulate that the repeating units in the monopodial rat lung are branches not segments. Second, we postulate that because branches persist though multiple generations they tend to closely follow a pattern, while sub-branch or offshoot diameters vary considerably, most likely as a function of space-filling considerations.
Figure 10.
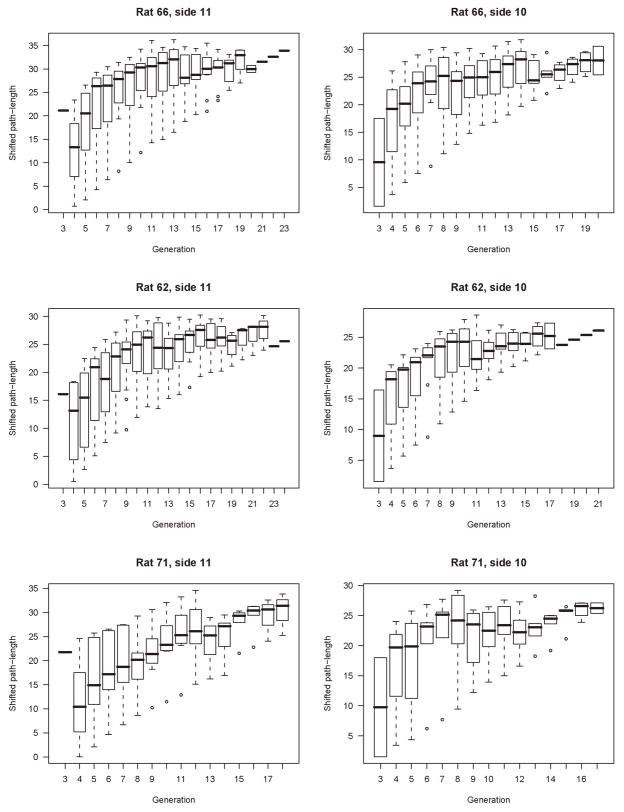
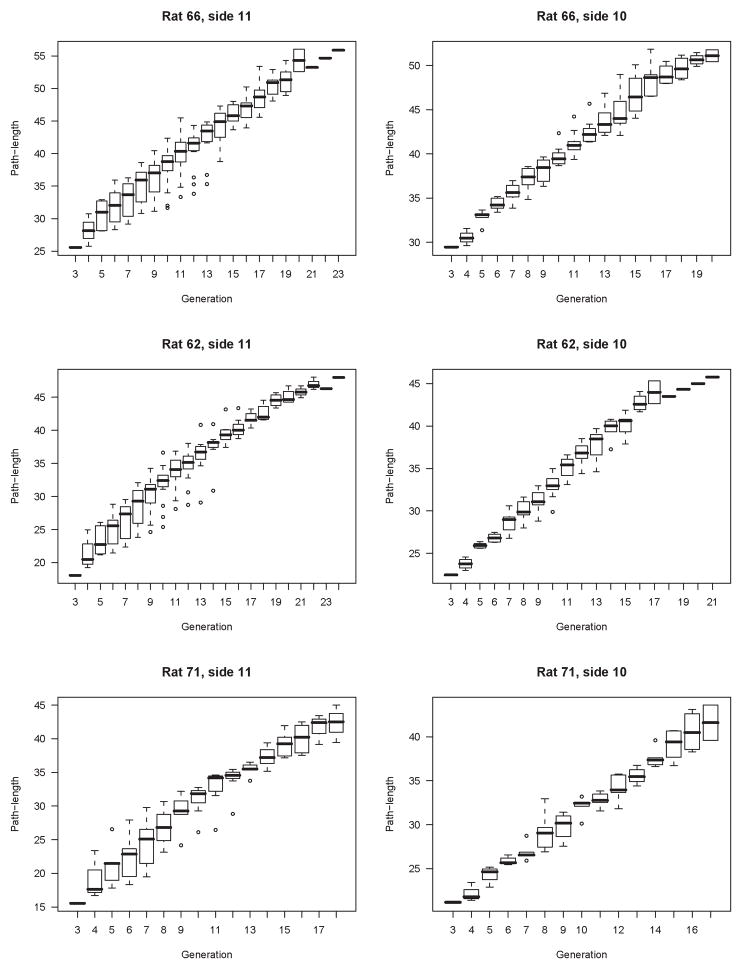
Generation might seem a simpler, more general metric than our concept of branch. However, we believe that generation has little descriptive - and considerably less predictive – power in the monopodial lung. To illustrate this, we have plotted shifted path-length as a function of generation (Figure 12). The marked heterogeneity in this relationship contrasts with the strong correlation between shifted path-length and diameter, suggesting that while generation is a more accessible independent variable it is not a strong organizing parameter for lung morphology. In contrast, the correlation between absolute path length and generation (Figure 13) appears to be much stronger, but is still not as strong as the correlation between shifted path-length and diameter. It is important to note that for the idealized symmetric lung, for example the popular Weibel model, that shifted path-length and absolute path-length and generation are all perfectly correlated.
Figure 12.
Figure 13.
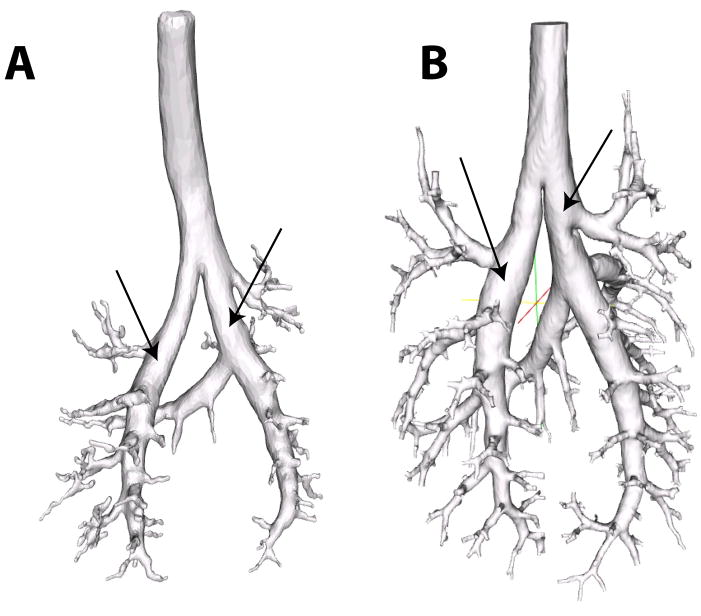
Finally, the relationships depicted in Figures 7, 8 and 9 are fit simultaneously across many branches. This helps to bring out the global relationships that would be otherwise masked by local variability. However, as Figure 11 illustrates, this local variability exists. Here we should also mention that we have omitted a few segments at the top of the tracheobronchial tree in our analysis. This was motivated by the bulging in the first few airways (Figure 14). This local distention of the airway segments has been discussed previously. One explanation that has been put forward, is that the casting process subjects the lung to undue distention, i.e. that this bulging is an artifact. However, it should be noted that we have observed a similar feature in all of the live rats we have imaged by MRI using hyper-polarized 3He gas as the airway contrast agent (Minard et al., 2006). This suggests that for this species and strain, this bulging is a real feature and not an artifact. Table 3 reports the converged parameter values and standard error with these top segments included. While Table 4 reports the converged parameter values and standard error without these top segments (in all cases either one or at most two segments were excluded). Including these bulged segments not only significantly increased the standard error, but also changed the character of the nonlinear fits, for some airways causing the curvature of the tapering to appear negative rather than positive or vice versa.
Figure 14.
This is a reminder that while the parameterization we have presented does appear to account for much of the morphology of the monopodial rat lung, it does not account for all of it. Moreover, given the limited resolution of our datasets with respect to the entire pulmonary airway tree, we must be cautious about extrapolating these relationships to the distal lung. Recent work in the developmental biology of the mouse has suggested that there are three distinct morphogenetic mechanisms of branching: domain branching, planar branching and orthogonal branching (Metzger et al., 2008). Our scheme most resembles domain branching. Schemes that focus on diameter as a function of generation more closely resemble planar branching. These considerations indicate that pulmonary architecture may not be entirely reducible to one or the other perspective.
Combined with computational fluid dynamics, the mathematical model presented herein provides a meaningful basis for determining functional differences between animals, as well the influence of distal airway heterogeneity on upper airway ventilation. Because it is focused on individual airways, rather than distributions related to airway generation, model parameters have both a local and a global character. Thus, for two airways A and B belonging to two different branches, with different path lengths and with different diameters, the model will predict different sub-trees subordinate to A and B, while the parameters (D0, Ltot, c, Ntot and b) are common to all branches and thus capture morphometric features of the entire lung. This local-global character of the model lends itself well to defining proper boundary conditions for accurate three-dimensional computational models. In the lung, we only know with any degree of precision the atmospheric pressure and the pleural pressure. Because it is not possible – nor particularly useful – to capture the entire lung geometry in 3D computational models, some truncation is necessary. Figure 14B, for example, represents a truncated computational domain for the Sprague-Dawley rat. This creates uncertainty because the pressures to be applied at the outlets of the truncated geometry are unknown. Because the true pressure at the outlets will depend on the downstream tree, a statistical model of this downstream tree that is addressed to a particular outlet (out of possibly thousands) enables the rational – if iterative - determination of outlet pressures. Furthermore, note that the equations have both a deterministic and a stochastic component. This stochastic component, provides a rational means for assessing the functional consequences of airway heterogeneity.
Conclusion
We analyzed the morphometry of the pulmonary airway trees of three aged-matched Sprague Dawley rats in the context of a mathematical framework that correlates branch statistics with path length. Digital/MRI-based measurements were validated against nearly a thousand manual optical measurements from a single cast. The digital/MRI-based measurements were also found to be quite reproducible. Our analysis shows that the branch – defined as an assemblage of segments – captures essential features of the monopodial rat lung better than individual segments, and that the main principle path is representative of all the resolvable airways. We also found that the bulging of the upper two segments, which appears to be a stable feature in this species and strain, did not fit this model. We believe that this framework is appropriate for defining lower-dimensional mathematical models of gas-exchange and particle deposition in the rat that define realistic boundary conditions for multiscale hybrid models of rat lung mechanics.
Table 2.
Reproducibility statistics for matched segments, including segment variation, systematic between image variation, segment-to-segment between image variation, overall between image variation, and total variation. Individual segment-by-segment comparisons consisted of matching 22 randomly selected segments among each of the repeats. Seven segments were randomly selected from the first cast, eight from the second and seven from the third. Each selection was stratified by generation such that one third were selected from generations 1–7, one third from generations 8–14 and one third from generations 15–21. For both sets of images, diameters (ACD = 98%; BEF = 99%) were slightly more consistent than lengths (ACD = 96%; BEF = 96%). Child segments at the extreme of the imaging bore were lost, giving parent segments the appearance of being longer, thus contributing to greater variability in length measurements.
| Diameter | Length | |||||||
|---|---|---|---|---|---|---|---|---|
| SD | Variance | % Total Var | SD | Variance | % Total Var | |||
| ACD | Between segment variation | 3.3 | 10.8 | 98% | Between segment variation | 15.1 | 229.2 | 96% |
| Systematic between image variation | 0.0 | 0.0 | 0% | Systematic between image variation | 0.8 | 0.6 | 0% | |
| Segment-to-segment between image variation | 0.4 | 0.2 | 1% | Segment-to-segment between image variation | 2.9 | 8.6 | 4% | |
| Overall between image variation | 0.4 | 0.2 | 2% | Overall between image variation | 3.0 | 9.2 | 4% | |
| Total Variation | 3.3 | 11.0 | 100% | Total Variation | 15.4 | 238.4 | 100% | |
| SD | Variance | % Total Var | SD | Variance | % Total Var | |||
| BEF | Between segment variation | 4.9 | 23.9 | 99% | Between segment variation | 15.6 | 244.9 | 96% |
| Systematic between image variation | 0.0 | 0.0 | 0% | Systematic between image variation | 0.0 | 0.0 | 0% | |
| Segment-to-segment between image variation | 0.4 | 0.1 | 1% | Segment-to-segment between image variation | 3.3 | 11.1 | 4% | |
| Overall between image variation | 0.4 | 0.1 | 1% | Overall between image variation | 3.3 | 11.1 | 4% | |
| Total Variation | 4.9 | 24.1 | 100% | Total Variation | 16.0 | 256.0 | 100% | |
Acknowledgments
Financial support provided by NHLBI 1RO1 HL073598-01A
Financial support provided by the NIH National Heart, Blood and Lung Institute 1RO1 HL073598-01A
Footnotes
Note the original Raabe system consisted of 1’s and 2’s rather than 0’s and 1’s. While the difference between these two systems is superficial, we prefer to use 0’s and 1’s as they are more amenable to computer manipulation.
Note the actual resolution of the MR-data is 125 μm. However, at least two voxels across an airway were required to define a segment. Thus the practical resolution of the MR-data was 250 μm.
Here and for the rest of the discussion that follows, we distinguish between shifted path-length and path-length. Path-length is the absolute distance along the centerline from the trachea. Shifted path-length is the distance from the top of the branch after the branch has been shifted by si to align with the diameter of the main pathway.
The manual data is essentially multi-resolution as the objective of the optical micrometer can be changed along with the imaging plane in order to bring smaller and smaller details of the lung cast into focus.
References
- Bland JM, Altman DG. Statistical methods for assessing agreement between two methods of clinical measurement. Lancet. 1986;8:307–310. [PubMed] [Google Scholar]
- Bland JM, Altman DG. Measuring agreement in method comparison studies. Statistical Methods in Medical Research. 1999;8:135–160. doi: 10.1177/096228029900800204. [DOI] [PubMed] [Google Scholar]
- Chaturvedi A, Lee Z. Three-dimensional segmentation and skeletonization to build an airway tree data structure for small animals. Phys Med Biol. 2005;50:1405–1419. doi: 10.1088/0031-9155/50/7/005. [DOI] [PubMed] [Google Scholar]
- Dey TK, Sun J. Defining and Computing Curve-skeletons with Medial Geodesic Function. In: Fellner D, Spencer S, editors. Fourth Eurographics Symposium on Geometry Processing. Sardinia: Italy Eurographics Association; 2006. [Google Scholar]
- Fredberg JJ, editor. Airway dynamics: recursiveness, randomness, and reciprocity in linear system simulation and parameter estimation. New York: 1989. [Google Scholar]
- Fredberg JJ, Hoenig A. Mechanical response of the lungs at high frequencies. Journal of Biomechanical Engineering. 1978;100:57–66. [Google Scholar]
- Haefeli-Bleuer B, Weibel ER. Morphometry of the human pulmonary acinus. Anat Rec. 1988;220:401–414. doi: 10.1002/ar.1092200410. [DOI] [PubMed] [Google Scholar]
- Horsfield K, Dart G, Olson DE, Filley GF, Cumming G. Models of the human bronchial tree. J Appl Physiol. 1971;31:207–217. doi: 10.1152/jappl.1971.31.2.207. [DOI] [PubMed] [Google Scholar]
- Horsfield K, Woldenberg MJ. Branching ratio and growth of tree-like structures. Respir Physiol. 1986;63:97–107. doi: 10.1016/0034-5687(86)90033-2. [DOI] [PubMed] [Google Scholar]
- Jiang ZL, Kassab GS, Fung YC. Diameter-defined Strahler system and connectivity matrix of the pulmonary arterial tree. J Appl Physiol. 1994;76:882–892. doi: 10.1152/jappl.1994.76.2.882. [DOI] [PubMed] [Google Scholar]
- Karau KL, Molthen RC, Dhyani A, Haworth ST, Hanger CC, Roerig DL, Johnson RH, Dawson CA. Pulmonary arterial morphometry from microfocal X-ray computed tomography. Am J Physiol Heart Circ Physiol. 2001;281:H2747–2756. doi: 10.1152/ajpheart.2001.281.6.H2747. [DOI] [PubMed] [Google Scholar]
- Kassab GS. Scaling laws of vascular trees: of form and function. Am J Physiol Heart Circ Physiol. 2006;290:H894–903. doi: 10.1152/ajpheart.00579.2005. [DOI] [PubMed] [Google Scholar]
- Khamayseh A, Hansen G. Use of the spatial kD-tree in computational physics applications. Communications in Computational Physics. 2007;2:545–576. [Google Scholar]
- Kitaoka H, Suki B. Branching design of the bronchial tree based on a diameter-flow relationship. J Appl Physiol. 1997;82:968–976. doi: 10.1152/jappl.1997.82.3.968. [DOI] [PubMed] [Google Scholar]
- Kitaoka H, Takaki R, Suki B. A three-dimensional model of the human airway tree. J Appl Physiol. 1999;87:2207–2217. doi: 10.1152/jappl.1999.87.6.2207. [DOI] [PubMed] [Google Scholar]
- Kuprat A, Khamayseh A, George D, Larkey L. Volume Conserving Smoothing for Piecewise Linear Curves, Surfaces, and Triple Lines. Journal of Computational Physics. 2001;172:99–118. [Google Scholar]
- Kuprat AP, Einstein DR. An anisotropic scale-invariant unstructured mesh generator suitable for volumetric imaging data. Journal of Computational Physics. 2008 doi: 10.1016/j.jcp.2008.09.030. In Press. [DOI] [PMC free article] [PubMed] [Google Scholar]
- Majumdar A, Alencar AM, Buldyrev SV, Hantos Z, Lutchen KR, Stanley HE, Suki B. Relating airway diameter distributions to regular branching asymmetry in the lung. Phys Rev Lett. 2005;95:168101. doi: 10.1103/PhysRevLett.95.168101. [DOI] [PubMed] [Google Scholar]
- Mauroy B, Filoche M, Weibel ER, Sapoval B. An optimal bronchial tree may be dangerous. Nature. 2004;427:633–636. doi: 10.1038/nature02287. [DOI] [PubMed] [Google Scholar]
- Mautz WJ, Kleinman MT, Bhalla DK, Phalen RF. Respiratory tract responses to repeated inhalation of an oxidant and acid gas-particle air pollutant mixture. Toxicol Sci. 2001;61:331–341. doi: 10.1093/toxsci/61.2.331. [DOI] [PubMed] [Google Scholar]
- Menache MG, Patra AL, Miller FJ. Airway variablity in hte Long-Evans rat lung. Neuroscience and Biobehavioral Reviews. 1991;15:63–69. doi: 10.1016/s0149-7634(05)80093-4. [DOI] [PubMed] [Google Scholar]
- Metzger RJ, Klein OD, Martin GR, Krasnow MA. The branching programme of mouse lung development. Nature. 2008;453:745–750. doi: 10.1038/nature07005. [DOI] [PMC free article] [PubMed] [Google Scholar]
- Minard KR, Einstein DR, Jacob RE, Kabilan S, Kuprat AP, Timchalk CA, Trease LL, Corley RA. Application of magnetic resonance (MR) imaging for the development and validation of computational fluid dynamic (CFD) models of the rat respiratory system. Inhal Toxicol. 2006;18:787–794. doi: 10.1080/08958370600748729. [DOI] [PubMed] [Google Scholar]
- Molthen RC, Karau KL, Dawson CA. Quantitative models of the rat pulmonary arterial tree morphometry applied to hypoxia-induced arterial remodeling. J Appl Physiol. 2004;97:2372–2384. doi: 10.1152/japplphysiol.00454.2004. discussion 2354. [DOI] [PubMed] [Google Scholar]
- Moss OR, Wong VA. When nanoparticles get in the way: impact of projected area on in vivo and in vitro macrophage function. Inhal Toxicol. 2006;18:711–716. doi: 10.1080/08958370600747770. [DOI] [PubMed] [Google Scholar]
- Murray CD. The Physiological Principle of Minimum Work: I. The Vascular System and the Cost of Blood Volume. Proc Natl Acad Sci U S A. 1926a;12:207–214. doi: 10.1073/pnas.12.3.207. [DOI] [PMC free article] [PubMed] [Google Scholar]
- Murray CD. The Physiological Principle of Minimum Work: II. Oxygen Exchange in Capillaries. Proc Natl Acad Sci U S A. 1926b;12:299–304. doi: 10.1073/pnas.12.5.299. [DOI] [PMC free article] [PubMed] [Google Scholar]
- Oldham MJ, Phalen RF. Dosimetry implications of upper tracheobronchial airway anatomy in two mouse varieties. Anat Rec. 2002;268:59–65. doi: 10.1002/ar.10134. [DOI] [PubMed] [Google Scholar]
- Palagyi K, Tschirren J, Hoffman EA, Sonka M. Quantitative analysis of pulmonary airway tree structures. Comput Biol Med. 2006;36:974–996. doi: 10.1016/j.compbiomed.2005.05.004. [DOI] [PubMed] [Google Scholar]
- Palagyi K, Tschirren J, Sonka M. Quantitative analysis of intrathoracic airway trees: methods and validation. Inf Process Med Imaging. 2003;18:222–233. doi: 10.1007/978-3-540-45087-0_19. [DOI] [PubMed] [Google Scholar]
- Perry SF, Purohit AM, Boser S, Mitchell I, Green FH. Bronchial casts of human lungs using negative pressure injection. Experimental Lung Research. 2000;26:27–39. doi: 10.1080/019021400269943. [DOI] [PubMed] [Google Scholar]
- Phalen RF, Yeh HC, Schum GM, Raabe OG. Application of an idealized model to morphometry of the mammalian tracheobronchial tree. Anat Rec. 1978;190:167–176. doi: 10.1002/ar.1091900202. [DOI] [PubMed] [Google Scholar]
- Raabe OG, Yeh HC, Schum GM, Phalen RF. Tracheobronchial Geometry: Human, Dog, Rat, Hamster – A Compilation of Selected Data from the Project Respiratory Tract Deposition Models. Albuquerque, NM: Inhalation Toxicology Research Institute, Lovelace Foundation for Medical Education and Research; 1976. [Google Scholar]
- Rodriguez M, Bur S, Favre A, Weibel ER. Pulmonary Acinus: Geometry and Morphometry of the Peripheral Airway System in Rat and Rabbit. The Americal Journal of Anatomy. 1987;180:143–155. doi: 10.1002/aja.1001800204. [DOI] [PubMed] [Google Scholar]
- Sapoval B, Filoche M, Weibel ER. Smaller is better--but not too small: a physical scale for the design of the mammalian pulmonary acinus. Proc Natl Acad Sci U S A. 2002;99:10411–10416. doi: 10.1073/pnas.122352499. [DOI] [PMC free article] [PubMed] [Google Scholar]
- Sethian JA. Level set methods and fast marching methods. Cambridge: Cambridge University Press; 1996. [Google Scholar]
- Sydlik U, Bierhals K, Soufi M, Abel J, Schins RP, Unfried K. Ultrafine carbon particles induce apoptosis and proliferation in rat lung epithelial cells via specific signaling pathways both using EGF-R. Am J Physiol Lung Cell Mol Physiol. 2006;291:L725–733. doi: 10.1152/ajplung.00131.2006. [DOI] [PubMed] [Google Scholar]
- Team RDC. R: a language and environment for statistical computing. Vienna, Austria: Foundation for Statistical Computing; 2004. [Google Scholar]
- Tschirren J, Hoffman EA, McLennan G, Sonka M. Intrathoracic airway trees: segmentation and airway morphology analysis from low-dose CT scans. IEEE Trans Med Imaging. 2005a;24:1529–1539. doi: 10.1109/TMI.2005.857654. [DOI] [PMC free article] [PubMed] [Google Scholar]
- Tschirren J, Hoffman EA, McLennan G, Sonka M. Segmentation and quantitative analysis of intrathoracic airway trees from computed tomography images. Proc Am Thorac Soc. 2005b;2:484–487. 503–484. doi: 10.1513/pats.200507-078DS. [DOI] [PMC free article] [PubMed] [Google Scholar]
- Tschirren J, McLennan G, Palagyi K, Hoffman EA, Sonka M. Matching and anatomical labeling of human airway tree. IEEE Trans Med Imaging. 2005c;24:1540–1547. doi: 10.1109/TMI.2005.857653. [DOI] [PMC free article] [PubMed] [Google Scholar]
- Wang PM, Kraman SS. Fractal branching pattern of the monopodial canine airway. J Appl Physiol. 2004;96:2194–2199. doi: 10.1152/japplphysiol.00604.2003. [DOI] [PubMed] [Google Scholar]
- Weibel ER. Principles and methods for the morphometric study of the lung and other organs. Lab Invest. 1963;12:131–155. [PubMed] [Google Scholar]
- Weibel ER. Functional morphology of the growing lung. Respiration. 1970;27(Suppl):27–35. doi: 10.1159/000192716. [DOI] [PubMed] [Google Scholar]
- Yoo T. Insight into Images: Principles and Practice for Segmentation, Registration, and Image Analysis. AK Peters; 2004. [Google Scholar]
- Zhang L, Chapman BE, Parker DL, Roberts JA, Guo J, Vemuri P, Moon SM, Noo F. Automatic detection of three-dimensional vascular tree centerlines and bifurcations in high-resolution magnetic resonance angiography. Invest Radiol. 2005;40:661–671. doi: 10.1097/01.rli.0000178433.32526.e0. [DOI] [PubMed] [Google Scholar]


