Abstract
Diabetes mellitus (DM) is a widespread disease with high morbidity and health care costs. An experimental animal model was employed, using morphological and biochemical methods, to investigate the effects of DM on the expression and compartmentation of salivary gland proteins. The distribution of proline-rich proteins (PRP), submandibular mucin (Muc10) and the regulatory (RI and RII) subunits of cyclic AMP-dependent protein kinase type I and type II was determined in the parotid and submandibular (SMG) glands of rats treated with streptozotocin. Quantitative immunocytochemistry of secretory granules in diabetic glands revealed decreases of 30% for PRP in both the parotid and SMG, and a 40% decrease in Muc10 in the SMG. Immunogold labelling showed that RII decreased in nuclei and the cytoplasm in diabetic acinar cells while labelling of secretory granules was similar in control and diabetic parotid. Electrophoresis and Western blotting of tissue extracts of two secretory proteins showed that the response to DM and insulin treatment was gland specific: PRP showed little change in the SMG, but decreased in the parotid in DM and was partially restored after insulin treatment. Photoaffinity labelling showed only RI present in the SMG and mainly RII in the parotid. The results of this and previous studies demonstrating highly specific changes in salivary protein expression indicate that the oral environment is significantly altered by DM, and that oral tissues and their function can be compromised. These findings may provide a basis for future studies to develop tests using saliva for diabetic status or progression in humans.
Keywords: biochemistry, diabetes, immunocytochemistry, morphology, salivary proteins
Saliva, produced and secreted by the acinar cells of salivary glands and modified by the duct system, controls the oral environment and is critical for the health and maintenance of oral tissues, namely the teeth, gingiva and mucosa. This oral fluid contains a variety of proteins, glycoproteins and mucins, which have various functions in the oral cavity, including lubrication, antimicrobial activity, digestion, calcium phosphate homeostasis and enamel remineralization. Production and secretion of the constituents of saliva are under neural and hormonal regulation. Water and electrolyte secretion is controlled largely by the parasympathetic system, acting on muscarinic cholinergic receptors. Protein synthesis and secretion are regulated mainly by the sympathetic system, acting viaβ-adrenergic receptors.
Stimulation of β-adrenergic receptors activates adenylyl cyclase, increasing intracellular cyclic AMP levels and activating cyclic AMP-dependent protein kinase (PKA). Following PKA activation in parotid acinar cells, the regulatory and catalytic subunits undergo compartmental shifts (Mednieks & Hand 1982). Specific protein phosphorylation by PKA leads to exocytosis (Butcher & Putney 1980), as well as activation of transcription factors that regulate the expression of several salivary gland genes (Zhou et al. 1997). Chronic treatment of rodents with the β-adrenergic agonist isoproterenol results in decreased levels of amylase and parotid secretory protein (PSP) mRNA and protein (Poulsen et al. 1986; Kim et al. 1989; Vugman & Hand 1995), and increased synthesis of proline-rich protein (PRP) mRNA and protein (Fernandez-Sorensen & Carlson 1974; Mehansho et al. 1985) by parotid acinar cells. In the submandibular gland (SMG), chronic isoproterenol treatment causes increased synthesis of PRPs, cystatin and mucin, and decreased synthesis of glutamine/glutamic acid-rich protein (Humphreys-Beher 1985; Matsuura & Hand 1991; Bedi 1993).
Gene expression in salivary glands is also affected by insulin. Studies of the salivary glands in experimental type 1 diabetes mellitus (DM1) showed that amylase protein (Anderson 1983; Szczepanski et al. 1998) and mRNA levels (Kim et al. 1990) decreased about 50% in the rat parotid, and were restored by insulin treatment. Epidermal growth factor protein and mRNA levels are substantially reduced in diabetic mice (Kasayama et al. 1989). Other salivary proteins, such as the kallikrein-like proteases (Chan et al. 1993), PRPs and PSP (Szczepanski et al. 1998), also show modest decreases in diabetes. The levels of salivary peroxidase, however, increase approximately twofold in diabetes (Anderson & Shapiro 1979). The role of insulin in regulating the expression of other salivary proteins is largely unknown.
In humans, DM1 has significant deleterious effects in virtually all tissues. Oral complications of DM1 include an increased burden of mutans streptococci and lactobacilli and increased caries risk (Twetman et al. 2002; Syrjala et al. 2003;Bolgul et al. 2004), increased oral yeast counts (Karjalainen et al. 1997), increased mucosal abnormalities and infections (Guggenheimer et al. 2000) and increased frequency of periodontal disease (Löe & Genco 1995). Changes in salivary gland function include gland enlargement (Davidson et al. 1969; Donath & Seifert 1975), reduced salivary flow rates and altered composition (Ben-Aryeh et al. 1988;Rossie 1993; Moore et al. 2001; Mata et al. 2004).
Most studies of salivary glands in experimental diabetes have used the rat model of DM1 (Cutler et al. 1979; Anderson 1983; Hand & Weiss 1984; Lotti & Hand 1988; Szczepanski et al. 1998). These and other studies have shown significant morphological and functional changes in diabetic salivary glands, including altered secretory protein expression, accumulation of lipid droplets in secretory cells, decreased response to parasympathetic/cholinergic stimulation, increased autophagy and lysosomal activity, endocytosis of secretory proteins by duct cells and accumulation of basement membrane material.
This study was undertaken to examine the effects of DM1 on the expression and intracellular localization of selected secretory and regulatory proteins in the rat parotid and SMG. The proteins studied include PRPs, SMG mucin (Muc10) and the type I (RI) and type II (RII) regulatory subunits of PKA. The long-term goal was to identify secretory protein markers that will allow evaluation of specific cell types or cell functions that may be altered during the onset and progression of diabetes.
Methods
Animals
Viral antibody-free male NIA-Fischer 344 rats, 2–3 months old, were purchased from Harlan Industries (Indianapolis, IN, USA) and housed in plastic microisolator cages in the Center for Laboratory Animal Care, University of Connecticut Health Center (UCHC). Standard rat chow and water were provided ad libitum. All animal procedures were approved by the UCHC Animal Care Committee and carried out according to NIH guidelines.
Induction and monitoring of diabetes
The rats were randomly assigned to three groups: (i) diabetic, (ii) diabetic plus insulin treatment and (iii) control. Diabetes was induced by a single intraperitoneal injection of streptozotocin (STZ; Sigma Chemical Co., St Louis, MO, USA), 35–40 mg/kg body weight, in 0.01 M citrate buffer, pH 4.5. Control animals were either untreated or injected with citrate buffer. In initial experiments, no differences were observed between uninjected and vehicle-injected controls, thus the control animals included in this report were from the uninjected group. Three days after STZ administration, a drop of blood was obtained from the lateral tail vein, and the blood glucose level was determined using a One-Touch II glucometer (LifeScan, Milpitas, CA, USA). Thirty days after induction of diabetes, rats in the diabetic and control groups were killed for tissue collection. Rats in the diabetic plus insulin group were treated by subcutaneous injection of recombinant human (Lente) insulin (Novo Nordisk, Bagsvaerd, Denmark), 10 units/day, for 7 days. When the rats were killed, blood was obtained from the heart; blood glucose was determined using the hexokinase assay (Sigma) and serum was obtained for determination of insulin levels using a radioimmunoassay kit (ICN/MP Biomedicals, Irvine, CA, USA).
Morphological studies
The salivary glands were fixed by vascular perfusion of anaesthetized rats (Ketamine/Xylazine, 100 mg/10 mg per kg, or sodium pentobarbital, 50 mg/kg) with 1% glutaraldehyde (Polysciences, Warrington, PA, USA) in 0.1 M sodium cacodylate buffer, pH 7.4, via a cannula placed in the ascending aorta. After 5–10 min, the glands were excised and immersed in fresh fixative solution for 1 h at room temperature, rinsed in 0.1 M cacodylate buffer and stored at 4 °C until processing could be completed.
Small pieces of glutaraldehyde-fixed salivary gland tissue were postfixed in 1% osmium tetroxide-0.8% potassium ferricyanide in 0.1 M cacodylate buffer, pH 7.4, stained in block with 1% aqueous uranyl acetate, dehydrated in graded ethanols and embedded in PolyBed epoxy resin (Polysciences). Randomly selected tissue blocks from two animals at each time point were used to prepare sections for light and electron microscopic study. Thin sections were cut with a diamond knife, collected on 200-mesh copper/rhodium grids, stained with uranyl acetate and lead citrate and examined in either a Philips CM10 (Philips Electron Optics, Eindhoven, The Netherlands) or JEOL 100CX (JEOL Ltd., Tokyo, Japan) transmission electron microscope (TEM).
Immunogold labelling
The cellular localization and relative amounts of the rat salivary proteins were determined in the glands of control, diabetic and insulin-treated animals by electron microscopic immunogold labelling using published procedures (Hand 1995). Briefly, glutaraldehyde-fixed tissues were embedded in PolyBed resin without osmium postfixation and uranyl acetate block staining. Thin sections (approximately 70 nm) were collected on 200-mesh nickel grids, blocked with either bovine serum albumin (BSA)-normal serum in phosphate-buffered saline (PBS) or a mixture of ovalbumin, fish gelatin and Tween 20 in Tris-buffered saline (TBS) and incubated with primary antibody diluted in blocking solution. The primary antibodies used were a rabbit polyclonal antibody to rat PRP (Ziemer et al. 1982), a mouse monoclonal antibody to rat SMG mucin (Moreira et al. 1989) and a rabbit polyclonal antibody to rat salivary RII (Szczepanski et al. 1998; Mednieks et al. 2008). Following incubation with the primary antibody, the sections were rinsed with PBS, and then incubated with 10 or 15 nm gold-labelled goat anti-rabbit or anti-mouse IgG (Amersham, Arlington Heights, IL, USA). The sections were stained with uranyl acetate and lead citrate, and observed in the TEM.
To determine the intracellular concentration and distribution of the specific secretory proteins, cells were selected on the TEM viewing screen at low magnification, so that the gold particles were not visible. Photographs were then taken at a magnification of 10,000–16,000×, and the developed negatives were photographically enlarged and printed. The immunogold labelling density (gold particles/μm2) in secretory granules, nuclei and cytoplasm was quantitated on prints using a digitizing tablet and SigmaScan software (Jandel, Corte Madera, CA, USA). Non-specific binding was measured over areas of empty plastic adjacent to tissue. Statistical evaluation of the data was performed using one-way anova to determine if differences in labelling densities among control, diabetic and insulin-reconstituted samples were statistically significant. Specific differences between the sample means were tested for statistical significance using Bonferroni and Tukey post-hoc tests.
Biochemical analyses
Salivary glands were excised from anaesthetized rats, dissected free of surrounding fat and lymph nodes, frozen on dry ice and stored at −80 °C. The tissues were minced with scissors and homogenized with a Dounce homogenizer in 0.32 M sucrose, 0.05 M Tris–HCl, pH 7.5, 10−7 M MgCl2, containing protease inhibitors (1 μM phenylmethylsulphonyl fluoride/benzamidine) and then centrifuged at 600 g for 10 min. The operations were carried out at room temperature, but the tissues and tissue components were kept on ice.
Electrophoresis and Western blotting
In general, the analytical procedures were as described elsewhere (Szczepanski et al. 1998). Proteins were separated using denaturing polyacrylamide gel electrophoresis (PAGE), loading equivalent protein concentrations per lane of the soluble fraction (600xG supernatant), in a Minigel System (E-C Apparatus Corp., St. Petersburg, FL, USA) by modification of standard methods (Mednieks et al. 2008). Protein size in kilo Daltons (kDa) was determined by comparing the relative mobility of each band with the banding pattern of a coloured protein standard (Rainbow Markers, Amersham) of known molecular size. For Western blotting, a sample (12 μg) of commercial standards (Sigma) and proteins of the soluble fraction of rat parotid and SMG (20 μg total protein per lane) were separated using PAGE. The separated proteins were then transferred from the PAGE gel to a nitrocellulose (NC) membrane and specific proteins identified by Western blotting. The membrane was blocked with 1% BSA, incubated with antibody diluted at a ratio of 1:1000 with PBS, then with horseradish peroxidase-labelled goat anti-rabbit IgG and developed with diaminobenzidine-H2O2.
Photoaffinity labelling
The proteins of the 600xG supernatant fraction of the parotid and SMG were photoaffinity labelled with the cyclic AMP analogue, 32P-8-azido-cyclic AMP (ICN/MP), according to previously published methods (Haley 1977; Mednieks & Hand 1984; Mednieks et al. 1987)1 The labelled proteins were separated by modified methods of PAGE (Laemmli 1970; Mednieks et al. 2008) and transferred to NC membranes (Towbin et al. 1979). These membranes were stained with Coomassie Blue dye to show the banding pattern, and then exposed to X-Omat film (Kodak, Rochester, NY, USA) to identify radioactive bands by autoradiography. The films were scanned and the relative protein concentration per electrophoretic band was determined by densitometry of the digitized banding patterns compared with that of controls, using public domain software, NIH Image. Data were transferred to an EXCEL spread sheet and its software used for statistical analysis and graphing functions.
Results
Physiology and morphology
Physical observation and physiological tests confirmed that STZ injection resulted in symptoms of DM. Polydipsia, polyphagia and polyuria were seen in all diabetic rats, and the mean body weight of diabetic rats decreased 18.5% from the initial weight. One month after the induction of DM, the mean serum glucose level of diabetic rats was about 3.5 times greater than that of control animals (Table 1), and their mean serum insulin level was about 20% that of control rats. After insulin treatment for 7 days, the mean serum glucose level was still about 2.5-fold greater than that of control animals, while the mean serum insulin level was about 60% greater than in diabetic animals. Insulin treatment of diabetic animals led to an increase in body weight of about 13%. These results showed that the experimental animals were rendered diabetic by STZ, and were partially stabilized by the administration of insulin.
Table 1.
The effects of experimental diabetes and insulin treatment on serum glucose and insulin levels and body weight
| Group | Serum glucose g/dl ±SEM (n) | Serum insulin μU/ml ± SEM (n) | Body weight change % ± SEM (n) |
|---|---|---|---|
| Control | 167 ± 10.8 (6) | 58.9 ± 15.3 (3) | +15.3 ± 2.22 (6) |
| Diabetic | 605 ± 45.1 (15)* | 12.8 ± 1.25 (7) | −18.5 ± 2.57 (15)*† |
| Insulin-treated | 436 ± 46.2 (21)* | 20.7 ± 2.40 (7) | +12.8 ± 2.03 (8)*‡ |
Significantly different from control, P < 0.001.
Reduction in initial weight.
Increase in weight from diabetic to insulin-treated state.
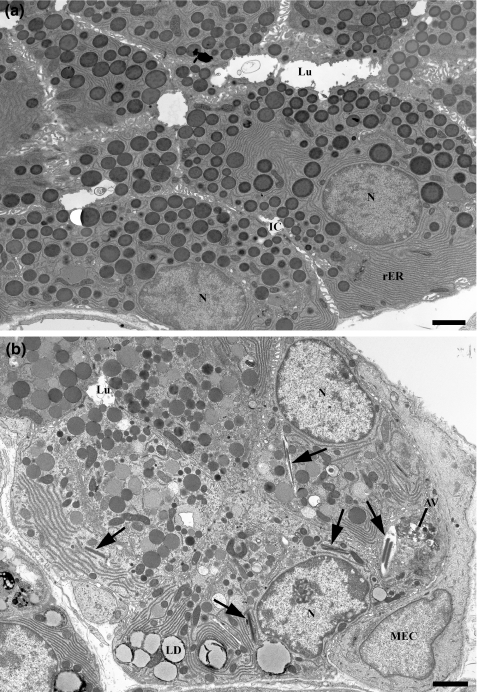
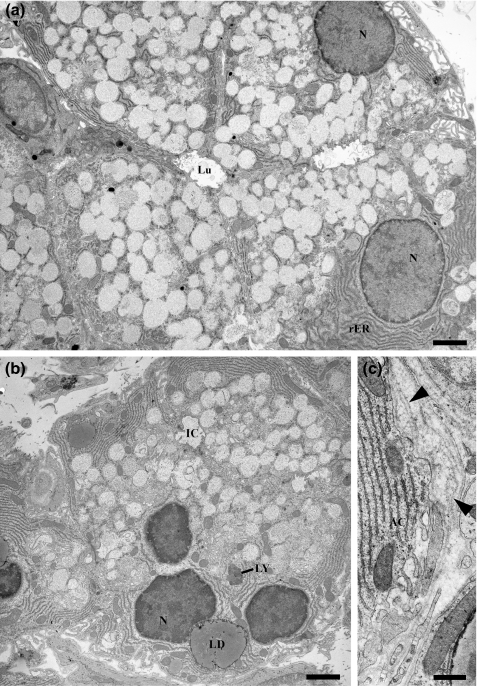
At the ultrastructural level, a number of morphological changes were evident in the parotid and SMG of diabetic rats. The abnormalities were similar to those described previously (Cutler et al. 1979; Anderson 1983; Hand & Weiss 1984). Compared with controls, the acinar cells of diabetic rats exhibited variability in the density and structure of secretory granules, increased numbers of lysosomes and autophagic vacuoles, lipid droplets in the basal cytoplasm and folding and redundancy of their basal laminae (Figures 1 and 2). Parotid acinar cells occasionally contained crystalloid structures that appeared to form within autophagic vacuoles (Figure 1), consistent with previous observations (Hand & Weiss 1984). Morphological changes in diabetic human salivary glands, generally classified as sialadenosis, include enlarged acinar cells, alterations in secretory granule density, accumulation of lipid droplets and degeneration of autonomic axons (Donath & Seifert 1975). Thus, the observed changes in oral tissues of the experimental animals are similar to the diabetes associated pathology reported in humans.
Figure 1.
Electron micrographs of control (a) and diabetic (b) parotid gland acinar cells. Control acinar cells show basally located nuclei (N) and abundant rough ER (rER), and numerous, dense, apically located secretory granules. Cells of diabetic animals contain secretory granules of variable density, basally located lipid droplets (LD), occasional crystalloid lysosomes (arrows) and autophagic vacuoles (AV). Lu, lumen; IC, intercellular canaliculus; MEC, myoepithelial cell. Scale bars = 2 μm.
Electron micrographs of control (a) and diabetic (b, c) SMG acinar cells. Control acinar cells show basally located nuclei and rough ER; the apical secretory granules have a light, flocculent content and occasionally fuse with their neighbours. Cells of diabetic animals contain basally located lipid droplets (LD) and occasional residual body-type lysosomes (LY). Thickening and redundancy of the basal lamina (arrowheads, panel c) occur in diabetic glands. AC, acinar cell; N, nucleus; Lu, lumen; IC, intercellular canaliculus. a and b, scale bars = 2 μm; C, scale bar = 0.5 μm.
Immunocytochemistry
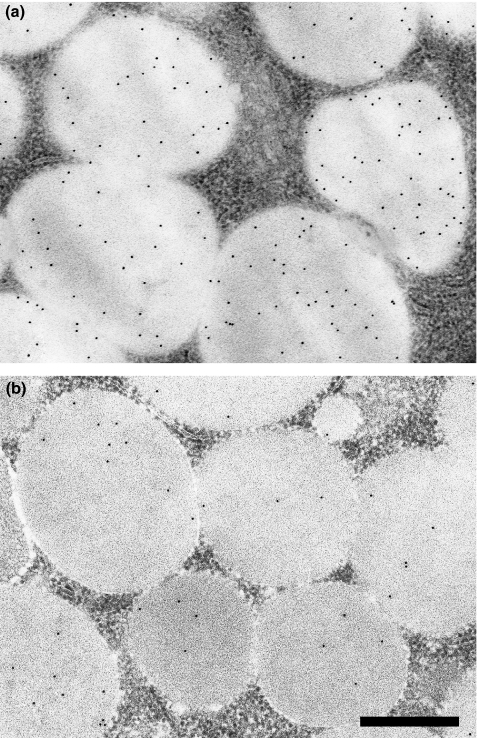
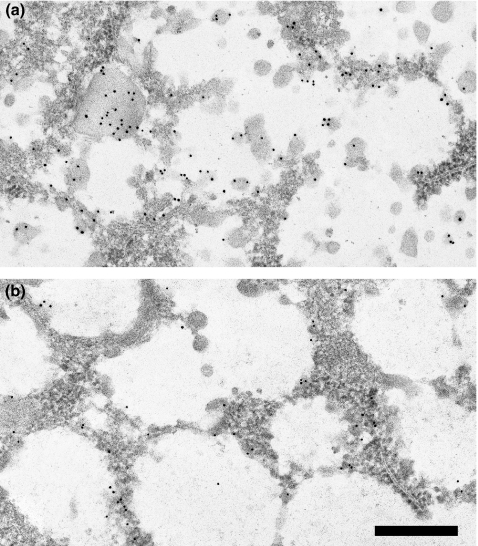
Immunocytochemical analyses provided an assessment of tissue and cellular protein localization and concentration. Immunogold labelling of thin sections with antibodies to acinar cell secretory proteins revealed changes in labelling densities of secretory granules in diabetic compared with control rats. As shown previously, labelling for amylase decreased about 50% in the diabetic parotid, compared with control (Lotti & Hand 1988; Szczepanski et al. 1998). Labelling for PRPs (Figure 3) was decreased approximately 30% in both the diabetic parotid and SMG (Table 2). Labelling for mucin (Muc10) (Figure 4) in the diabetic SMG was decreased approximately 40% (Table 2). Insulin reconstitution had little effect on labelling densities in the parotid or the SMG (Table 2). It should be noted that in previous experiments, insulin treatment effectively restored the amylase content of pancreatic zymogen granules from about 2% to approximately 60% of untreated control rats (Szczepanski et al. 1998).
Figure 3.
Immunogold labelling of control (a) and diabetic (b) parotid secretory granules with anti-PRP. Labelling density is decreased in diabetic glands. Scale bar = 0.5 μm.
Table 2.
Immunogold labelling densities of submandibular gland acinar secretory granules for mucin and PRP (gold particles/μm2)
| Group | Mucin | PRP |
|---|---|---|
| Control | 15.2 ± 1.00 (29)† | 31.8 ± 3.42 (30) |
| Diabetic | 8.85 ± 0.83 (10)* | 23.0 ± 1.75 (10) |
| Insulin-treated | 7.03 ± 0.44 (48)* | 26.6 ± 1.42 (50) |
Statistically different from control (P <0.001).
Mean value ± standard error (number of fields).
Figure 4.
Immunogold labelling of control (a) and diabetic (b) SMG acinar cell secretory granules with anti-mucin. Labelling density is decreased in diabetic glands. Most of the label is associated with small aggregates of the granule content. Scale bar = 0.5 μm.
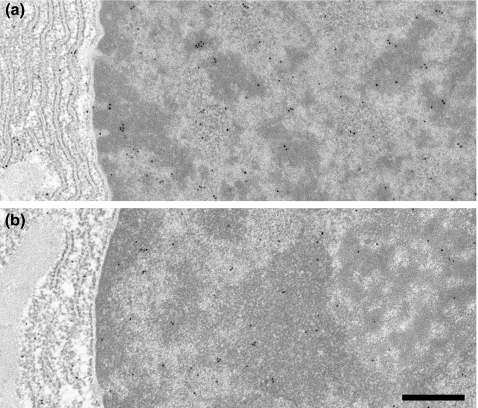
The distribution of PKA R subunits differs between the parotid and SMG. Immunogold labelling of secretory granules with antibody to RII was similar in control and diabetic parotids, whereas nuclear and cytoplasmic labelling was decreased in diabetic acinar cells. Insulin treatment decreased labelling of secretory granules, but partially restored nuclear and cytoplasmic labelling (Szczepanski et al. 1998). In the SMG, the RII labelling density of secretory granules was about one-tenth of that in the parotid, and showed a further decrease after insulin treatment (Table 3). Labelling of SMG acinar cell nuclei of control rats with anti-RII antibody was similar to that seen for the parotid gland, showed little change as a result of diabetes (Figure 5), but was significantly decreased following insulin treatment (Table 3). These findings indicate specific cell and gland responses to DM and to reconstitution with insulin.
Table 3.
Immunogold labelling densities of submandibular gland acinar secretory granules and nuclei for RII (gold particles/μm2)
| Group | Secretory granules | Nuclei |
|---|---|---|
| Control | 10.3 ± 0.66 (30)† | 17.2 ± 1.19 (30) |
| Diabetic | 8.32 ± 0.44 (10) | 13.3 ± 0.40 (10) |
| Insulin-treated | 6.80 ± 0.25 (50)* | 11.9 ± 0.56 (50)* |
Statistically different from control (P < 0.001).
Mean value ± standard error (number of fields).
Figure 5.
Immunogold labelling of control (a) and diabetic (b) SMG acinar cell nuclei with anti-RII. Labelling density appears slightly decreased in diabetic glands. Scale bar = 0.5 μm.
Electrophoresis, Western blotting and photoaffinity labelling
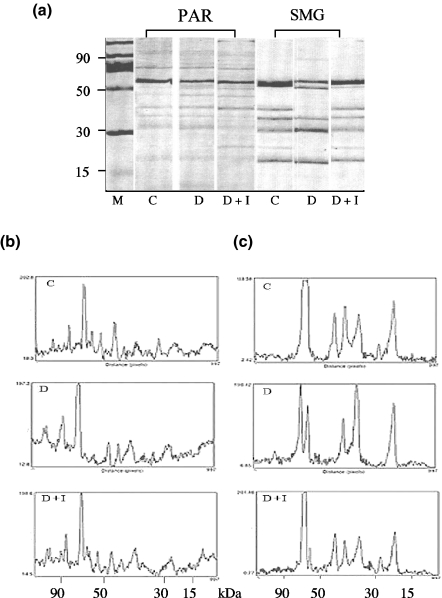
Separation of tissue proteins by electrophoresis was carried out to determine if DM results in molecular changes in salivary proteins. Parotid and SMG of animals with STZ-induced diabetes show marked differences in protein banding patterns compared with those of controls (Figure 6, panel a). The densitometric profiles in the parotid (Figure 6, panel b) revealed the complexity of the banding pattern and numerous changes. Notably, in the peaks of higher molecular size, >70 kDa, an accumulation of large molecular size proteins appeared in the diabetic compared with control, and returned to a control pattern after administration of insulin (Figure 6, panel b, sections C, D and D + I respectively).
Figure 6.
Electrophoretic banding patterns and densitometric analysis of salivary gland tissue. Panel (a) shows the electrophoretic protein banding patterns of SMG and parotid gland (PAR) tissue extracts. Identical protein amounts were loaded per lane and molecular size in kDa was determined as a function of relative mobility, compared with markers shown in lane M. Panels (b and c) are densitometric patterns of tissue extracts from parotid and SMG respectively. Peak height is representative of relative density measured in arbitrary units and shown on the ordinate of panels (b and c). Tissues from control, diabetic and diabetic reconstituted with insulin are labelled C, D and D + I respectively.
More dramatic changes were seen in the protein patterns of the SMG. In the high molecular size regions, >70 kDa, a large band appeared split in the diabetic, D, compared with control, C, and was restored to a single band by the administration of insulin, D + I (Figure 6, panel a). Densitometry of the SMG protein bands showed that in addition to the split main band, a great deal of heterogeneity resulted from experimental diabetes (Figure 6, panel c). Similarly, the median mobility range proteins, 30–70 kDa, were significantly altered where a triplet set of bands was converted to a doublet and back to a triplet after reconstitution with insulin. The SMG tissue extracts from the insulin reconstituted animals showed a return to the control pattern with only a very thin second band remaining as part of the major protein. These results indicate that salivary gland protein production is significantly affected by diabetes and that treatment with insulin largely restores the profiles to those of normal controls.
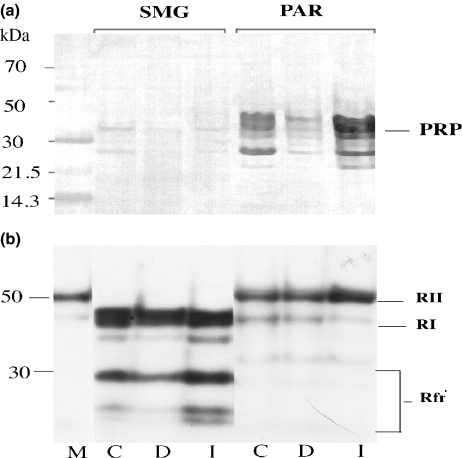
Salivary gland proteins PRP and R subunits of PKA, and their distribution in the SMG and parotid were identified using Western blotting and photoaffinity labelling respectively. Only small amounts of PRP were present in the SMG, whereas prominent bands of PRP were present in the parotid. A decrease of PRP occurred in the diabetic parotid compared with that in control, and a substantial increase after insulin treatment (Figure 7, panel a). Densitometric measurements of the Western blots confirmed the marked alteration of PRP in the parotid gland (Table 4); identical changes were seen in three consecutive experiments. In the SMG, PRP was not highly expressed and was largely unaffected by diabetes (Table 4).
Figure 7.
Identification of salivary gland proteins and their distribution in the SMG and parotid glands. PRPs and the R subunits of cyclic AMP-dependent protein kinase were identified using Western blotting and photoaffinity labelling respectively. Panel (a) shows that only trace amounts of PRP are present in SMG, whereas bands consistent with the mobility of PRP are present in the parotid with a decrease in the diabetic (D) compared with control (C) and substantial increase after insulin treatment (I), shown on the abscissa. Panel (b) shows the distribution of R subunits in the SMG to be exclusively RI and its fragments, while the parotid has RII with trace amounts of RI. In panel (a), the molecular sizes in kDa (left ordinate) were calculated from the relative mobilities of coloured markers (lane M). In panel b, lane M is a standard marker for RII (commercial reagent derived from bovine heart).
Table 4.
Western blotting analysis of submandibular and parotid gland tissue extracts; densitometric values for PRP
| Group | SMG | PAR |
|---|---|---|
| Control | 40.4 | 112.5 |
| Diabetic | 38.4 | 59.0 |
| Diab. + Ins. | 41.6 | 156.8 |
The densitometric values are in arbitrary units; data from one of three consecutive experiments in which the standard error did not vary more than ±5%.
Panel b, Figure 7, shows the distribution of R subunits using photoaffinity labelling to be predominantly RI in the SMG, while the parotid has mainly RII (with the same relative mobility as the commercial RII standard) and trace amounts of RI. The bands labelled RI, RII and Rfr in Figure 7, and the densitometric values shown in Table 5, are all R subunits of PKA or faster moving components, presumably proteolytic fragments of RI. These have cyclic AMP binding sites, indicated by 32P-labelled cyclic AMP covalently bound to the fragments by photolysis (see footnote in Methods). Table 5 shows that in the SMG, total RI subunit values were lower in DM compared with that in control, 186.28 vs. 102.2. There were no measurable amounts of RII in the SMG. In the parotid, differences in RII between control and diabetic glands were not significant.
Table 5.
Analysis of R subunits in salivary glands identified by photoaffinity labelling
| SMG |
Parotid |
|||
|---|---|---|---|---|
| R subunits | Control | Diabetic | Control | Diabetic |
| RII (50–55 kDa) | <5 | <5 | 123.23 | 150 |
| RI (45–49 kDa) | 186.28 | 102.2 | 15.10 | 9.4 |
| Rfr (20–40 kDa) | 203.08 | 63.10 | <5 | <5 |
| Rfr (15–19 kDa) | 103.31 | 38.18 | 0 | 0 |
| Rfr (<15 kDa) | 66.37 | 0 | 0 | 0 |
Measurement of relative densities of the individual bands on a representative autoradiogram was carried out using NIH Image. Data shown are from one of three consecutive experiments with the same findings. SMG showed no photoaffinity labelled cyclic AMP binding protein migrating with the mobility of RII. Conversely, parotid had only trace amounts of photoaffinity labelled cyclic AMP binding protein with the relative mobility of RI. Note: Photoaffinity labelling shows only proteins that have a covalently bound cyclic AMP analogue; therefore, the faster moving components are R subunit fragments.
The densitometric measurements of SMG R subunits showed a response to DM by apparent increases in fragments of RI (Table 5). The values for RII in the parotid were not changed when control and diabetic samples are compared. Reconstitution of the diabetic animals with insulin resulted in a large increase of RI and its fragments in the SMG compared with that in the normal as well as the diabetic (Figure 7). In the parotid, a significant increase in RII occurred in the insulin reconstituted diabetic. The effects of DM on a molecular level appear considerable, with significant changes in R subunits and an apparent increase in the formation of smaller molecular weight fragments in the SMG, and an increase in RII in the diabetic parotid supplemented with insulin.
Discussion
Effects of diabetes on salivary proteins
The present results and our previous findings indicate that a variety of important secretory proteins in the salivary glands are affected by STZ-induced DM. In the parotid, the expression of amylase, PRP and PSP is significantly reduced. In the SMG, PRP and mucin expression is reduced. Salivary amylase initiates the digestion of starches; DM-related reduction in salivary, as well as pancreatic amylase (Korc et al. 1981; Szczepanski et al. 1998), therefore, would tend to reduce the availability of glucose for absorption in the intestine. Members of the PRP family bind certain toxic dietary components, such as tannins, and reduce their absorption in the intestine (Bennick 2002). Acidic PRPs bind to the tooth surface as part of the salivary pellicle. By binding calcium, they help to maintain mineral homeostasis and promote enamel remineralization after initial caries attack (Van Nieuw Amerongen et al. 2004). PSP is a member of the PLUNC/LBP/BPI protein family, which recently has been shown to have antimicrobial and anti-inflammatory activity (Bingle & Gorr 2004). Mucins coat the oral tissues, provide lubrication and modulate the oral microbial flora (Tabak 1995). The reduced levels of these proteins would be expected to have deleterious effects on the digestive, antimicrobial and protective functions of saliva.
This study demonstrates significant differences in PKA R subunit expression in the parotid compared with that in the SMG, as well as differences in their response to DM and insulin treatment. In the SMG, the decrease in RII due to diabetes is not reversed by a 7-day treatment with insulin, whereas in the parotid, nuclear RII levels are partially restored. This indicates that the effects of insulin vary depending upon the tissue, cell type, organelle and specific protein.
Photoaffinity labelling, which identifies exclusively cyclic AMP binding molecules, showed mainly RII to be present in the parotid, whereas only RI and a considerable number of smaller size fragments were seen in the SMG. This may be due to a greater abundance of proteases in the SMG, particularly those released from the granular duct cells (Gresik 1994). Although no significant difference in total RII was seen in tissue extracts of the diabetic parotid, reduced RI in the diabetic SMG suggests that protein phosphorylation may be altered. In human and animal salivary glands, RII is present in secretory granules and is released into saliva (Mednieks & Hand 1982, 1984; Mednieks et al. 1987), where it may function to bind cyclic AMP in the oral cavity; changes due to DM thus may alter the oral environment.
Intracellular signalling, effects of diabetes
Insulin and cyclic AMP signalling responses are mediated by different pathways and generally are opposite in action. Nevertheless, like insulin, cyclic AMP regulates the transcription of many genes, several of which are also regulated by insulin (O’Brien & Granner 1996). Intracellular signalling involving cyclic AMP, initiated by binding of catecholamine or peptide hormones to cell surface G-protein-coupled receptors, such as β-adrenergic or glucagon receptors, regulates cell function. In many secretory cells, such as the salivary glands, cyclic AMP signalling regulates exocytosis (Butcher & Putney 1980).
Interactions of insulin with cyclic AMP signalling pathways include regulation of adenylyl cyclase and phosphodieserase activities, regulation of the activity and/or expression of several enzymes involved in glucose metabolism, regulation of the expression of several secretory proteins and stimulation or modulation of cell growth and differentiation. An example of the influence of insulin signalling on the cyclic AMP pathway is its effect on phosphodiesterase (PDE) activity. In diabetes, cyclic AMP PDE activity is decreased in adipocytes (Solomon 1975). Cyclic AMP accumulation after in vitroβ-adrenergic stimulation is greater in diabetic compared with that in control parotid acinar cells (Anderson & Bevan 1992). There also may be interaction of cyclic AMP and insulin at specific metabolic sites as has been shown in liver (Houslay 1986) and adipocytes (Ohsaka et al. 1997). As elevated cyclic AMP levels are associated with altered expression of amylase and other secretory proteins, the changes seen in salivary gland gene expression in diabetes, in addition to the direct effects of insulin, could reflect changes in cyclic AMP metabolism. Such changes can be monitored/followed by measuring the expression of cyclic AMP binding proteins. The changes in PKA R subunits due to DM may be a mechanism by which compromised β-adrenergic/cyclic AMP signalling affects salivary glands and other tissues.
The findings in this study indicate that the oral pathology encountered in human diabetes may be related to changes in the oral environment, which in turn may be the consequence of critical alterations of secretory protein synthesis and/or secretion. Modifications in specific (secretory) proteins as well as total protein electrophoretic banding patterns were shown to be significantly different in DM when compared with that in controls. As rat parotid glands are structurally (Riva & Riva-Testa 1973) and functionally (Nakamoto et al. 2007) similar to the human parotid, their use therefore as models in studies of structure/function modification may be applicable to human salivary physiology and disease.
Acknowledgments
We thank Ms Christine Pearson, Ms Mary Goss and Mr David Serwanski for their expert technical assistance. We are grateful to Drs D.M. Carlson and D.J. Culp for their generous gifts of antibodies. We also thank Dr Richard Jungmann for critically reading the manuscript. These studies were supported in part by NIH DE10105 and the University of Connecticut Health Center.
Footnotes
References
- Anderson LC. Effects of alloxan diabetes on rat parotid gland and saliva. Am. J. Physiol. 1983;245:G431–G437. doi: 10.1152/ajpgi.1983.245.3.G431. [DOI] [PubMed] [Google Scholar]
- Anderson LC, Bevan CA. Effects of streptozotocin diabetes on amylase release and cAMP accumulation in rat parotid acinar cells. Arch. Oral Biol. 1992;37:331–336. doi: 10.1016/0003-9969(92)90014-y. [DOI] [PubMed] [Google Scholar]
- Anderson LC, Shapiro BL. The effect of alloxan diabetes and insulin in vivo on peroxidase activity in the rat submandibular gland. Arch. Oral Biol. 1979;24:343–345. doi: 10.1016/0003-9969(79)90100-6. [DOI] [PubMed] [Google Scholar]
- Bedi GS. The effect of adrenergic agonists and antagonists on the expression of proteins in rat submandibular and parotid glands. Crit. Rev. Oral Biol. Med. 1993;4:565–571. doi: 10.1177/10454411930040034301. [DOI] [PubMed] [Google Scholar]
- Ben-Aryeh H, Cohen M, Kanter Y, Szargel R, Laufer D. Salivary composition in diabetic patients. J. Diabet. Complications. 1988;2:96–99. doi: 10.1016/0891-6632(88)90011-6. [DOI] [PubMed] [Google Scholar]
- Bennick A. Interaction of plant polyphenols with salivary proteins. Crit. Rev. Oral Biol. Med. 2002;13:184–196. doi: 10.1177/154411130201300208. [DOI] [PubMed] [Google Scholar]
- Bingle CD, Gorr SU. Host defense in oral and airway epithelia: chromosome 20 contributes a new protein family. Int. J. Biochem. Cell Biol. 2004;36:2144–2152. doi: 10.1016/j.biocel.2004.05.002. [DOI] [PubMed] [Google Scholar]
- Bolgul BS, Celenk S, Ayna BE, Atakul F, Uysal E. Evaluation of caries risk factors and effects of a fluoride-releasing adhesive material in children with insulin-dependent diabetes mellitus (IDDM): initial first-year results. Acta Odontol. Scand. 2004;62:289–292. doi: 10.1080/00016350410001766. [DOI] [PubMed] [Google Scholar]
- Butcher FR, Putney JW., Jr Regulation of parotid gland function by cyclic nucleotides and calcium. Adv. Cyclic Nucleotide Res. 1980;13:215–249. [PubMed] [Google Scholar]
- Chan KM, Chao J, Proctor GB, Garrett JR, Shori DK, Anderson LC. Tissue kallikrein and tonin levels in submandibular glands of STZ-induced diabetic rats and the effects of insulin. Diabetes. 1993;42:113–117. doi: 10.2337/diab.42.1.113. [DOI] [PubMed] [Google Scholar]
- Cutler LS, Pinney HE, Christian C, Russotto SB. Ultrastructural studies of the rat submandibular gland in streptozotocin induced diabetes mellitus. Virchows Arch. A Pathol. Anat. Histol. 1979;382:301–311. doi: 10.1007/BF00430406. [DOI] [PubMed] [Google Scholar]
- Davidson D, Leibel BS, Berris B. Asymptomatic parotid gland enlargement in diabetes mellitus. Ann. Intern. Med. 1969;70:31–38. doi: 10.7326/0003-4819-70-1-31. [DOI] [PubMed] [Google Scholar]
- Donath K, Seifert G. Ultrastructural studies of the parotid glands in sialadenosis. Virchows Archiv (Pathol. Anat.) 1975;365:119–135. doi: 10.1007/BF00432384. [DOI] [PubMed] [Google Scholar]
- Fernandez-Sorensen A, Carlson DM. Isolation of a “proline-rich” protein from rat parotid glands following isoproterenol treatment. Biochem. Biophys. Res. Commun. 1974;60:249–256. doi: 10.1016/0006-291x(74)90198-3. [DOI] [PubMed] [Google Scholar]
- Gresik EW. The granular convoluted tubule (GCT) cell of rodent submandibular glands. Microsc. Res. Tech. 1994;27:1–24. doi: 10.1002/jemt.1070270102. [DOI] [PubMed] [Google Scholar]
- Guggenheimer J, Moore PA, Rossie K, et al. Insulin-dependent diabetes mellitus and oral soft tissue pathologies. I. Prevalence and characteristics of non-candidal lesions. Oral Surg. Oral Med. Oral Pathol. Oral Radiol. Endod. 2000;89:563–569. doi: 10.1067/moe.2000.104476. [DOI] [PubMed] [Google Scholar]
- Haley BE. Adenosine 3′,5′-cyclic monophosphate binding sites. Methods Enzymol. 1977;46:339–346. doi: 10.1016/s0076-6879(77)46039-7. [DOI] [PubMed] [Google Scholar]
- Hand AR. Electron microscopy. In: Glasel JA, Deutscher M, editors. Introduction to Biophysical Methods for Protein and Nucleic Acid Research. New York: Academic Press; 1995. pp. 205–260. [Google Scholar]
- Hand AR, Weiss RE. Effects of streptozotocin-induced diabetes on the rat parotid gland. Lab. Invest. 1984;51:429–440. [PubMed] [Google Scholar]
- Houslay MD. Insulin, glucagon and the receptor-mediated control of cyclic AMP concentrations in liver. Biochem. Soc. Trans. 1986;14:183–193. doi: 10.1042/bst0140183. [DOI] [PubMed] [Google Scholar]
- Humphreys-Beher MG. Strain-specific differences in the proline-rich proteins and glycoproteins induced in rat salivary glands by chronic isoprenaline treatment. Biochem. J. 1985;230:369–378. doi: 10.1042/bj2300369. [DOI] [PMC free article] [PubMed] [Google Scholar]
- Karjalainen KM, Knuuttila ML, Kaar ML. Relationship between caries and level of metabolic balance in children and adolescents with insulin-dependent diabetes mellitus. Caries Res. 1997;31:13–18. doi: 10.1159/000262367. [DOI] [PubMed] [Google Scholar]
- Kasayama S, Ohba Y, Oka T. Epidermal growth factor deficiency associated with diabetes mellitus. Proc. Natl Acad. Sci. U.S.A. 1989;86:7644–7648. doi: 10.1073/pnas.86.19.7644. [DOI] [PMC free article] [PubMed] [Google Scholar]
- Kim SK, Jones TP, Cuzzort LM. Protein synthesis and amylase messenger RNA content in rat parotid salivary glands after total or partial stimulation with isoproterenol. Arch. Oral Biol. 1989;34:895–901. doi: 10.1016/0003-9969(89)90147-7. [DOI] [PubMed] [Google Scholar]
- Kim SK, Cuzzort LM, McKean RK, Allen ED. Effects of diabetes and insulin on alpha-amylase messenger RNA levels in rat parotid glands. J. Dent. Res. 1990;69:1500–1504. doi: 10.1177/00220345900690081001. [DOI] [PubMed] [Google Scholar]
- Korc M, Owerbach D, Quinto C, Rutter WJ. Pancreatic islet acinar cell interaction: amylase messenger RNA levels are determined by insulin. Science. 1981;213:351–353. doi: 10.1126/science.6166044. [DOI] [PubMed] [Google Scholar]
- Laemmli UK. Cleavage of structural proteins during the assembly of the head of bacteriophage T4. Nature. 1970;227:680–685. doi: 10.1038/227680a0. [DOI] [PubMed] [Google Scholar]
- Löe H, Genco RJ. Diabetes in America. 2nd edn. Washington, DC: NIH Publication No. 95-1468; 1995. Oral complication in diabetes; pp. 501–506. [Google Scholar]
- Lotti LV, Hand AR. Endocytosis of parotid salivary proteins by striated duct cells in streptozotocin-diabetic rats. Anat. Rec. 1988;221:802–811. doi: 10.1002/ar.1092210404. [DOI] [PubMed] [Google Scholar]
- Mata AD, Marques D, Rocha S, et al. Effects of diabetes mellitus on salivary secretion and its composition in the human. Mol. Cell. Biochem. 2004;261:137–142. doi: 10.1023/b:mcbi.0000028748.40917.6f. [DOI] [PubMed] [Google Scholar]
- Matsuura S, Hand AR. Quantitative immunocytochemistry of rat submandibular secretory proteins during chronic isoproterenol administration and recovery. J. Histochem. Cytochem. 1991;39:945–954. doi: 10.1177/39.7.1865112. [DOI] [PubMed] [Google Scholar]
- Mednieks MI, Hand AR. Cyclic AMP-dependent protein kinase in stimulated rat parotid gland cells: compartmental shifts after in vitro treatment with isoproterenol. Eur. J. Cell Biol. 1982;28:264–271. [PubMed] [Google Scholar]
- Mednieks MI, Hand AR. Cyclic AMP binding proteins in saliva. Experientia. 1984;40:945–947. doi: 10.1007/BF01946451. [DOI] [PubMed] [Google Scholar]
- Mednieks MI, Jungmann RA, Hand AR. Ultrastructural immunocytochemical localization of cyclic AMP-dependent protein kinase regulatory subunits in rat parotid acinar cells. Eur. J. Cell Biol. 1987;44:308–317. [PubMed] [Google Scholar]
- Mednieks M, Lin M, Hand AR. Immunocytochemical analysis of cyclic AMP receptor proteins in the developing rat parotid gland. Arch. Oral Biol. 2008;53:429–436. doi: 10.1016/j.archoralbio.2007.11.012. [DOI] [PubMed] [Google Scholar]
- Mehansho H, Clements S, Sheares BT, Smith S, Carlson DM. Induction of proline-rich glycoprotein synthesis in mouse salivary glands by isoproterenol and by tannins. J. Biol. Chem. 1985;260:4418–4423. [PubMed] [Google Scholar]
- Moore PA, Guggenheimer J, Etzel KR, Weyant RJ, Orchard T. Type 1 diabetes mellitus, xerostomia, and salivary flow rates. Oral Surg. Oral Med. Oral Pathol. Oral Radiol. Endod. 2001;92:281–291. doi: 10.1067/moe.2001.117815. [DOI] [PubMed] [Google Scholar]
- Moreira JE, Tabak LA, Bedi GS, Culp DJ, Hand AR. Light and electron microscopic immunolocalization of rat submandibular gland mucin glycoprotein and glutamine/glutamic acid-rich proteins. J. Histochem. Cytochem. 1989;37:515–528. doi: 10.1177/37.4.2926128. [DOI] [PubMed] [Google Scholar]
- Nakamoto T, Srivastava A, Romanenko VG, et al. Functional and molecular characterization of the fluid secretion mechanism in human parotid acinar cells. Am. J. Physiol. Regul. Integr. Comp. Physiol. 2007;292:R2380–R2390. doi: 10.1152/ajpregu.00591.2006. [DOI] [PubMed] [Google Scholar]
- O’Brien RM, Granner DK. Regulation of gene expression by insulin. Physiol. Rev. 1996;76:1109–1161. doi: 10.1152/physrev.1996.76.4.1109. [DOI] [PubMed] [Google Scholar]
- Ohsaka Y, Tokumitsu Y, Nomura Y. Suppression of insulin-stimulated phosphatidylinositol 3-kinase activity by the beta3-adrenoceptor agonist CL316243 in rat adipocytes. FEBS Lett. 1997;402:246–250. doi: 10.1016/s0014-5793(97)00007-0. [DOI] [PubMed] [Google Scholar]
- Poulsen K, Jakobsen BK, Mikkelsen BM, Harmark K, Nielsen JT, Hjorth JP. Coordination of murine parotid secretory protein and salivary amylase expression. EMBO J. 1986;5:1891–1896. doi: 10.1002/j.1460-2075.1986.tb04441.x. [DOI] [PMC free article] [PubMed] [Google Scholar]
- Riva A, Riva-Testa F. Fine structure of acinar cells of human parotid gland. Anat. Rec. 1973;176:149–165. doi: 10.1002/ar.1091760204. [DOI] [PubMed] [Google Scholar]
- Rossie K. Influence of diseases on salivary glands. In: Dobrosielski-Vergona K, editor. Biology of the Salivary Glands. Boca Raton, FL: CRC Press; 1993. pp. 201–238. [Google Scholar]
- Solomon SS. Effect of insulin and lipolytic hormones on cyclic AMP phosphodieterase activity in normal and diabetic rat adipose tissue. Endocrinology. 1975;96:1366–1373. doi: 10.1210/endo-96-6-1366. [DOI] [PubMed] [Google Scholar]
- Syrjala AM, Niskanen MC, Ylostalo P, Knuuttila ML. Metabolic control as a modifier of the association between salivary factors and dental caries among diabetic patients. Caries Res. 2003;37:142–147. doi: 10.1159/000069020. [DOI] [PubMed] [Google Scholar]
- Szczepanski A, Mednieks MI, Hand AR. Expression and distribution of parotid secretory proteins in experimental diabetes. Eur. J. Morphol. 1998;36(Suppl.):240–246. [PubMed] [Google Scholar]
- Tabak LA. In defense of the oral cavity: structure, biosynthesis, and function of salivary mucins. Annu. Rev. Physiol. 1995;57:547–564. doi: 10.1146/annurev.ph.57.030195.002555. [DOI] [PubMed] [Google Scholar]
- Towbin H, Staehelin T, Gordon J. Electrophoretic transfer of proteins from polyacrylamide gels to nitrocellulose sheets: procedure and some applications. Proc. Natl Acad. Sci. U.S.A. 1979;76:4350–4354. doi: 10.1073/pnas.76.9.4350. [DOI] [PMC free article] [PubMed] [Google Scholar]
- Twetman S, Johansson I, Birked D, Nederfors T. Caries incidence in young type 1 diabetes mellitus patients in relation to metabolic control and caries-associated risk factors. Caries Res. 2002;36:31–35. doi: 10.1159/000057587. [DOI] [PubMed] [Google Scholar]
- Van Nieuw Amerongen A, Bolscher JG, Veerman EC. Salivary proteins: protective and diagnostic value in cariology? Caries Res. 2004;38:247–253. doi: 10.1159/000077762. [DOI] [PubMed] [Google Scholar]
- Vugman I, Hand AR. Quantitative immunocytochemical study of secretory protein expression in parotid glands of rats chronically treated with isoproterenol. Microsc. Res. Tech. 1995;31:106–117. doi: 10.1002/jemt.1070310203. [DOI] [PubMed] [Google Scholar]
- Zhou J, Wright PS, Wong E, Jessen K, Morand JN, Carlson DM. Cyclic AMP regulation of mouse proline-rich protein gene expression: isoproterenol induction of AP-1 transcription factors in parotid glands. Arch. Biochem. Biophys. 1997;338:97–103. doi: 10.1006/abbi.1996.9801. [DOI] [PubMed] [Google Scholar]
- Ziemer MA, Mason A, Carlson DM. Cell-free translations of proline-rich protein mRNAs. J. Biol. Chem. 1982;257:11176–11180. [PubMed] [Google Scholar]


