Abstract
Hydrophobicity is often characterized macroscopically by the droplet contact angle. Molecular signatures of hydrophobicity have, however, remained elusive. Successful theories predict a drying transition leading to a vapor-like region near large hard-sphere solutes and interfaces. Adding attractions wets the interface with local density increasing with attractions. Here we present extensive molecular simulation studies of hydration of realistic surfaces with a wide range of chemistries from hydrophobic (−CF3, −CH3) to hydrophilic (−OH, −CONH2). We show that the water density near weakly attractive hydrophobic surfaces (e.g., −CF3) can be bulk-like or larger, and provides a poor quantification of surface hydrophobicity. In contrast, the probability of cavity formation or the free energy of binding of hydrophobic solutes to interfaces correlates quantitatively with the macroscopic wetting properties and serves as an excellent signature of hydrophobicity. Specifically, the probability of cavity formation is enhanced in the vicinity of hydrophobic surfaces, and water–water correlations correspondingly display characteristics similar to those near a vapor–liquid interface. Hydrophilic surfaces suppress cavity formation and reduce the water–water correlation length. Our results suggest a potentially robust approach for characterizing hydrophobicity of more complex and heterogeneous surfaces of proteins and biomolecules, and other nanoscopic objects.
Keywords: hydration, hydrophilic, hydrophobic, wetting, fluctuations
Hydrophobicity, reflected in the low solubility of nonpolar solutes or in their tendency to aggregate in water, is known to play an important role in many biological and colloidal self-assembly processes (1–4). Yet defining it precisely is challenging, and its molecular signatures remain unclear. Macroscopically, hydrophobicity is often characterized by measuring the droplet contact angle, with surfaces showing angles greater than 90° termed hydrophobic. Water beads up into droplets on hydrophobic surfaces and spreads on hydrophilic ones. Translating these ideas into the molecular domain presents special challenges. In a recent perspective, Granick and Bae (5) highlight the ambiguity in defining hydrophobicity at molecular length scales, such as near proteins or nanotubes, where droplet contact angle measurements are not possible.
At the molecular level, hard-sphere solutes have served as excellent models for studies of hydrophobicity, with their hydration thermodynamics capturing the solubility of noble gases as a function of temperature (6, 7), pressure (8), and salt addition (9, 10). With increasing solute length scale, the elegant theory by Lum, Chandler, and Weeks (11) as well as computer simulations (12, 13) predict a gradual dewetting of the solute. Near large solutes or a hard-wall, water density is small and vapor-like, and the wall–water interface resembles a water vapor–liquid interface (14).
Realistic solutes exert van der Waals and/or electrostatic interactions and pull the water interface closer, wetting the solute surface (12, 15–18). The extent of wetting depends on the strength of attraction and on the local surface curvature or roughness. Does the local density of water alone serve as a practical and quantitative measure of hydrophobicity of realistic surfaces? More generally, what are the molecular signatures of vicinal water that characterize the hydrophobicity or hydrophilicity of a given surface? At a vapor–liquid interface, water displays capillary wave fluctuations with macroscopic correlation lengths (19, 20). How are the vicinal water-density fluctuations and correlation lengths affected by interactions with a surface?
Answering these questions is fundamental to understanding and characterizing hydrophobicity at the molecular level. We report results of extensive simulations of hydration of interfaces with varying chemistries from hydrophobic to hydrophilic. The local density profiles of water near these surfaces highlight the difficulty of unambiguously characterizing the extent of dewetting at these surfaces. In contrast, other interfacial properties such as the probability of void formation or the free energy of probe-binding provide a picture of hydrophobicity that is consistent with macroscopic views. Normalized density fluctuations and the corresponding water–water correlation lengths are larger near hydrophobic surfaces and are suppressed with increasing surface hydrophilicity. Collectively, our study offers new insights into the hydration of interfaces by providing the missing connections between microscopic and macroscopic characterizations of wetting phenomena in general, and hydrophobicity in particular.
Results and Discussion
Correlating the Vicinal Water Density and the Interfacial Width with Macroscopic Wetting.
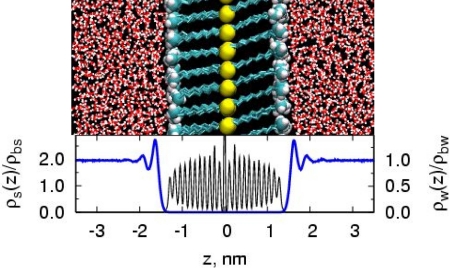
We focused on characterizing the properties of water in the vicinity of flat solid surfaces with varying chemistries. As described in ref. 21 and in Materials and Methods, we prepared solid surfaces by using self-assembled monolayers (SAMs) of alkane-thiol surfactants, with 10-carbon-long alkane tails, presenting a given head group to the vicinal aqueous phase (see Fig. 1). Two such SAM layers form the central slab in the periodic box. We used seven different head groups that span a range of chemistries from hydrophobic to hydrophilic: −CF3, −CH3, −OCH3, −CONHCH3, −CH2CN, −OH, and −CONH2. Thermal annealing of the SAM yielded an equilibrium crystalline structure with an average surfactant tilt angle of ≈28° with the surface normal, consistent with previous simulation (22) and experimental (23) studies. The density profile for surfactant atoms in Fig. 1 reflects the crystalline nature of the SAM surface, with different head groups making differences to that profile primarily in the outermost region. Hydration of these surfaces was then studied by using extensive molecular dynamics simulations (see Materials and Methods).
Fig. 1.
The SAM water system. (Upper) A snapshot of the −CH3 SAM system. The sulfur atoms (yellow) and surfactant head groups (cyan and white) are shown in spacefill representation. The alkane tail (cyan) and water (red and white) are shown with sticks. (Lower) Average density of SAM and water phases normal to the surface divided by their respective bulk densities (ρbs = 935 kg/m3 and ρbw = 985 kg/m3). The SAM bulk density was calculated by averaging over the region excluding the sulfur and head group atoms.
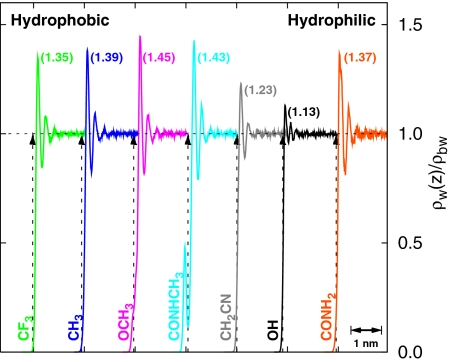
How does the surface chemistry affect the vicinal water density? Fig. 2 shows that water molecules stack against all surfaces, including hydrophobic ones (24), forming well-defined first- and second-hydration shells. A careful observation reveals that the detailed molecular shape and chemistry (e.g., the presence of buried polar atoms) of the head groups affect the vicinal density. For example, a slight shoulder (for −OCH3) and an inner short first peak (for −CONHCH3) are observed at small separations. The height of the first peak is ≈1.35 for the most hydrophobic SAM (−CF3) and is ≈1.13/1.37 for the most hydrophilic (−OH/−CONH2) SAM surfaces. The water density in the vicinity of simple solutes is known to be proportional to the strength of solute–water attractions, although the exact nature of that relationship depends on the details of the solute [e.g., size, or particle density if the solute is a cluster made from smaller solutes (17)]. Here, surprisingly, the vicinal water density as characterized by the height of the first peak displays little or no correlation with “macroscopic expectations” of the hydrophobicity of these surfaces. Proximal density instead of spatial density will likely display a better correlation (25, 26); however, its calculation for geometrically rough surfaces can be rather complicated, and experiments do not measure proximal density. The lack of a correlation between water density and hydrophobicity reflects the complexities present in realistic systems arising from different molecular topologies and different head group water interactions. It also highlights and probably rationalizes the difficulty in obtaining unambiguous conclusions from experiments regarding wetting/dewetting of realistic hydrophobic interfaces (27–35).
Fig. 2.
Water density near various surfaces. Mass density of water normal to the surface divided by its bulk value. The profiles are shifted horizontally for clarity. The vertical dashed lines with arrows indicate the location of intersection of surfactant and water-density profiles. The height of the first peak is indicated near the peak location.
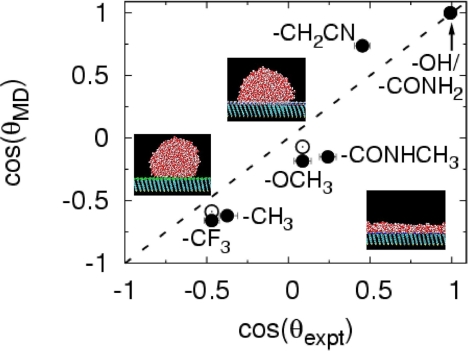
The term “macroscopic expectations” above refers to droplet contact angles measured experimentally for these surfaces (36). Characterization of surfaces using contact angle measurements for nanoscale droplets has been reported previously (37). Giovambattista et al., have studied the variation of contact angle and other properties of water with increasing surface hydrophilicity (38). To test whether the force field used to describe the SAMs is reasonable, we measured droplet contact angles by using molecular dynamics simulations (Fig. 3) (21). The droplets indeed bead up on hydrophobic surfaces and spread gradually on surfaces with increasing hydrophilicity. We note that the contact angle for nanodroplets is known to be drop-size-dependent (39–41). The agreement between simulations and experiments in Fig. 3 is good and improves further for two surfaces, for which we obtained the limiting values of cos(θ) using droplet-size-dependent simulations (21). Thus, our force field is reasonable, and correspondingly, the surfaces span a broad range of hydrophobicity/hydrophilicity. These results strengthen the conclusion drawn above that for realistic surfaces, the magnitude of vicinal water density alone is a poor indicator of surface hydrophobicity.
Fig. 3.
Characterizing wetting of interfaces. Comparison of cos(θ) measured in our simulations (21) and in experiments (36). Snapshots of water droplets on nonwetting (−CF3), partially wetting (−CONHCH3), and wetting (−OH) SAMs are shown. Filled circles are for nanodroplets with diameter ≈5 nm (2,176 molecules); open circles are extrapolations to the macroscopic limit from drop-size-dependent simulations.
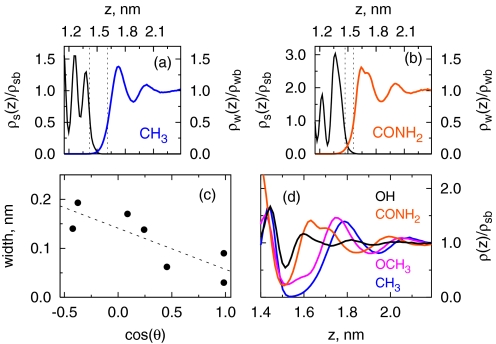
Although a number of experimental tools including X-ray (27–31) and neutron reflectivity (32, 33), ellipsometry (34), and thermal conductivity (35) have been used to probe the width of the “depletion layer” at a hydrophobic surface, a clear picture has not yet emerged from these measurements (42). Fig. 4 A and B show close-up views of the normalized density profiles of SAM and water in the interfacial region. The distance between the two half-density planes provides one measure of the interfacial width. That width is indeed higher for the hydrophobic −CF3 surface (≈0.15 nm) and lower for the hydrophilic −CONH2 surface (≈0.09 nm), indicating a correlation between width and cos(θ) (Fig. 4C). But the correlation is weak, and the widths (≈1–2 Å) are smaller than the size of a water molecule.
Fig. 4.
Characterizing interfacial width. (A and B) Density profiles of water and SAM in −CF3 and −CONH2 systems, respectively. Intercalation of water in the rough −CONH2 surface is seen in B. The dotted lines indicate locations of half density planes for SAM and water. The distance between these planes characterizes the interfacial width, and is shown in C as a function of experimental cos(θ). D shows total (SAM+water) density profiles for four surfaces.
Fig. 4 A and B also suggest that the total density of SAM and water phases through the interfacial region may correlate better with surface hydrophobicity. Indeed, Fig. 4D indicates that the total density profile displays a broad and deep minimum at hydrophobic surfaces, whereas hydrophilic surfaces pull the water closer, thereby narrowing the gap. For visual clarity, we have only shown profiles for four surfaces. When all data are included, we find that similar to the interfacial width, the correlation is qualitative.
Cavity Formation as a Measure of Hydrophobicity.
Clues to finding quantitative molecular signatures of hydrophobicity come from ideas in refs 44–51 and from the results of recent simulations (52–55). Mittal and Hummer (54) show that the interface of large repulsive hydrophobic solutes is rough and flickering and broadened by capillary wave-like fluctuations. Giovambattista et al. (48, 49) show that water confined between hydrophobic plates is more compressible than in bulk water or between hydrophilic surfaces. A picture of the hydrophobic–water interface that emerges from those studies is that hydration shells of hydrophobic solutes are soft, highly compressible, and characterized by enhanced density fluctuations (55).
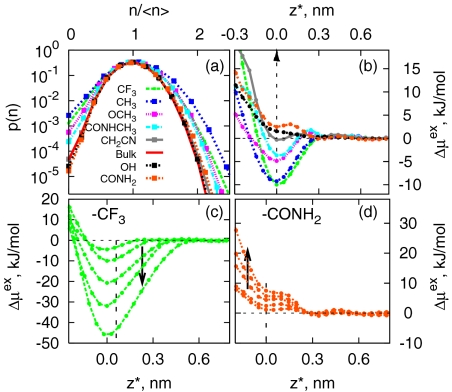
Enhanced density fluctuations would suggest higher probability of cavity formation, and correspondingly, lower excess chemical potential for solvation of hydrophobic solutes in the vicinity of hydrophobic surfaces. Because the formation of a cavity requires that centers of all atoms be excluded from that region, we measured distributions of the number of all heavy atoms, which include water oxygens as well as heavy atoms of SAM head groups (if present), at various points across the broader interfacial region. Fig. 5A shows such distributions in a methane-sized spherical observation volume of radius 3.3 Å at z* = 0, which is the location of the minimum in Fig. 5B (see next paragraph). We note that the horizontal axis in Fig. 5A is scaled by < n  to facilitate comparisons. In bulk water, such distributions are roughly Gaussian (56, 57). For all chemistries, the distributions are roughly Gaussian (parabolic on a log-linear scale) as well. They are also remarkably different from each other—they are wider near hydrophobic surfaces and much more sharply defined near hydrophilic surfaces.
Fig. 5.
Density fluctuations and cavity formation at different interfaces. (A) Probability distributions of number of heavy atoms in 3.3 Å-radius spherical volumes in bulk water and near interfaces. (B) The excess chemical potential of a methane-sized WCA solute normal to the surface, relative to that in the bulk. Curves are translated horizontally, such that minimum is at z* = 0. This corresponds to the solute being in contact with SAM, and SAM density being roughly 5% of its bulk density. This latter criterion was used for −OH and −CONH2 surfaces, for which a minimum is not observed. (C and D) The excess chemical potential of repulsive WCA (58) solutes of different sizes (σ = 0.25, 0.373, 0.560, 0.746, and 0.932 nm) relative to its value in bulk water as a function z at hydrophobic −CF3 and hydrophilic −CONH2 interfaces, respectively. The arrow points to increasing solute size. The curves are translated horizontally as above.
Fig. 5B shows the excess chemical potential [or the potential of mean force (PMF)] of a purely repulsive, methane-sized Weeks–Chandler–Andersen (WCA) solute (58) measured along the direction normal to the interface relative to that in the bulk. Although this solute has no attractive interactions with the interface, a clear minimum is observed in the free energy profile near hydrophobic surfaces consistent with the higher probability of cavity formation near those surfaces. Near −CF3 and −CH3 surfaces, the depth of the minimum is large, ≈10 kJ/mol, comparable with the solute's chemical potential in bulk water, μbulkex ≈ +26 kJ/mol (12, 59, 60). The depth of the minimum gradually reduces near increasingly hydrophilic surfaces, and near −OH and −CONH2 chemistries there is actually a water-mediated repulsion between the WCA solute and the surface. The above effects are amplified for larger probe solutes. PMFs calculated by using umbrella sampling shown in Fig. 5 C and D indicate that those larger solutes bind more strongly to hydrophobic surfaces and are repelled away with greater driving force from hydrophilic surfaces.
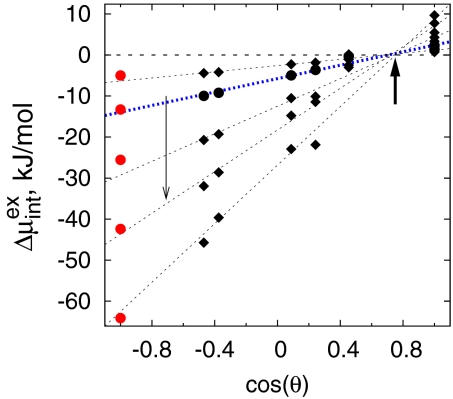
Is the probability of cavity formation near a surface, or correspondingly, the excess chemical potential for solvation related quantitatively to macroscopic measures of its hydrophobicity/hydrophilicity? Fig. 6 shows that the answer is yes. The free energy of hydration of a probe hydrophobic solute at the interface relative to that in bulk water, Δ μintex, varies essentially linearly with the macroscopic quantity, cos(θ), over the broad range of surface chemistries and solute sizes. Recent simulations of the adsorption of an attractive polymeric solute at these surfaces also show a linear correlation between adsorption free energies and surface wettability (61).
Fig. 6.
Molecular signatures of interfacial hydrophobicity. Excess chemical potentials of WCA solutes at the interface relative to that in the bulk, Δ μintex, as a function of surface wettability measured by the experimental cos(θ) (36). Data for WCA solutes with σ = 0.25, 0.373, 0.560, 0.746, and 0.932 nm are shown. Dotted lines show linear fits. Filled circles and the blue line are for methane-sized WCA solutes (σ = 0.373). The left arrow indicates increasing solute size. The right arrow highlights the convergence at cos(θ0) ≈0.7 or θ0 ≈45°. Δμintex = μbulkex/2 for the red data points placed at cos(θ) = −1, with μbulkex obtained from independent simulations.
Two features of Fig. 6 are noteworthy. First, the lines for solutes of different sizes from diameter of 0.25 to 1 nm converge at a point for which Δ μintex ≈ 0 and cos(θ0) ≈ 0.7. Thus, a surface with a contact angle of 45° will be essentially neutral to cavity (or hard-sphere) probe solutes in that it will neither repel nor attract them. One may suggest the contact angle of 45° to be a boundary between hydrophobic and hydrophilic for repulsive solutes. This boundary will shift for realistic solutes having van der Waals interactions with the surface and solvent, as well as internal conformational degrees of freedom (61). A similar correlation between the distance for capillary-drying between hydrophobic plates and cos(θ) has been observed (62), where the boundary for drying appears to be around θ ≈ 115°.
The second noteworthy point relates to an extrapolation of the linear relation in Fig. 6 down to cos(θ) = −1.0, which corresponds to a vapor–liquid interface. Intuitively, one may expect the excess chemical potential of an idealized hydrophobic solute at a vapor–liquid interface to be roughly half of its value in the bulk. For each solute, we have plotted the independently obtained value of μbulkex/2 on the graph (shown in red) (13). That these points lie almost precisely on the linear extrapolation is a remarkable result that, when combined with the first point, yields a simple linear relationship between the cavity-formation free energy and the macroscopic contact angle.
where θ0 = 45° and m = μbulkex/2(1+cos (θ0)).
Water–Water Correlations at Interfaces.
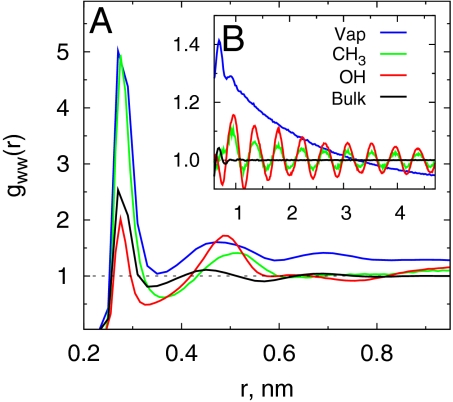
Density fluctuations in a given volume are related to particle–particle correlations (63). In the inhomogeneous systems considered here, we expect the vicinal water–water pair correlations to be sensitive to surface chemistries. We measured water pair correlation functions in a 0.1-nm thin slab located at the interface of hydrophobic (−CH3) and hydrophilic (−OH) surfaces (Fig. 7A). Similar correlations at a vapor–liquid (V–L) interface and in bulk water are shown for reference. In bulk water, the first peak at 0.28 nm is characteristic of the nearest neighbor hydrogen bonding, and the second peak at 0.45 nm indicates the roughly tetrahedral local structure. At the V–L interface, the first peak location is not affected, but its height is considerably increased, indicating enhanced short-range correlations. More importantly, correlations at the V–L interface are long-ranged, spanning the length of the simulation box, as seen in the tail of gww(r) (Fig. 7B). Near SAM surfaces, the change in the short-range (r < 1 nm) part of the gww(r) is significant; at these length scales, water structure near the hydrophobic −CH3 surface is qualitatively similar to that near the V–L interface, whereas correlations near a hydrophilic surface are akin to that in bulk water. There are no truly long-range correlations near either −CH3 or −CONH2 surfaces, and the oscillations in the tails (in Fig. 7B) simply reflect the underlying surface topology.
Fig. 7.
Water–water correlations at different interfaces. (A) Water oxygen–oxygen pair correlations, gww(r), near −CH3 and −OH surfaces measured in a 0.1 nm-thick slab parallel to the interface located at the half-density plane of water. (B) gww(r) for r>1 nm. Water correlations measured similarly at a vapor–liquid interface and in bulk water are shown for reference. Because of the quasi-two-dimensional nature of gww(r), cylindrical shell normalization volumes were used in the calculations.
A purely repulsive hard-wall-like interface is similar to the V–L interface of water. It will accommodate significant fluctuations consistent with the long-range capillary waves present at that interface (20, 54, 64). An external field (e.g., a weak field such as gravity) is known to quench the range of these correlations (65, 66). Even at the most hydrophobic (−CH3) surface, the surface–water interactions are many orders higher than gravity and quench the long-range correlations. Nevertheless, the short-range water–water correlations near the −CH3 surface are enhanced similar to those at a V–L interface. For patchy surfaces, Willard and Chandler (51) also find that even though attractions pull the aqueous interface closer, the interfacial fluctuations remain and characterize the underlying patchiness of the surface. To our knowledge, the relation between the range of solvent–solvent correlations near a surface and the surface–solvent interactions implied here has not been quantified previously. Our preliminary studies of a −CH3-terminated surface and of a model flat surface with a 9–3 potential with different attractions (data not shown) suggest that the range of water–water correlations increases as surface–water attractions are reduced, becoming long-ranged and box-spanning for sufficiently low attractions.
Conclusions
We reported results from extensive MD simulations of the hydration of interfaces spanning a broad range of hydrophobicity/hydrophilicity. We focused on the behavior of vicinal water to identify and characterize the molecular signatures of hydrophobicity that are consistent with macroscopic expectations. We showed that the density of water in the vicinity of an interface is a poor quantifier of interface hydrophobicity, especially for realistic surfaces. Although the interfacial width correlates with surface hydrophobicity, the correlation is weak. In contrast, normalized local density fluctuations or the free energy of cavity formation near surfaces provide clear signatures of hydrophobicity. Cavity formation is enhanced near hydrophobic surfaces and suppressed near hydrophilic ones.
Water–water correlations in the vicinity also show differences near hydrophobic and hydrophilic surfaces. Specifically, short-range water pair correlations near the −CH3 surface are enhanced, similar to those at a V–L interface of water. Such an enhancement is not observed at the hydrophilic −OH SAM surface. Higher fluctuations and enhanced correlations at hydrophobic surfaces highlight the fact that despite layering and apparent high-vicinal water density, hydrophobic interfaces couple weakly with water. The weak coupling would be consistent with the presence of a hydrodynamic slip (67) and high Kapitza interfacial thermal resistance, and correspondingly, weaker thermal energy-transport across hydrophobic interfaces (21).
The molecular signatures of hydrophobicity identified here are correlated with macroscopic wetting characteristics of interfaces. Specifically, the free energy of hydration of hydrophobic probe solutes at the interface varies linearly with cos(θ) over a broad range of interfacial chemistries and solute sizes, where θ is the droplet contact angle. Interestingly, for idealized hydrophobic probe solutes, a surface with θ ≈45° appears to be neutral—it neither attracts nor repels them.
From a broader theoretical perspective, the connection between the magnitude and range of fluid–fluid correlations near a surface and the surface–fluid attractions will be of interest to the condensed-matter community. Recently, Vaknin et al. (68) have measured the structure factor of water at a V–L interface, which is consistent with long-range correlations predicted by capillary wave theory. In principle, similar measurements can potentially quantify water correlations near surfaces of various hydrophobicities. Long-range correlations will be present at superhydrophobic surfaces and may be probed, perhaps more easily than enhancements in shorter-range (1–2 nm) correlations at −CH3 like surfaces.
Our results point to normalized local density fluctuations, free energy of cavity formation, or water–water correlations at interfaces as excellent candidates for molecular signatures of interface hydrophobicity. Characterization based on some of these signatures can be extended to interfaces of complex nanoscopic objects such as proteins (49, 69) and biomolecules or nanoparticles, and has the potential to provide a fundamental understanding of a host of water-mediated interactions important in biological and colloidal self-assembly.
Materials and Methods
SAM construction is described in refs 21 and 61; here we provide only key details for completeness. Two surfactant chains each comprising C10 alkane chains with a given head group at one end were attached to sulfur atoms, which were position-restrained to locations corresponding to those on gold 111 lattice (70) (Fig. 1). This created two SAM slabs in the 3-D periodic system. The alkane tail carbons were represented by using the united atom model (71) Seven head group chemistries—specifically, −CF3, −CH3, −OCH3, −CONHCH3, −CH2CN, −CONH2, and −OH— were simulated by using an all-atom Assisted Model Building with Energy Refinement (AMBER) Parm-94 force field (72), except for −CH2CN and −CF3, where Optimized Potential for Liquid Simulations (OPLS) parameters (73) were used.
Our systems included 112 surfactant chains (56 sulfurs), creating a well-packed crystalline solid SAM phase with an area of 3.46 × 3.50 nm2. About 1,500–1,700 water molecules, represented explicitly by using the extended simple point charge model (SPC/E) (74), were included in the 3-D periodic box, providing at equilibrium a ≈4-nm thick water slab between SAM layers in two adjacent boxes. The second set of simulations of water nanodroplets on SAM surfaces included 480 sulfur atoms spanning an area of 9.96 × 10 nm2. Fig. 3 primarily reports data from simulations of 5 nm-diameter water droplets (2,176 waters) (see ref. 21). For two surfaces, droplets spanning 1,000 to 18,000 molecules were simulated. Extrapolations using these simulations are also reported in Fig. 3.
The Particle Mesh Ewald method (75) was used to calculate electrostatic interactions. Real space cutoff and cutoff for Lennard Jones interactions was 1 nm. A time step of 2 fs was used. Equilibration runs of over 4 ns were followed by production runs of over 10 ns, with configurations saved every 1 ps for analysis. Simulations were performed by using Groningen Machine for Chemical Simulations (GROMACS) (76). The SHAKE algorithm was used to constrain bonds in water molecules. The filled system simulations were performed in the NPT ensemble, and droplet simulations were performed in the NVT ensemble. The temperature (300 K) and pressure (1 atm) were maintained by using the Berendsen thermostat and barostat (77), where an anisotropic barostat was used to allow independent relaxation in the z direction. Potentials of mean force between WCA solutes and different interfaces were calculated by using an umbrella sampling method. Water–water correlations in 0.1-nm slabs were treated as 2-D functions, and cylindrical normalization volumes were used. Using a larger slab width does not substantially affect the results presented in Fig. 7.
Acknowledgments.
We thank David Chandler for numerous insightful discussions. We thank Henry Ashbaugh, Dor Ben-Amotz, Steve Granick, Mike Paulaitis, and Thomas Truskett for a careful reading of the manuscript and helpful comments. We are thankful to Computational Center for Nanotechnology Innovations at Rensselaer for computational support. We acknowledge partial financial support from National Science Foundation Grant NSEC DMR-011779 and grants from CBET-0418413 and the American Chemical Society/Petroleum Research Fund.
Footnotes
The authors declare no conflict of interest.
This article is a PNAS Direct Submission.
References
- 1.Kauzmann W. Some factors in the interpretation of protein denaturation. Adv Protein Chem. 1959;14:1–63. doi: 10.1016/s0065-3233(08)60608-7. [DOI] [PubMed] [Google Scholar]
- 2.Tanford C. Contribution of hydrophobic interactions to stability of globular conformation of proteins. J Am Chem Soc. 1962;84:4240–4247. [Google Scholar]
- 3.Dill KA. Dominant forces in protein folding. Biochemistry. 1990;29:7133–7155. doi: 10.1021/bi00483a001. [DOI] [PubMed] [Google Scholar]
- 4.Chandler D. Interfaces and the driving force of hydrophobic assembly. Nature. 2005;437:640–647. doi: 10.1038/nature04162. [DOI] [PubMed] [Google Scholar]
- 5.Granick S, Bae SC. Chemistry. A Curious Antipathy for Water. Science. 2008;322:1477–1478. doi: 10.1126/science.1167219. [DOI] [PubMed] [Google Scholar]
- 6.Guillot B, Guissani YA. Computer-simulation study of the temperature-dependence of the hydrophobic hydration. J Chem Phys. 1993;99:8075–8094. [Google Scholar]
- 7.Garde S, Garcia AE, Pratt LR, Hummer G. Temperature dependence of the solubility of non-polar gases in water. Biophys Chem. 1999;78:21–32. doi: 10.1016/s0301-4622(99)00018-6. [DOI] [PubMed] [Google Scholar]
- 8.Hummer G, Garde S, Garcia AE, Paulaitis ME, Pratt LR. The pressure dependence of hydrophobic interactions is consistent with the observed pressure denaturation of proteins. Proc Natl Acad Sci USA. 1998;95:1552–1555. doi: 10.1073/pnas.95.4.1552. [DOI] [PMC free article] [PubMed] [Google Scholar]
- 9.Smith PE. Computer simulation of cosolvent effects on hydrophobic hydration. J Phys Chem B. 1999;103:525–534. [Google Scholar]
- 10.Kalra A, Tugcu N, Cramer SM, Garde S. Salting-in and salting-out of hydrophobic solutes in aqueous salt solutions. J Phys Chem B. 2001;105:6380–6386. [Google Scholar]
- 11.Lum K, Chandler D, Weeks JD. Hydrophobicity at small and large length scales. J Phys Chem B. 1999;103:4570–4577. [Google Scholar]
- 12.Huang DM, Chandler D. The hydrophobic effect and the influence of solute-solvent attractions. J Phys Chem B. 2002;106:2047–2053. [Google Scholar]
- 13.Rajamani S, Truskett TM, Garde S. Hydrophobic hydration from small to large lengthscales: Understanding and manipulating the crossover. Proc Natl Acad Sci USA. 2005;102:9475–9480. doi: 10.1073/pnas.0504089102. [DOI] [PMC free article] [PubMed] [Google Scholar]
- 14.Stillinger FH. Structure in aqueous solutions of nonpolar solutes from the standpoint of scaled-particle theory. J Solution Chem. 1973;2:141–158. [Google Scholar]
- 15.Ashbaugh HS, Paulaitis ME. Effect of solute size and solute-water attractive interactions on hydration water structure around hydrophobic solutes. J Am Chem Soc. 2001;123:10721–10728. doi: 10.1021/ja016324k. [DOI] [PubMed] [Google Scholar]
- 16.Choudhury N, Pettitt BM. Local density profiles are coupled to solute size and attractive potential for nanoscopic hydrophobic solutes. Mol Simul. 2005;31:457–463. [Google Scholar]
- 17.Maibaum L, Chandler D. Segue between favorable and unfavorable solvation. J Phys Chem B. 2007;111:9025–9030. doi: 10.1021/jp072266z. [DOI] [PubMed] [Google Scholar]
- 18.Zhou R, Huang X, Margulis CJ, Berne BJ. Hydrophobic collapse in multidomain protein folding. Science. 2004;305:1605–1609. doi: 10.1126/science.1101176. [DOI] [PubMed] [Google Scholar]
- 19.Weeks JD. Structure and thermodynamics of liquid-vapor interface. J Chem Phys. 1977;67:3106–3121. [Google Scholar]
- 20.Davis HT. Capillary waves and mean field-theory of interfaces. J Chem Phys. 1977;67:3636–3641. [Google Scholar]
- 21.Shenogina N, Godawat R, Keblinski P, Garde S. How wetting and adhesion affect thermal conductance of a range of hydrophobic to hydrophilic aqueous interfaces. Phys Rev Lett. 2009;102:156101. doi: 10.1103/PhysRevLett.102.156101. [DOI] [PubMed] [Google Scholar]
- 22.Hautman J, Klein ML. Simulation of a monolayer of alkyl thiol chains. J Chem Phys. 1989;91:4994–5001. [Google Scholar]
- 23.Laibinis PE, et al. Comparison of the structures and wetting properties of self-assembled monolayers of normal-alkanethiols on the coinage metal-surfaces, Cu, Ag, Au. J Am Chem Soc. 1991;113:7152–7167. [Google Scholar]
- 24.Lee CY, McCammon JA, Rossky PJ. The structure of liquid water at an extended hydrophobic surface. J Chem Phys. 1984;80:4448–4455. [Google Scholar]
- 25.Ashbaugh HS, Paulaitis ME. Entropy of hydrophobic hydration: Extension to hydrophobic chains. J Phys Chem. 1996;100:1900–1913. [Google Scholar]
- 26.Garde S, Hummer G, Garcia AE, Pratt LR, Paulaitis ME. Hydrophobic hydration: Inhomogeneous water structure near nonpolar molecular solutes. Phys Rev E. 1996;53:R4310–R4313. doi: 10.1103/physreve.53.r4310. [DOI] [PubMed] [Google Scholar]
- 27.Ocko BM, Dhinojwala A, Daillant J. Comment on “How water meets a hydrophobic surface”. Phys Rev Lett. 2008;101:039601. doi: 10.1103/PhysRevLett.101.039601. [DOI] [PubMed] [Google Scholar]
- 28.Poynor A, et al. Comment on “How water meets a hydrophobic surface”—Reply. Phys Rev Lett. 2008;101:039601. doi: 10.1103/PhysRevLett.101.039601. [DOI] [PubMed] [Google Scholar]
- 29.Mezger M, et al. High-resolution in situ x-ray study of the hydrophobic gap at the water-octadecyl-trichlorosilane interface. Proc Natl Acad Sci USA. 2006;103:18401–18404. doi: 10.1073/pnas.0608827103. [DOI] [PMC free article] [PubMed] [Google Scholar]
- 30.Jensen TR, et al. Water in contact with extended hydrophobic surfaces: Direct evidence of weak dewetting. Phys Rev Lett. 2003;90:086101. doi: 10.1103/PhysRevLett.90.086101. [DOI] [PubMed] [Google Scholar]
- 31.Kashimoto K, et al. Structure and depletion at fluorocarbon and hydrocarbon/water liquid/liquid interfaces. Phys Rev Lett. 2008;101:086101. doi: 10.1103/PhysRevLett.101.076102. [DOI] [PubMed] [Google Scholar]
- 32.Seo YS, Satija S. No intrinsic depletion layer on a polystyrene thin film at a water interface. Langmuir. 2006;22:7113–7116. doi: 10.1021/la060736v. [DOI] [PubMed] [Google Scholar]
- 33.Maccarini M, et al. Density depletion at solid-liquid interfaces: A neutron reflectivity study. Langmuir. 2007;23:598–608. doi: 10.1021/la061943y. [DOI] [PubMed] [Google Scholar]
- 34.Takata Y, Cho JHJ, Law BM, Aratono M. Ellipsometric search for vapor layers at liquid-hydrophobic solid surfaces. Langmuir. 2006;22:1715–1721. doi: 10.1021/la052599s. [DOI] [PubMed] [Google Scholar]
- 35.Ge ZB, Cahill DG, Braun PV. Thermal conductance of hydrophilic and hydrophobic interfaces. Phys Rev Lett. 2006;96:186101. doi: 10.1103/PhysRevLett.96.186101. [DOI] [PubMed] [Google Scholar]
- 36.Sigal GB, Mrksich M, Whitesides GM. Effect of surface wettability on the adsorption of proteins and detergents. J Am Chem Soc. 1998;120:3464–3473. [Google Scholar]
- 37.de Ruijter MJ, Blake TD, De Coninck J. Dynamic wetting studied by molecular modeling simulations of droplet spreading. Langmuir. 1999;15:7836–7847. [Google Scholar]
- 38.Giovambattista N, Rossky PJ, Debenedetti PG. Effect of surface polarity on water contact angle and interfacial hydration structure. J Phys Chem B. 2007;111:9581–9587. doi: 10.1021/jp071957s. [DOI] [PubMed] [Google Scholar]
- 39.MacDowell LG, Muller M, Binder K. How do droplets on a surface depend on the system size? Colloid Surf A-Physicochem Eng Asp. 2002;206:277–291. [Google Scholar]
- 40.Werder T, Walther JH, Jaffe RL, Halicioglu T, Koumoutsakos P. On the water-carbon interaction for use in molecular dynamics simulations of graphite and carbon nanotubes. J Phys Chem B. 2003;107:1345–1352. [Google Scholar]
- 41.Ingebrigtsen T, Toxvaerd S. Contact angles of Lennard-Jones liquids and droplets on planar surfaces. J Phys Chem C. 2007;111:8518–8523. [Google Scholar]
- 42.Ball P. Water as an active constituent in cell biology. Chem Rev. 2008;108:74–108. doi: 10.1021/cr068037a. [DOI] [PubMed] [Google Scholar]
- 43.Patel HA, Nauman EB, Garde S. Molecular structure and hydrophobic solvation thermodynamics at an octane-water interface. J Chem Phys. 2003;119:9199–9206. [Google Scholar]
- 44.Pohorille A, Wilson MA. Excess chemical potential of small solutes across water-membrane and water-hexane interfaces. J Chem Phys. 1996;104:3760–3773. doi: 10.1063/1.471030. [DOI] [PubMed] [Google Scholar]
- 45.Pratt LR, Pohorille A. Hydrophobic effects and modeling of biophysical aqueous solution interfaces. Chem Rev. 2002;102:2671–2691. doi: 10.1021/cr000692+. [DOI] [PubMed] [Google Scholar]
- 46.Chandler D. Physical chemistry—Oil on troubled waters. Nature. 2007;445:831–832. doi: 10.1038/445831a. [DOI] [PubMed] [Google Scholar]
- 47.Zhang XY, Zhu YX, Granick S. Hydrophobicity at a Janus interface. Science. 2002;295:663–666. doi: 10.1126/science.1066141. [DOI] [PubMed] [Google Scholar]
- 48.Giovambattista N, Rossky PJ, Debenedetti PG. Effect of pressure on the phase behavior and structure of water confined between nanoscale hydrophobic and hydrophilic plates. Phys Rev E. 2006;73:041604. doi: 10.1103/PhysRevE.73.041604. [DOI] [PubMed] [Google Scholar]
- 49.Giovambattista N, Lopez CF, Rossky PJ, Debenedetti PG. Hydrophobicity of protein surfaces: Separating geometry from chemistry. Proc Natl Acad Sci USA. 2008;105:2274–2279. doi: 10.1073/pnas.0708088105. [DOI] [PMC free article] [PubMed] [Google Scholar]
- 50.Willard AP, Chandler D. The role of solvent fluctuations in hydrophobic assembly. J Phys Chem B. 2008;112:6187–6192. doi: 10.1021/jp077186+. [DOI] [PubMed] [Google Scholar]
- 51.Willard AP, Chandler D. Coarse-grained modeling of the interface between water and heterogeneous surfaces. Faraday Discuss. 2009;141:209–220. doi: 10.1039/b805786a. [DOI] [PubMed] [Google Scholar]
- 52.Athawale MV, Goel G, Ghosh T, Truskett TM, Garde S. Effects of lengthscales and attractions on the collapse of hydrophobic polymers in water. Proc Natl Acad Sci USA. 2007;104:733–738. doi: 10.1073/pnas.0605139104. [DOI] [PMC free article] [PubMed] [Google Scholar]
- 53.Goel G, Athawale MV, Garde S, Truskett TM. Attractions, water structure, and thermodynamics of hydrophobic polymer collapse. J Phys Chem B. 2008;112:13193–13196. doi: 10.1021/jp806993b. [DOI] [PubMed] [Google Scholar]
- 54.Mittal J, Hummer G. Static and dynamic correlations in water at hydrophobic interfaces. Proc Natl Acad Sci USA. 2008;105:20130–20135. doi: 10.1073/pnas.0809029105. [DOI] [PMC free article] [PubMed] [Google Scholar]
- 55.Sarupria S, Garde S. Quantifying water density fluctuations and compressibility of hydration shells of hydrophobic solutes and proteins. Phys Rev Lett. 2009;103:037803. doi: 10.1103/PhysRevLett.103.037803. [DOI] [PubMed] [Google Scholar]
- 56.Pratt LR, Chandler D. Theory of hydrophobic effect. J Chem Phys. 1977;67:3683–3704. [Google Scholar]
- 57.Hummer G, Garde S, Garcia AE, Pohorille A, Pratt LR. An information theory model of hydrophobic interactions. Proc Nat Acad Sci USA. 1996;93:8951–8955. doi: 10.1073/pnas.93.17.8951. [DOI] [PMC free article] [PubMed] [Google Scholar]
- 58.Weeks JD, Chandler D, Andersen HC. Role of repulsive forces in determining equilibrium structure of simple liquids. J Chem Phys. 1971;54:5237–5247. [Google Scholar]
- 59.Ben-Amotz D. Global thermodynamics of hydrophobic cavitation, dewetting, and hydration. J Chem Phys. 2005;123:184504. doi: 10.1063/1.2121648. [DOI] [PubMed] [Google Scholar]
- 60.Ashbaugh HS, Pratt LR. Colloquium: Scaled particle theory and the length scales of hydrophobicity. Rev Mod Phys. 2006;78:159–178. [Google Scholar]
- 61.Jamadagni SN, Godawat R, Garde S. How surface wettability affects the binding, folding, and dynamics of hydrophobic polymers at interfaces. Langmuir. 2009 Jun 3; doi: 10.1021/la9011839. 10.1021/la9011839. [DOI] [PubMed] [Google Scholar]
- 62.Huang X, Zhou R, Berne BJ. Drying and hydrophobic collapse of parrafin plates. J Chem Phys B. 2005;109:3546–3552. doi: 10.1021/jp045520l. [DOI] [PubMed] [Google Scholar]
- 63.Hansen JP, McDonald IT. Theory of Simple Liquids. 3rd Ed. Amsterdam: Academic; 2006. [Google Scholar]
- 64.Ismail AE, Grest GS, Stevens MJ. Capillary waves at the liquid-vapor interface and the surface tension of water. J Chem Phys. 2006;125:014702. doi: 10.1063/1.2209240. [DOI] [PubMed] [Google Scholar]
- 65.Knackstedt M, Robert M. External-field effect on the critical-behavior of the interface between fluid phases. Int J Thermophys. 1989;10:321–331. [Google Scholar]
- 66.Bresme F, Chacon E, Tarazona P, Tay K. Intrinsic structure of hydrophobic surfaces: The oil-water interface. Phys Rev Lett. 2008;101:056102. doi: 10.1103/PhysRevLett.101.056102. [DOI] [PubMed] [Google Scholar]
- 67.Cieplak M, Koplik J, Banavar JR. Boundary conditions at a fluid-solid interface. Phys Rev Lett. 2001;86:803–806. doi: 10.1103/PhysRevLett.86.803. [DOI] [PubMed] [Google Scholar]
- 68.Vaknin D, Bu W, Travesset A. Extracting the pair distribution function of liquids and liquid-vapor surfaces by grazing incidence x-ray diffraction mode. J Chem Phys. 2008;129:044504. doi: 10.1063/1.2953572. [DOI] [PubMed] [Google Scholar]
- 69.Siebert X, Hummer G. Hydrophobicity maps of the N-peptide coiled coil of HIV-1 gp41. Biochemistry. 2002;41:2956–2961. doi: 10.1021/bi0158526. [DOI] [PubMed] [Google Scholar]
- 70.Love JC, Estroff LA, Kriebel JK, Nuzzo RG, Whitesides GM. Self-assembled monolayers of thiolates on metals as a form of nanotechnology. Chem Rev. 2005;105:1103–1169. doi: 10.1021/cr0300789. [DOI] [PubMed] [Google Scholar]
- 71.Mondello M, Grest GS, Webb EB, Peczak P. Dynamics of n-alkanes: Comparison to Rouse model. J Chem Phys. 1998;109:798–805. [Google Scholar]
- 72.Cornell WD, et al. A 2nd generation force-field for the simulation of proteins, nucleic-acids, and organic-molecules. J Am Chem Soc. 1995;117:5179–5197. [Google Scholar]
- 73.Price MLP, Ostrovsky D, Jorgensen WL. Gas-phase and liquid-state properties of esters, nitriles, and nitro compounds with the OPLS-AA force field. J Comput Chem. 2001;22:1340–1352. [Google Scholar]
- 74.Berendsen HJC, Grigera JR, Straatsma TP. The missing term in effective pair potentials. J Phys Chem. 1987;91:6269–6271. [Google Scholar]
- 75.Essmann U, et al. A smooth particle mesh ewald method. J Chem Phys. 1995;103:8577–8593. [Google Scholar]
- 76.Lindahl E, Hess B, van der Spoel D. GROMACS 3.0: A package for molecular simulation and trajectory analysis. J Mol Model. 2001;7:306–317. [Google Scholar]
- 77.Berendsen HJC, Postma JPM, Vangunsteren WF, Dinola A, Haak JR. Molecular-dynamics with coupling to an external bath. J Chem Phys. 1984;81:3684–3690. [Google Scholar]


