Abstract
A gain of function mutation in SHP2, a protein phosphatase encoded by PTPN11, causes Noonan syndrome (NS), which is characterized in part by developmental deficits in both the cardiac and skull fields. Previously, we found that expression of the mutated protein SHP2 Q79R in the heart led to a phenotypic presentation that mimicked some aspects of NS and that this was dependent upon activation of the ERK1/2 pathway. To understand the role that ERK1/2 signaling plays in skull development through signaling in the neural crest, we explored the consequences of Q79R expression in neural crest cells, which contribute to a subset of the bony and cartilaginous structures of the skull. Hyperactivation of ERK1/2 led to craniofacial defects that included smaller skull lengths, greater inner canthal distances, and taller frontal bone heights. In proportion to the smaller skull length, mandibular bone length was also reduced. Inhibition of ERK1/2 hyperactivity as a result of Q79R expression was achieved by injection of the MAPK/ERK kinase inhibitor U0126 during pregnancy. The drug effectively decreased the severity of the craniofacial defects and restored normal skull shape and fontanelle closure. X-ray computer-assisted microtomography analysis of the head confirmed that decreasing ERK1/2 activity led to an abrogation of the craniofacial deficits and brain shape changes that presented in the mice. These data show that normal ERK1/2 signaling in the neural crest is imperative for normal craniofacial development and offer insight into how the heart and craniofacial developmental fields might be affected in some congenital syndromic presentations.
Keywords: congenital disease, skull, SHP2, neural crest
The vertebrate neural crest is a pluripotent cell population derived from the lateral ridges of the neural plate during early stages of embryogenesis. Neural crest cells (NCCs) disperse from the dorsal surface of the neural tube and migrate extensively through the embryo, giving rise to a wide variety of differentiated cell types, including those that populate the head and heart fields (1, 2).
Development of the craniofacial region is a complex process to which the NCCs contribute. NCCs, along with mesoderm derivatives, give rise to many of the hard tissues of the head, including bone and cartilage (3). The skull consists of 2 components: the neurocranium (frontal, parietal, occipital, sphenoid, and temporal bones) and the viscerocranium (mandible, maxilla, zygoma, and nasal), as well as the palatal, pharyngeal, temporal, and auditory bones (4). It is now possible to fate map the NCC-derived lineages using a compound transgenic mouse, and the data show that NCCs contribute to the entire viscerocranium and part of the neurocranium (5).
Significant progress has been made in recent years in understanding the molecular mechanisms that control skull development, and it is becoming clear that genetic disorders, abnormal signaling, or environmental insults can alter the fate determination of NCCs and result in craniofacial malformations (4, 6). Germline missense mutations of human PTPN11, which encodes the tyrosine phosphatase SHP2, occur in ≈50% of Noonan syndrome (NS) patients (7). NS is characterized by a wide spectrum of defects, which most frequently include short stature, congenital heart disease, and craniofacial anomalies (8). We have recently reported that cardiomyocyte- and endothelial cell–specific expression of the NS-causing SHP2 Q79R mutation selectively activated ERK1/2 phosphorylation and led to cardiac anomalies that mimicked those presenting in NS. Conversely, decreasing the ERK1/2 hyperphosphorylation that was observed in those cell types during development restored normal cardiac anatomy and function, suggesting the sufficiency of ERK1/2 hyperactivation in the development of the cardiac anomalies (9, 10). Although the mechanism(s) by which SHP2 gain-of-function mutations are able to activate signaling pathways in general and ERK1/2 in particular remain controversial (11), the sufficiency of activated SHP2 for ERK1/2 activation is unambiguous.
We investigated the role that ERK1/2 hyperactivity might play in the development of craniofacial developmental anomalies. Using the wnt1 promoter, we conditionally activated SHP2-Q79R expression in premigratory NCCs as a means of hyperactivating the ERK1/2 pathway.
Results
SHP2 Q79R Expression in Neural Crest Cells Results in Craniofacial Defects and Growth Retardation.
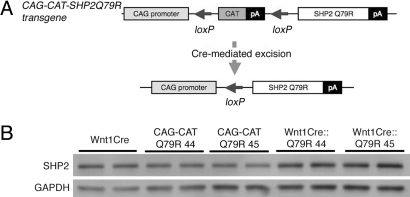
To investigate the effects of increased ERK1/2 activity in premigratory NCCs and their derivative tissues, we engineered a gain-of-function SHP2 mutation that could be conditionally activated. SHP2 mutations in NS mostly cluster in the N-src homology (SH) and protein tyrosine phosphatase (PTP) functional domains, and energetics-based structural analyses showed that some mutations, including Q79R, stabilize SHP2 in the active conformation, leading to a gain of function (7, 12). We previously used this construct to phenocopy aspects of the human disease and activated SHP2 results in the selective and strong activation of ERK1/2 (10). We used a Cre-loxP–based strategy to express SHP2 Q79R by generating CAG-CAT-SHP2 Q79R mice in which the transgene harbors a chloramphenicol acetyltransferase (CAT) gene flanked by loxP sites and driven by the chicken β-actin promoter; downstream of CAT is the SHP2 Q79R (Fig. 1A). When the CAT gene is excised by Cre-mediated recombination between the tandem loxP sites, SHP2 Q79R becomes positioned adjacent to the CAG promoter, permitting SHP2 Q79R expression (Fig. 1A). We obtained 2 lines of the CAG-CAT-SHP2 Q79R mouse founders (lines 44 and 45, respectively). To activate expression of SHP2 Q79R in the premigratory NCCs and their derivatives, the CAG-CAT-SHP2 Q79R mice were crossed with Wnt1Cre mice (13). Protein quantitation by Western blotting showed a very modest increase in SHP2 overexpression in NCCs (Wnt1Cre::Q79R line 44, 1.6-fold; Wnt1Cre::Q79R line 45, 1.3-fold) (Fig. 1B). Both Wnt1Cre::Q79R line 44 and Wnt1Cre::Q79R line 45 mice showed identical phenotypes, and we used line 45 in the experiments described below.
Fig. 1.
NCC-lineage specific expression of SHP2-Q79R in the embryonic mouse skull. (A) Schematic representation of the SHP2 transgene showing the loxP sites and upstream location of the CAG-CAT cassettes. (B) SHP2 expression in 2 lines of transgenic mice. The frontal bone, which is derived exclusively from NCC, was dissected from E17.5 embryos and used to prepare protein for Western blot analysis. At least 5 embryos were used for each sample shown.
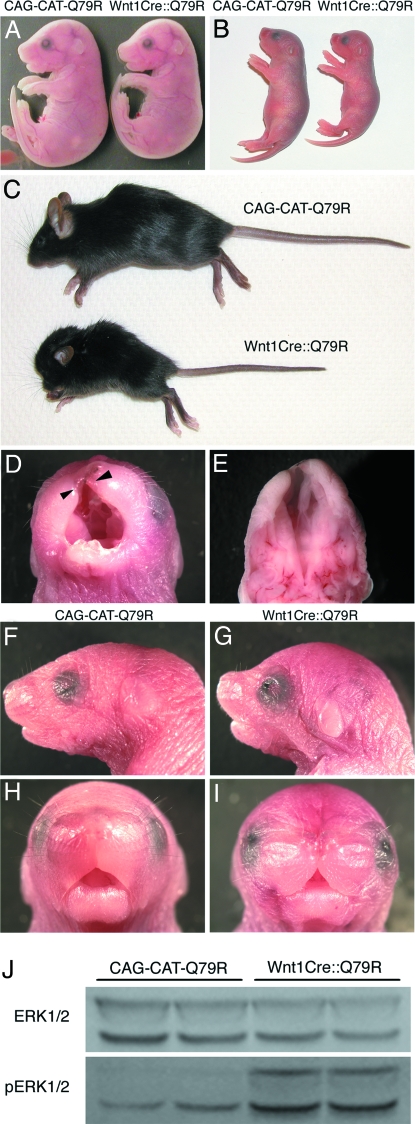
At embryonic day (E)17.5, Wnt1Cre::Q79R embryos displayed a phenotype whose most obvious characteristic was a slightly smaller size and a subtle change in the shape of the skull (Fig. 2A). By 2 days after birth, growth retardation in the Wnt1Cre::Q79R animals was quite pronounced, and the skull shape significantly altered (Fig. 2B). Some Wnt1Cre::Q79R embryos (9 of 43, 20.9%) showed cleft lip and cleft palate, but live births showed the expected Mendelian ratios indicating no embryonic or fetal lethality for the Wnt1Cre::Q79R embryos. However, Wnt1Cre::Q79R neonates that displayed cleft lip and cleft palate (Fig. 2 D and E) were unable to nurse normally and died 1–5 days after birth (supporting information Fig. S1). Surviving neonates showed a dome-shaped head, low-set ears, hypertelorism, a broad nose, and webbed neck, all of which presented in both genders (Fig. 2 F–I). These craniofacial dysmorphia became more pronounced as the Wnt1Cre::Q79R mice aged. Wnt1Cre::Q79R mice showed short stature and lower body weight (Fig. S1).
Fig. 2.
Growth retardation and craniofacial dysmorphia in Wnt1Cre::Q79R mice. (A–C) Representative gross appearance of control and Wnt1Cre::Q79R mice. (A) E17.5, (B) P3, (C) P25. (D and E) Cleft lip (D, arrowheads) and (E) cleft palate of the Wnt1Cre::Q79R mouse at P1. (F–I) Craniofacial phenotypes of the (F and H) control and (G and I) Wnt1Cre::Q79R mice at P3. The Wnt1Cre::Q79R mice show a dome-shaped head, hypertelorism, and low-set ears. (J) Activation of ERK signaling in the Wnt1Cre::Q79R frontal bones.
We confirmed that the low levels of transgene expression did in fact result in ERK1/2 activation by measuring the levels of phosphorylated ERK1/2 in the frontal bones, which are derived from the NCC. Western blots showed significant increases in phospho-ERK in the NCC-derived structures relative to the normal mice (Fig. 2J). We also examined other potential signaling pathways that have been identified as potentially interacting with SHP2, because SHP2 is known to affect growth, proliferation, and cell death (14, 15). However, none of the other pathways showed up- or downregulation in the frontal bones, and Akt and caspase 3 levels were also unchanged (Fig. S2).
Craniofacial Abnormalities Result from Abnormal ERK1/2 Activity in Pre- and Postmigratory NCCs.
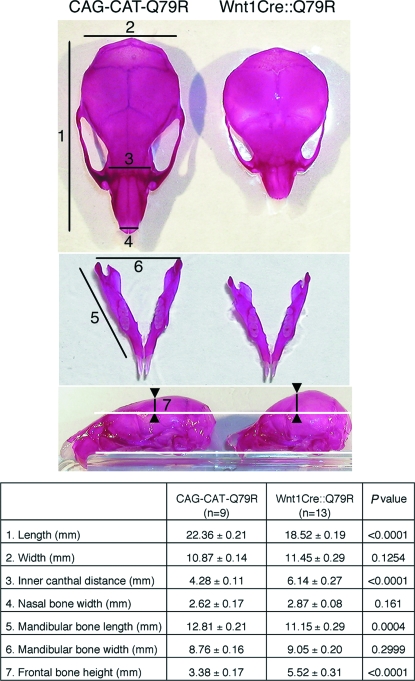
The skull is formed from cranial skeletogenic mesenchyme derived from 2 distinct embryonic sources: mesoderm and NCC (3). NCC fate mapping analysis showed that mouse NCCs contribute to the formation of nasal bone and cartilage, the frontal and interparietal bones, and the mandible (5). Wnt1Cre::Q79R mice displayed smaller skull lengths, greater inner canthal distances, and taller frontal bone heights compared with controls. In proportion to the smaller skull length, mandibular bone length in Wnt1Cre::Q79R mice was smaller than in controls, although its overall architecture was identical (Fig. 3). These observations suggest that altered ERK1/2 signaling in the NCCs designated to differentiate into the cranial structures can lead to skull malformations.
Fig. 3.
Skull anomalies in Wnt1Cre::Q79R mice. Image J software (National Institutes of Health) was used for quantitation of skull size and AF areas. Gross appearance of Alizarin red–stained skull (Top) and mandible (Middle) at P25. Note that whereas the distance from maxilla to the base of frontal bone was identical (Bottom, between the white lines), frontal bone height was greater in the Wnt1Cre::Q79R mice (between the arrowheads). Measurements were obtained at the points indicated. Statistical significance was assessed by the 2-tailed Student's t test.
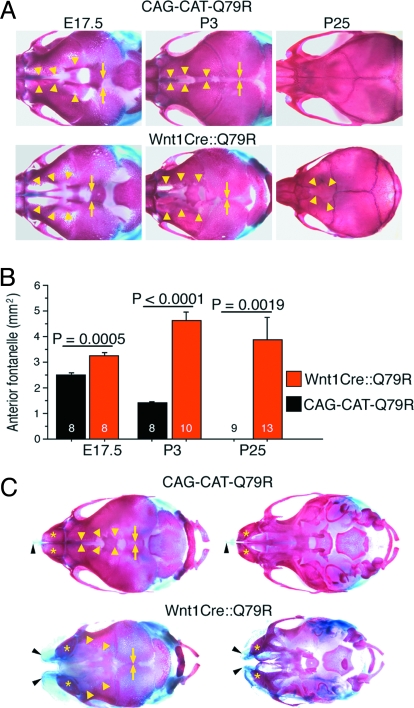
How does SHP2 Q79R–induced signaling in NCCs cause these malformations? To address this question, we tracked skull development and ossification using Alcian blue (detecting cartilage) and Alizarin red (detecting ossified bone) staining. Although no dramatic craniofacial phenotype presents at E17.5 (Fig. 2A), careful analysis of the overall size and relative placement revealed that the anterior fontanelle (AF), the space between frontal bones, is significantly wider in the Wnt1Cre::Q79R mice than in controls (Fig. 4 A and B).
Fig. 4.
Growth retardation of NCC-derived bone and cartilage in Wnt1Cre::Q79R mice. (A) Alcian blue- and Alizarin red–stained skulls at indicated times of development. The arrowheads and arrows identify the osteofronts of the frontal and parietal bones, respectively. (B) Area quantitation of AF. The number in the bar graph identifies the number of the mice analyzed. (C) Alcian blue- and Alizarin red–stained skulls of the control and Wnt1Cre::Q79R animals with cleft lip and cleft palate (P1). Arrowheads and arrows identify the osteofronts of the frontal and parietal bones, respectively.
The requirement of some regions of the skull to remain flexible and fibrous to allow for compression during delivery and postnatal brain growth is well known. During the neonatal period, most of the major bones of the skull are ossified but remain mobile and can move relative to one another. This ability to move is dependent upon the sutures, which consist of fibrous membranes that exist between the flat bones of the neurocranium, and these fibrous sutures remain even after the visible gaps between the bones are filled in, permitting additional growth to occur. If premature fusion or craniosynostosis occurs at any 1 of the 6 sutures in the human skull, developmental problems may result (5, 16, 17). We explored these processes, because craniofacial defects were readily apparent as the mice matured (Fig. 4). At postnatal day 3 (P3), we found substantial differences in the Wnt1Cre::Q79R vs. control CAG-CAT-Q79R AF. The AF in the CAG-CAT-Q79R skulls were invariably smaller when compared with the Wnt1Cre::Q79R mice, which displayed open areas that were easily discerned. At P25, the frontal bones were macroscopically fused to one another at the midline in all CAG-CAT-Q79R controls, whereas the AF was patent in all Wnt1Cre::Q79R mice (Fig. 4A). In contrast, the parietal bones, which are not derived from NCC, showed normal patterns of patency and closure, with the space between them being identical between the 2 cohorts at all stages measured (Fig. 4A). The data, when quantitated, showed highly statistically significant differences in this developmental process (Fig. 4B). In the Wnt1Cre::Q79R mice having cleft lip and cleft palate, nasal cartilage and bones did not fuse at the midline, and the AF remained open despite normal growth of the parietal bones (Fig. 4C). Because the origin of the affected tissue is all NCC-derived, the results suggest that SHP2 Q79R expression in these cells significantly affects normal growth of the nasal cartilage and bones, as well as frontal bones.
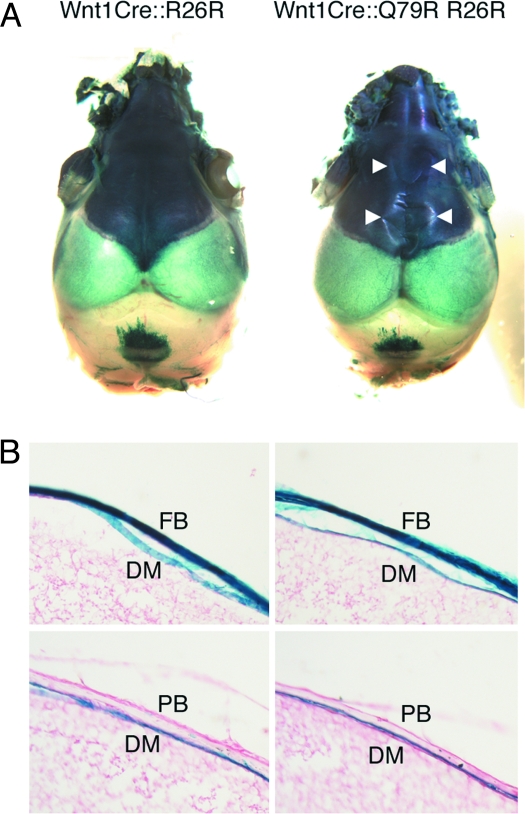
In addition to the skull, NCCs contribute to the formation of the dura mater (DM) (5). The DM, which is the outermost of the 3 layers of meninges that surround the brain, underlies the frontal and parietal bones, surrounds the brain, and may contribute to skull bone patency (18). To explore whether the alterations in bone growth and shape might be due to dramatic alterations in DM organization, we explored the pattern of NCC contribution to the DM. Crossing the Wnt1Cre::Q79R mice into a ROSA26 background allowed lineage tracking because the NCCs become detectable via β-galactosidase staining. Lineage tracking confirmed intense staining in the NCC-derived frontal bones (Fig. 5A). The distribution of β-galactosidase–stained NCCs in DM was identical between Wnt1Cre::Q79R and control mice, whereas the parietal bones in both animals showed no staining, consistent with the lack of NCC contribution (Fig. 5B). Hyperphosphorylation of the NCC-derived cells at these sites was confirmed, whereas proliferation and apoptosis, as measured by Ki-67 and activated caspase 3 staining, respectively, were unchanged (Fig. S3).
Fig. 5.
NCCs that express SHP2 Q79R show normal DM and frontal bone distribution. (A) NCC fate mapping of the skull at P3. NCC distribution in the frontal bone is identical between control (Wnt1Cre::R26R) and Wnt1Cre::Q79R R26R mice. Arrowheads show the osteofront of the frontal bones. (B) Sagittal section of frontal and parietal bones. The distribution of NCCs in the DM is comparable between the Wnt1Cre::R26R and Wnt1Cre::Q79R R26R mice. FB, frontal bone; PB, parietal bone.
Reduction of ERK1/2 Hyperphosphorylation Restores Normal Skull Formation.
We have shown previously that reduction of ERK1/2 hyperphosphorylation in cardiomyocytes could rescue the ventricular noncompaction and ventricular septal defects that resulted from SHP2 Q79R expression in the heart (10). Because the data from the Wnt1Cre::Q79R frontal bone indicated that ERK1/2 was selectively being phosphorylated (Figs. 2J and S2), we hypothesized that alleviating ERK1/2 hyperphosphorylation might also restore normal skull formation. We treated the mice with U0126, a pharmacologic inhibitor of MAPK/ERK kinase 1/2 that blocks phosphorylation of ERK1/2 (10). Because mouse skull formation is initiated at E13.5 (19), we injected U0126 i.p. on a daily basis (5 mg per kg body weight per day) into the pregnant dams until delivery and continued the injections during the peri- and neonatal periods to the nursing females up to P9 and then to individual pups immediately beneath the scalp until P24.
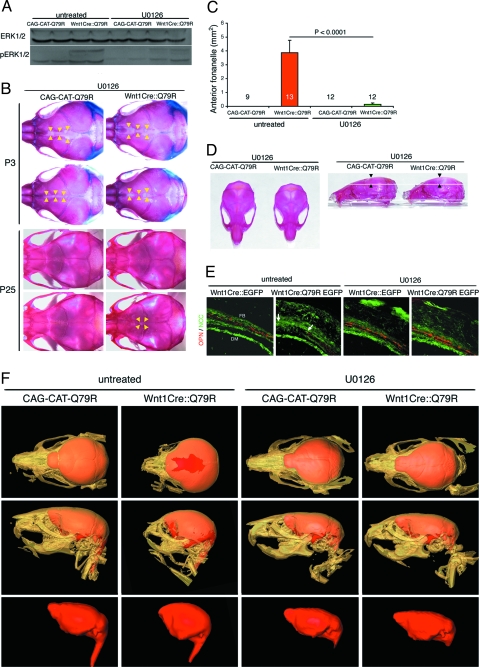
We then examined ERK1/2 phosphorylation in the frontal bones. Compared with the untreated Wnt1Cre::Q79R mice, U0126-treated Wnt1Cre::Q79R mice showed substantially decreased ERK1/2 phosphorylation (Fig. 6A). The alterations in AF size that present in the Wnt1Cre::Q79R skulls relative to CAG-CAT-Q79R controls (Fig. 4A) were not present in the U01216-treated skulls (Fig. 6B). Notably at P25, AF remained patent in only 16.7% (2 of 12) of the Wnt1Cre::Q79R mice after U0126 treatment (Fig. 6 B and C). Skull size, length, mandibular bone length, inner canthal distance, and frontal bone height all resolved toward normalcy after U0126 treatment (Fig. 6D and Table S1). In concordance with more normal frontal bone growth, U0126-treated Wnt1Cre::Q79R mice showed no cleft lip and palate, and postnatal mortality was almost completely abolished (Fig. S1). Body length and weight also increased in the U0126-treated Wnt1Cre::Q79R mice, although the mice still did not reach normal size (Fig. S1).
Fig. 6.
Reduction of ERK1/2 hyperphosphorylation rescues Q79R-induced skull anomalies. (A) Western blot analysis of P3 frontal bones showing ERK1/2 phosphorylation. ERK1/2 hyperphosphorylation in the Wnt1Cre::Q79R frontal bones is reduced after U0126 treatment. (B) Alcian blue and Alizarin red staining to detect cartilage and bone, respectively. Arrowheads identify the osteofronts of the frontal bones. (C) Quantitation of AF size at P25. AF size is substantially reduced in Wnt1Cre::Q79R after U0126 treatment. (D) Improvement of the skull size at P25. Note that frontal bone height returned to normal in Wnt1Cre::Q79R mice after U0126 treatment (arrowheads). Detailed measurements are shown in Table S1. (E) Osteopontin (OPN) expression of P3 frontal bones in untreated and U0126-treated animals. Arrows denote the osteofront of the frontal bone, pointing to the locations where osteopontin is normally expressed but is lacking in the untreated sample. (F) Three-dimensional CT images of the skull and brain at P25. Top: Upper view of the skull (beige) and brain (red). In untreated Wnt1Cre::Q79R mice, frontal bones do not fuse and AF is open. Middle: Lateral view of the skull and brain. Bulging of the frontal bones is prominent in Wnt1Cre::Q79R mice. Bottom: Lateral views of the brain. Consistent with normal skull formation, the brain in untreated Wnt1Cre::Q79R becomes dome-shaped. The skull and brain deformities visible in the Wnt1Cre::Q79R animals were largely absent in the U0126-treated mice.
ERK signaling participates in cell survival, proliferation, and differentiation (20). Because we observed no changes in activated caspase 3 or Ki67, markers of apoptosis and proliferation, respectively, we hypothesized that ERK1/2 hyperactivation affected skull bone differentiation. In the Wnt1Cre::Q79R mice, reduced expression of osteopontin, a marker of osteoblasts differentiation, was apparent, particularly in the osteofront of the frontal bones, indicating that terminal differentiation was either delayed or ablated (Fig. 6E). However, normal levels of osteopontin were restored in the U0126-treated Wnt1Cre::Q79R frontal bones. These data suggest that alterations in osteoblast differentiation through ERK1/2 hyperactivation unfavorably impact normal skull bone growth and that ablation of abnormal ERK1/2 activation can prevent or ameliorate the occurrence of SHP2 Q79R–mediated skull malformation.
X-ray computer-assisted microtomography (microCT) allows 3-dimensional, highly detailed maps of the intact skull to be constructed. We subjected the Wnt1Cre::Q79R and CAG-CAT-Q79R control skulls to microCT (Fig. 6F) to map the effectiveness of inhibiting hyperactivation of ERK1/2 signaling via U0126 treatment. Generating isosurface views from the CT data sets enabled skull morphology to be clearly visualized, and the data sets were segmented to classify image data values belonging to brain tissue. Brain volumes were then visualized by volume-rendering the segmented brain data. The reconstructions of the treated Wnt1Cre::Q79R skulls shows almost complete rescue of the ERK1/2-induced abnormalities, including near-normal frontal bone and mandible development, lack of a bulging, dome-shaped brain, and AF closure.
Discussion
Craniofacial malformations are common, being involved with approximately three-quarters of all congenital human defects and affecting neck, head, or face development (6). Over the past decade, gene mutations affecting craniosynostosis, the premature fusion of 1 or more of the cranial sutures, have been identified. For examples, mutations in FGFR2 account for several severe conditions, including Apert, Pfeiffer, Crouzon, Beare-Stevenson, and Jackson-Weiss syndromes (21). Mutations in FGFR1 and FGFR3 also account for craniosynostoses of variable severity. Saethre-Chotzen syndrome and Boston-type craniosynostosis arise from gain-of-function mutations in the Twist and MSX2 transcription factors, respectively (21–23). MSX2 and ALX4 haploinsufficiency causes inherited defects of skull ossification, with the patients manifesting symmetric parietal foramina or delayed fusion of the frontal and parietal bones (4, 24).
NS patients often present typical facies, but the morphologic and molecular bases of their craniofacial anomalies remain undefined. Knock-in mice carrying another NS-causative mutation in SHP2, D61G, exhibit craniofacial defects, but the molecular basis of the anomalies was not explored (25). In the present study we found that expression of mutant SHP2 in mouse NCCs culminated in the delayed/reduced ossification of NCC-derived frontal bones. These defects were caused by a lack of osteogenic differentiation through sustained ERK1/2 activation. In normal embryogenesis, ERK1/2 is transiently activated in NCCs (26), and it seems that sustained ERK1/2 activation has adverse effects in the NCC-derived structures in the skull. Although numerous studies both in vivo and in vitro have tried to clarify the role of Ras-MAPK signaling in osteogenesis, the results are controversial. However, Ras-MAPK signaling does seem to be essential for the commitment of multipotent progenitors to an osteoblast cell fate, but it can antagonize further osteogenic differentiation (27, 28).
Of course, alterations in NCC-derived cells, such as those populating the DM, may not fully explain the developmental disabilities that often accompany these syndromes. Considering the potential for regulation of adjoining neural structures by the DM and the fact that SHP2 activation in those cells is observed in our mice (Fig. 6), it may be that paracrine effects on adjacent neural structures also play a role in determining the ultimate phenotype. Although this remains purely speculative for SHP2 expression, a role for the DM in brain development has been established (18).
In our previous studies using cell type–specific transcription of SHP2 Q79R, we observed in both cardiomyocytes and endothelial cells ERK1/2 hyperphosphorylation, which was accompanied by developmental abnormalities in those cell populations and their derivatives (9, 10). Whereas elevated levels of activated ERK1/2 in NCCs inhibited mature osteoblast differentiation, in embryonic cardiomyocytes we observed enhanced cell proliferation, ventricular noncompaction, and ventricular septal defects (10). In endothelial cells, increased cell proliferation and reduced apoptosis led to enlarged endocardial cushions (9). The data suggest that cellular response and fate as a result of aberrant ERK1/2 activity are quite different among the cell populations but that normal development can be restored by restoration of normal levels of activated ERK1/2. These data also directly show that altered cell signaling in a single progenitor cell population leads to alterations in the resultant differentiated structures, providing a mechanistic framework for understanding the syndromic presentation that is characteristic of congenital diseases such as NS.
It is becoming clear that normal organogenesis for a number of systems relies at least in part on the precise regulation of the magnitude and temporal window of ERK1/2 phosphorylation. Our data provide insight into the role that ERK1/2 signaling in NCC-derived skull structures plays, as well as a conceptual platform for further studies regarding the craniofacial defects and cardiac abnormalities that present in NS.
Materials and Methods
Transgenic Mice.
All procedures were approved by the Institutional Animal Care and Use Committee. The SHP2 Q79R mutation was introduced into normal SHP2 cDNA by using PCR-based mutagenesis. The full-length construct of SHP2 Q79R was inserted into the CAG-CAT cassette by positional cloning. The C57BL/6 strain was used for all experiments.
Protein Analysis.
Samples were homogenized on ice in radioimmune precipitation assay buffer with 1% phosphatase inhibitor mixture (Sigma). The homogenates were centrifuged at 8,000 × g for 10 min at 4 °C and the supernatant mixed with SDS-PAGE loading buffer and then boiled and centrifuged. Antibodies used were as follows: SH-PTP2 (C-18, 1:500 dilution; Santa Cruz Biotechnology), osteopontin (1:300 dilution, Cosmo Bio), p44/42 MAPK, phospho-p44/42 MAPK, Stat 3, phospho-Stat 3, p38, phospho-p38, Akt, phospho-Akt, and caspase 3 (1:1,000 dilution; Cell Signaling Technology), phospho-MYPT1 (1:3,000 dilution; Upstate), and GAPDH (1:300 dilution; Chemicon, Millipore). Primary antibody binding was visualized by horseradish peroxidase–conjugated secondary antibodies and enhanced chemiluminescence (Amersham, GE Healthcare Biosciences).
Growth Hormone Measurement.
Because there is a morning surge in the release of growth hormone, blood samples were drawn at 9 a.m. The samples were then immediately centrifuged at 8,000 × g for 10 min at 4 °C. The serum was collected and stored at −80 °C until hormone measurement. Growth hormone was measured by ELISA using the rat/mouse growth hormone ELISA kit (LINCO Research).
MicroCT Scans.
All microCT scans were collected in compliance with a protocol approved by the Institutional Animal Care and Use Committee at Cincinnati Children's Hospital. The microCT data sets were collected using a MicroCAT II scanner (Siemens Medical Solutions). The animals were anesthetized using a 1.5 vol% isoflurane/medical air mixture, and anesthesia was maintained during microCT scanning. For each scan, 615 x-ray projections were collected over a total gantry rotation of 205°. For each projection, the x-ray tube voltage, current, and exposure times were 80 kVp, 500 mA, and 650 ms, respectively. Each scan required ≈13 min to complete. The CT data sets were reconstructed using a volumetric (cone beam) reconstruction algorithm (COBRA 5.0; Exxim Computing). The resulting image data sets had an isotropic voxel size of 53 μm. Postprocessing of the CT data was done using Amira 3.0 (Visage Imaging).
Statistics.
All data are expressed as mean ± SEM. Statistical significance was determined using the 2-tailed Student's t test or ANOVA, as appropriate. The significance of individual differences was evaluated using the Scheffé test if ANOVA was significant.
Supplementary Material
Acknowledgments.
This work was supported by National Institutes of Health Grants P01HL69799, P50HL07701, P01HL059408, R01HL087862 (to J.R.).
Footnotes
The authors declare no conflict of interest.
This article is a PNAS Direct Submission.
This article contains supporting information online at www.pnas.org/cgi/content/full/0903302106/DCSupplemental.
References
- 1.Bronner-Fraser M. Mechanisms of neural crest cell migration. Bioessays. 1993;15:221–230. doi: 10.1002/bies.950150402. [DOI] [PubMed] [Google Scholar]
- 2.Tan SS, Morriss-Kay GM. Analysis of cranial neural crest cell migration and early fates in postimplantation rat chimaeras. J Embryol Exp Morphol. 1986;98:21–58. [PubMed] [Google Scholar]
- 3.LeDourin NM, Kalcheim G. The Neural Crest. 2nd Ed. Cambridge, UK: Cambridge Univ Press; 1999. [Google Scholar]
- 4.Wilkie AO, Morriss-Kay GM. Genetics of craniofacial development and malformation. Nat Rev Genet. 2001;2:458–468. doi: 10.1038/35076601. [DOI] [PubMed] [Google Scholar]
- 5.Jiang X, et al. Tissue origins and interactions in the mammalian skull vault. Dev Biol. 2002;241:106–116. doi: 10.1006/dbio.2001.0487. [DOI] [PubMed] [Google Scholar]
- 6.Chai Y, Maxson RE., Jr Recent advances in craniofacial morphogenesis. Dev Dyn. 2006;235:2353–2375. doi: 10.1002/dvdy.20833. [DOI] [PubMed] [Google Scholar]
- 7.Tartaglia M, et al. Mutations in PTPN11, encoding the protein tyrosine phosphatase SHP-2, cause Noonan syndrome. Nat Genet. 2001;29:465–468. doi: 10.1038/ng772. [DOI] [PubMed] [Google Scholar]
- 8.Noonan JA. Noonan syndrome. An update and review for the primary pediatrician. Clin Pediatr (Phila) 1994;33:548–555. doi: 10.1177/000992289403300907. [DOI] [PubMed] [Google Scholar]
- 9.Krenz M, et al. Role of ERK1/2 signaling in congenital valve malformations in Noonan syndrome. Proc Natl Acad Sci USA. 2008;105:18930–18935. doi: 10.1073/pnas.0806556105. [DOI] [PMC free article] [PubMed] [Google Scholar]
- 10.Nakamura T, et al. Mediating ERK 1/2 signaling rescues congenital heart defects in a mouse model of Noonan syndrome. J Clin Invest. 2007;117:2123–2132. doi: 10.1172/JCI30756. [DOI] [PMC free article] [PubMed] [Google Scholar]
- 11.Kontaridis MI, et al. Deletion of Ptpn11 (Shp2) in cardiomyocytes causes dilated cardiomyopathy via effects on the extracellular signal-regulated kinase/mitogen-activated protein kinase and RhoA signaling pathways. Circulation. 2008;117:1423–1435. doi: 10.1161/CIRCULATIONAHA.107.728865. [DOI] [PMC free article] [PubMed] [Google Scholar]
- 12.Tartaglia M, et al. PTPN11 mutations in Noonan syndrome: Molecular spectrum, genotype-phenotype correlation, and phenotypic heterogeneity. Am J Hum Genet. 2002;70:1555–1563. doi: 10.1086/340847. [DOI] [PMC free article] [PubMed] [Google Scholar]
- 13.Echelard Y, Vassileva G, McMahon AP. Cis-acting regulatory sequences governing Wnt-1 expression in the developing mouse CNS. Development. 1994;120:2213–2224. doi: 10.1242/dev.120.8.2213. [DOI] [PubMed] [Google Scholar]
- 14.Gotoh N. Regulation of growth factor signaling by FRS2 family docking/scaffold adaptor proteins. Cancer Sci. 2008;99:1319–1325. doi: 10.1111/j.1349-7006.2008.00840.x. [DOI] [PMC free article] [PubMed] [Google Scholar]
- 15.Chan G, Kalaitzidis D, Neel BG. The tyrosine phosphatase Shp2 (PTPN11) in cancer. Cancer Metastasis Rev. 2008;27:179–192. doi: 10.1007/s10555-008-9126-y. [DOI] [PubMed] [Google Scholar]
- 16.Francis-West PH, Robson L, Evans DJ. Craniofacial development: The tissue and molecular interactions that control development of the head. Adv Anat Embryol Cell Biol. 2003;169:III–VI. 1–138. doi: 10.1007/978-3-642-55570-1. [DOI] [PubMed] [Google Scholar]
- 17.Morriss-Kay GM, Wilkie AO. Growth of the normal skull vault and its alteration in craniosynostosis: Insights from human genetics and experimental studies. J Anat. 2005;207:637–653. doi: 10.1111/j.1469-7580.2005.00475.x. [DOI] [PMC free article] [PubMed] [Google Scholar]
- 18.Gagan JR, Tholpady SS, Ogle RC. Cellular dynamics and tissue interactions of the dura mater during head development. Birth Defects Res C Embryo Today. 2007;81:297–304. doi: 10.1002/bdrc.20104. [DOI] [PubMed] [Google Scholar]
- 19.Verzi MP, et al. The transcription factor MEF2C is required for craniofacial development. Dev Cell. 2007;12:645–652. doi: 10.1016/j.devcel.2007.03.007. [DOI] [PMC free article] [PubMed] [Google Scholar]
- 20.Ebisuya M, Kondoh K, Nishida E. The duration, magnitude and compartmentalization of ERK MAP kinase activity: Mechanisms for providing signaling specificity. J Cell Sci. 2005;118:2997–3002. doi: 10.1242/jcs.02505. [DOI] [PubMed] [Google Scholar]
- 21.Bonaventure J, El Ghouzzi V. Molecular and cellular bases of syndromic craniosynostoses. Expert Rev Mol Med. 2003;5:1–17. doi: 10.1017/S1462399403005751. [DOI] [PubMed] [Google Scholar]
- 22.Howard TD, et al. Mutations in TWIST, a basic helix-loop-helix transcription factor, in Saethre-Chotzen syndrome. Nat Genet. 1997;15:36–41. doi: 10.1038/ng0197-36. [DOI] [PubMed] [Google Scholar]
- 23.Ma L, Golden S, Wu L, Maxson R. The molecular basis of Boston-type craniosynostosis: The Pro148→His mutation in the N-terminal arm of the MSX2 homeodomain stabilizes DNA binding without altering nucleotide sequence preferences. Hum Mol Genet. 1996;5:1915–1920. doi: 10.1093/hmg/5.12.1915. [DOI] [PubMed] [Google Scholar]
- 24.Mavrogiannis LA, et al. Haploinsufficiency of the human homeobox gene ALX4 causes skull ossification defects. Nat Genet. 2001;27:17–18. doi: 10.1038/83703. [DOI] [PubMed] [Google Scholar]
- 25.Araki T, et al. Mouse model of Noonan syndrome reveals cell type- and gene dosage-dependent effects of Ptpn11 mutation. Nat Med. 2004;10:849–857. doi: 10.1038/nm1084. [DOI] [PubMed] [Google Scholar]
- 26.Corson LB, Yamanaka Y, Lai KM, Rossant J. Spatial and temporal patterns of ERK signaling during mouse embryogenesis. Development. 2003;130:4527–4537. doi: 10.1242/dev.00669. [DOI] [PubMed] [Google Scholar]
- 27.Ge C, Xiao G, Jiang D, Franceschi RT. Critical role of the extracellular signal-regulated kinase-MAPK pathway in osteoblast differentiation and skeletal development. J Cell Biol. 2007;176:709–718. doi: 10.1083/jcb.200610046. [DOI] [PMC free article] [PubMed] [Google Scholar]
- 28.Schindeler A, Little DG. Ras-MAPK signaling in osteogenic differentiation: friend or foe? J Bone Miner Res. 2006;21:1331–1338. doi: 10.1359/jbmr.060603. [DOI] [PubMed] [Google Scholar]
Associated Data
This section collects any data citations, data availability statements, or supplementary materials included in this article.


