Abstract
Performance for a variety of visual tasks improves with practice. The purpose of this study was to determine the nature of the processes underlying perceptual learning of identifying letters in peripheral vision. To do so, we tracked changes in contrast thresholds for identifying single letters presented at 10° in the inferior visual field, over a period of six consecutive days. The letters (26 lowercase Times-Roman letters, subtending 1.7°) were embedded within static two-dimensional Gaussian luminance noise, with rms contrast ranging from 0% (no noise) to 20%. We also measured the observers’ response consistency using a double-pass method on days 1, 3 and 6, by testing two additional blocks on each of these days at luminance noise of 3% and 20%. These additional blocks were the exact replicates of the corresponding block at the same noise contrast that was tested on the same day. We analyzed our results using both the linear amplifier model (LAM) and the perceptual template model (PTM). Our results showed that following six days of training, the overall reduction (improvement across all noise levels) in contrast threshold for our seven observers averaged 21.6% (range: 17.2–31%). Despite fundamental differences between LAM and PTM, both models show that learning leads to an improvement of the perceptual template (filter) such that the template is more capable of extracting the crucial information from the signal. Results from both the PTM analysis and the double-pass experiment imply that the stimulus-dependent component of the internal noise does not change with learning.
Keywords: Perceptual learning, Training, Letter identification, Peripheral vision
1. Introduction
Performance for a variety of visual tasks improves with practice (e.g. Ball & Sekuler, 1982, 1987; Beard, Levi, & Reich, 1995; Fahle & Edelman, 1993; Fiorentini & Berardi, 1980, 1981; Karni & Sagi, 1991; McKee & Westheimer, 1978; Poggio, Fahle, & Edelman, 1992; Saarinen & Levi, 1995). This improvement is often termed “perceptual learning”. Perceptual learning occurs in foveal vision, as well as in peripheral vision (Beard et al., 1995; Chung, 2002; Chung, Legge, & Cheung, 2004). For instance, in the fovea, the ability to judge whether or not two lines are perfectly aligned improves by about 40% after 2000–2500 trials of practice (McKee & Westheimer, 1978). At 5° eccentricity in the periphery, performance for the same task improves by approximately 20% following 6120 trials of practice (Beard et al., 1995).
While strong perceptual learning has been well documented with unfamiliar tasks, e.g. identifying random texture patterns (Gold, Bennett, & Sekuler, 1999) or unfamiliar faces (see Fine & Jacobs, 2002 for a recent review), it is less clear whether learning occurs when the task is highly familiar, such as letter identification. Using a letter C stimulus, Westheimer (2001) found that the acuity of his observers for identifying the gap of the C stimulus in peripheral vision did not improve with practice. Despite the fact that observers do not habitually use their peripheral vision for identifying letters (which should favor a learning effect), when letter size was used as the metric of performance, there was no improvement with practice. In contrast, when using percent- correct identification as the performance measurement, Chung et al. (2004) reported an improvement in performance for identifying the 26 lowercase letters that were approximately twice the acuity-size, following training at 10° eccentricity in the upper or lower visual fields. Thus, improvement in performance is possible even with the highly familiar letter identification task. However, what underlies this improvement? The purpose of this study was to determine the nature of the processes underlying perceptual learning of letter identification in peripheral vision.
Our interest in studying perceptual learning of letter identification in peripheral vision stems from our interest in understanding the limitations and potentialities of peripheral vision in relation to reading. Reading is slow in peripheral vision, and millions of people who lose their central vision as a result of macular diseases such as age-related macular degeneration have to rely on their residual peripheral vision to read. Letter identification is the “bottleneck” for reading (Legge, Mansfield, & Chung, 2001). Pelli, Farell, and Moore (2003) have shown that despite a lifetime of reading, word recognition for even the most common three-letter words is limited by the necessity to “rigorously and independently” detect the features (letters) that comprise the words. Chung et al. (2004) have shown that practice in identifying letters can lead to an improvement in peripheral reading speed. Therefore, an understanding of the nature of the processes underlying perceptual learning in letter identification in peripheral vision might enable the development of strategies to train people with central vision loss to read faster using their residual peripheral vision.
In foveal vision, it has long been suggested that perceptual learning results from a “fine tuning” of the mechanisms underlying the visual task (McKee & Westheimer, 1978). Fiorentini and Berardi (1980, 1981) further suggested that this “fine tuning” of the mechanisms is likely to take place at the early stages of visual processing. Using a simultaneous spatial masking paradigm to unveil the properties of the spatial mechanism underlying Vernier discrimination following training, Saarinen and Levi (1995) found that the improvement in Vernier acuity following training is accompanied by an approximately proportional narrowing of the orientation tuning characteristics of Vernier acuity. However, it was the incorporation of the external noise paradigm into perceptual learning studies in recent years that enabled us to isolate the mechanism underlying perceptual learning. The basis of the external noise paradigm is that the addition of external noise to a signal has a characteristic impact on task performance. To relate the external noise to task performance, very often, we choose to represent task performance by the signal strength required for the observers to reach a threshold criterion of accuracy of performing the task. When plotting the threshold as a function of the external noise on log–log axes, the function shows the characteristic threshold vs. noise curve (TvN), often referred to as the noise-masking function. Essentially, when the external noise is low, threshold is relatively independent of the external noise because it is limited by the noise internal to the system. When the external noise exceeds the internal noise of the system, threshold increases in proportion to the external noise (or nearly so). The proportional constant, when compared to that of an ideal observer, reveals how well the system utilizes stimulus information when the internal noise is no longer a limiting factor. The TvN approach thus affords us a way to measure and monitor changes in the internal noise of the system, as well as its ability to extract crucial stimulus information.
In this study, we applied the TvN approach to evaluate learning of letter identification in peripheral vision. In a second experiment we also examined observers’ consistency in making their responses when identifying letters embedded in external noise. Burgess and Colborne (1988) first applied a double-pass method to analyze observers’ consistency in detecting signals in visual noise. The method measures observers’ performance through the same sequence of signal-noise combinations (stimuli) twice. Because the stimuli are identical in both passes, any difference in observers’ performance can be attributed to observers’ consistency, instead of the stimulus. An increase in consistency as a result of learning, particularly in the high external noise condition, would imply a reduction in the internal variability of an observer that was induced by the stimulus (as opposed to internal noise independent of the stimulus). To anticipate, the principal findings from both experiments suggest that improvements in performance due to learning can be attributed to the template (or filter) becoming more capable of extracting the crucial information from the stimuli, but not to a reduction in the observers’ internal noise.
2. Methods
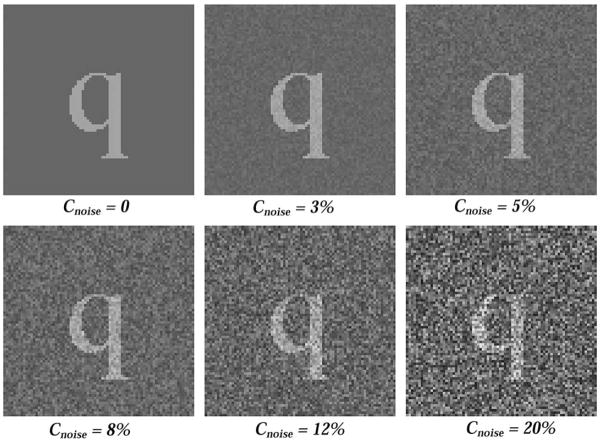
To determine the mechanism underlying perceptual learning in identifying letters in peripheral vision, we tracked changes in contrast thresholds for identifying single letters presented in visual noise, at 10° eccentricity in the inferior visual field, over a period of six consecutive days. Letters used were the 26 lowercase letters of the Times-Roman alphabet. Letter size was 1.7° (x-height), which was about twice the acuity at 10° eccentricity in the inferior visual field, for our group of observers. We presented the letters, embedded in a two-dimensional noise field composed of Gaussian luminance noise, against a gray background of 65 cd/m2. The noise field was generated by creating an array of 78 × 78 checks, with each check subtending an angle of 4 × 4′. The gray level of each check was drawn randomly from a Gaussian distribution with a mean of zero and variance that depends on the amount of external noise for each noise condition. Six external noise (rms) contrasts were examined: 0 (no-noise), 3%, 5%, 8%, 12% and 20% relative to the background luminance. Fig. 1 shows the letter “q”, at a letter contrast of 30%, embedded in each of the six levels of external noise. Each noise contrast was examined in a separate block of trials. The order of examining these six noise contrasts was presented in a random order for each observer and in each session.
Fig. 1.
The letter “q”, at a letter contrast of 30%, is rendered in the presence of the six levels of external noise.
In each block of trials, we used the Method of Constant Stimuli to present letters at six levels of letter contrast, in a random order. Each letter contrast was tested 25 times, thus there were a total of 150 trials in each block. Stimulus presentation duration was 200 ms. Observers were asked to maintain fixation on a small red fixation target throughout the testing, while identifying the letter presented on each trial. Audio feedback was provided for each correct response. A cumulative Gaussian function was used to fit the data from each block. We defined thresholds as the letter contrast that yields 50% correct letter identification on the fitted psychometric function, after correction for guessing (corresponding to a d′ of 2.0).
Seven observers, aged 16–27 participated in this study. All had normal or corrected-to-normal vision (20/20 or better in each eye), and were not aware of the purpose of the study. Testing was performed binocularly in a well-lit room. None of the observers had prior experience in visual psychophysical experiments. Each observer granted oral and written consent (in the case of the 16 year-old, consent was obtained from her parents), after the procedures of the experiment were explained. All seven observers completed the entire study, which consisted of six sessions, scheduled on six consecutive days.
2.1. Data analyses
We analyzed our TvN data using the linear amplifier model (LAM: Barlow, 1956; Barlow, 1957; Pelli, 1990), which is the most commonly used model for this type of data. The LAM is essentially an ideal observer model (Pelli, 1990). The advantage of this model lies in its simplicity, as it models human performance in terms of only two parameters: equivalent internal noise (Neq) and sampling efficiency (η). We use these parameters to characterize the improvements due to learning. We are also interested in changes in the optimal contrast threshold (Th0, corresponding to the threshold obtained without noise), which co-varies with Neq and η. Equivalent internal noise (Neq) refers to the variance (or spectral density) of the external noise that causes the contrast energy threshold (proportional to the square of contrast threshold) to be twice the optimal contrast-energy threshold. It is therefore equal to the amount of noise internal to an observer, if we assume such internal noise to be additive and independent of the stimulus. Sampling efficiency (η) refers to the ability of human observers, relative to the ideal observer, to extract the crucial information from the stimulus, taking into account the fundamental limits imposed by the internal and external noise. It is proportional to . Since we are interested in whether training leads to a change in sampling efficiency (i.e., relative sampling efficiency), we do not need to compute the performance of the ideal observer in order to derive the proportional constant (β in the equation below). The following is a mathematical description of the LAM model:
where β is the proportional constant that relates noise variance to contrast energy, as determined by the ideal observer for whom η equals to one and Neq is zero; Next is the variance of the external noise.
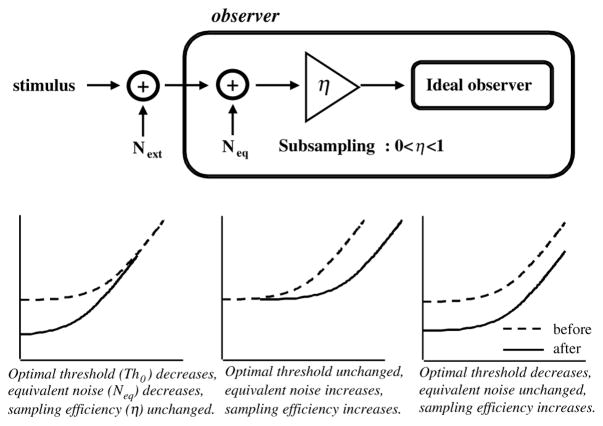
If learning leads to an improvement in thresholds, then, according to LAM, one of the following three scenarios might account for the improvement (Fig. 2): (1) An improvement only at low-noise levels but not at high-noise levels. In this case, Th0 improves and Neq becomes smaller, but η remains unchanged. (2) No improvement at low-noise levels but improvements at high-noise levels. In this case, Th0 remains unchanged, Neq increases and η also increases. Dosher and Lu (1999) refer to this as external noise exclusion. (3) A uniform improvement in threshold across all noise levels, so that the entire TvN function shifts vertically downward along the y-axis, when plotted on log–log axes. In this case, Th0 improves, Neq remains unchanged and η increases.
Fig. 2.
A schematic figure showing the linear amplifier model (LAM). The bottom panels illustrate the three scenarios (contrast threshold vs. external noise on log–log axes) in which improvement in performance can occur as a result of training: (left) an improvement only at the low noise levels; (middle) an improvement only at the high noise levels and (right) uniform improvement across all noise levels. Predictions as to how the parameters of the model changes for the three scenarios are given below each of the three panels.
2.2. Double-pass measurements
LAM assumes that the internal noise is additive and independent of the stimulus. The model is blind to any internal noise that scales with stimulus strength. Changes in such stimulus-dependent noise will be reflected as a change in sampling efficiency with respect to LAM. To further evaluate if the internal noise (stimulus- independent or dependent) changes with learning, we adopted the double-pass method 1 developed by Burgess and Colborne (1988) to assess the observers’ consistency. An improvement in observers’ consistency in the low-noise condition represents a reduction in internal noise of both the stimulus-independent and dependent kind. High external noise overwhelms the stimulus-independent internal noise, thus any improvement in observers’ consistency in the high-noise condition reflects a reduction in the stimulus-dependent kind of the internal noise. Observers were tested with two runs of the identical set of stimuli (letter-plus-noise patterns). In this study, we retested each observer at two noise contrast ––3% (low-noise level) and 20% (high-noise level), at the first, third and sixth sessions. Thus, instead of six blocks of trials, each observer completed eight blocks of trials in each of these three sessions. Observers did not know the purpose of the extra testing, they were only informed that these three sessions lasted longer than the other sessions. In each of these sessions, the original set of six noise contrast was tested first, before the additional two blocks of trials. Each of the two additional blocks was the exact replicate of their respective first run of the same noise contrast within the session. In other words, the noise pattern, stimulus letter and letter contrast were identical for the same trial number in the first and the second run of the same noise contrast within the same session. By putting the second run of the same condition at the end of the session, observers’ performance might be degraded due to fatigue; but it is equally possible that observers’ performance might improve due to the additional training within the session.
3. Results
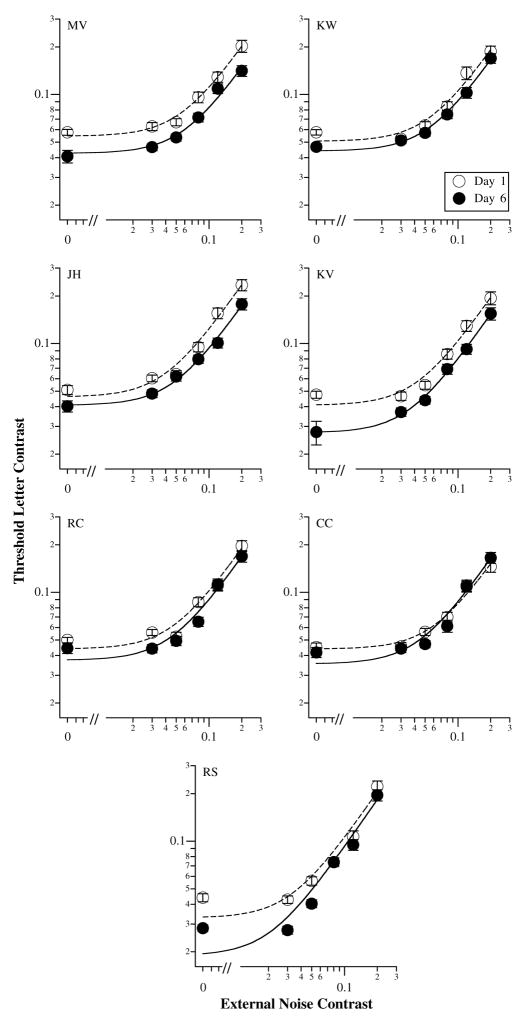
Contrast threshold for letter identification is plotted as a function of noise contrast (noise-masking function) for the seven observers in Fig. 3. In each panel, data are plotted for the same observer, for fit curves as given by LAM. The goodness-of- fit (reduced Chi-square) of these curves fit to each day of each observer’s data is given in Table 1. If learning leads to an improvement in letter identification performance, then the contrast thresholds obtained on day 1 should be the highest, and should improve (decrease) as training progresses. This is the case for five of the seven observers (observers RC and CC did not show much change in thresholds across the six days of training). The proportion of observers who did not show any learning effect in this study (≈28%) is similar to that reported by Fahle and Henke-Fahle (1996). Note also that in a few cases, the curves do not provide a good fit to the data (e.g. those for RS).
Fig. 3.
Threshold letter contrast is plotted as a function of external noise contrast, for the seven observers. For clarity, in each panel, data are shown for the same observer, obtained on the first (day 1) and the last (day 6) day only. Error bars represent ±1 SEM. Curves fit through data points represent the best-fit curves using the LAM.
Table 1.
Goodness of fit of the LAM and PTM curve-fita
| Day | MV | JH | KV | KW | RC | RS | CC |
|---|---|---|---|---|---|---|---|
| LAM: χ2/4 | |||||||
| 1 | 1.182 | 3.183 | 3.979 | 4.732 | 5.897 | 8.274 | 1.143 |
| 2 | 0.730 | 1.542 | 2.775 | 2.947 | 1.993 | 5.085 | 4.299 |
| 3 | 2.722 | 2.437 | 0.393 | 1.863 | 2.591 | 3.542 | 3.801 |
| 4 | 1.738 | 2.351 | 3.150 | 2.242 | 0.928 | 8.770 | 5.006 |
| 5 | 5.042 | 2.597 | 3.893 | 3.131 | 4.955 | 9.053 | 1.716 |
| 6 | 1.118 | 0.552 | 0.530 | 0.769 | 3.497 | 18.223 | 4.107 |
| PTM: Day 1=Sum(χ2)/14, days 2–6: Sum(χ2)/15 | |||||||
| 1 | 0.534 | 0.478 | 0.761 | 1.316 | 1.512 | 2.290 | 1.393 |
| 2 | 0.233 | 1.225 | 0.825 | 0.663 | 0.448 | 0.642 | 1.914 |
| 3 | 0.599 | 0.827 | 0.601 | 1.497 | 0.699 | 0.581 | 0.516 |
| 4 | 0.786 | 0.582 | 1.179 | 0.921 | 0.889 | 1.365 | 0.630 |
| 5 | 1.565 | 0.684 | 1.014 | 0.331 | 0.864 | 2.386 | 1.664 |
| 6 | 1.511 | 0.809 | 0.248 | 0.504 | 0.446 | 2.261 | 0.934 |
Here, the goodness-of-fit was defined as the reduced χ2, i.e. the χ2 as given by the curvefit normalized by the degrees of freedom, which is the difference between the number of data points and the number of free parameters in a model. A reduced χ2 close to unity indicates a good fit. We used reduced χ2 to represent the goodness-of-fit because the degrees of freedom differ between LAM and PTM. For PTM, a set of four (for day 1) and three (for days 2–6) parameters were used to simultaneously fit three TvN curves of each observer at three different threshold criteria (d′ of 1.0, 2.0 and 2.9) on each day. This is because at least two TvN curves obtained at two different criteria are needed to constrain PTM, and three to test if PTM is criterion-independent. The total number of data points for each day was 18 per observer. In contrast, parameters of LAM often depend on the criterion used. A single set of LAM parameters could not simultaneously fit TvN curves of multiple criteria for our task. The goodness-of-fit measurements for LAM were computed with the TvN curve obtained at a d′ of 2.0. There were six data points and two model parameters in this case.
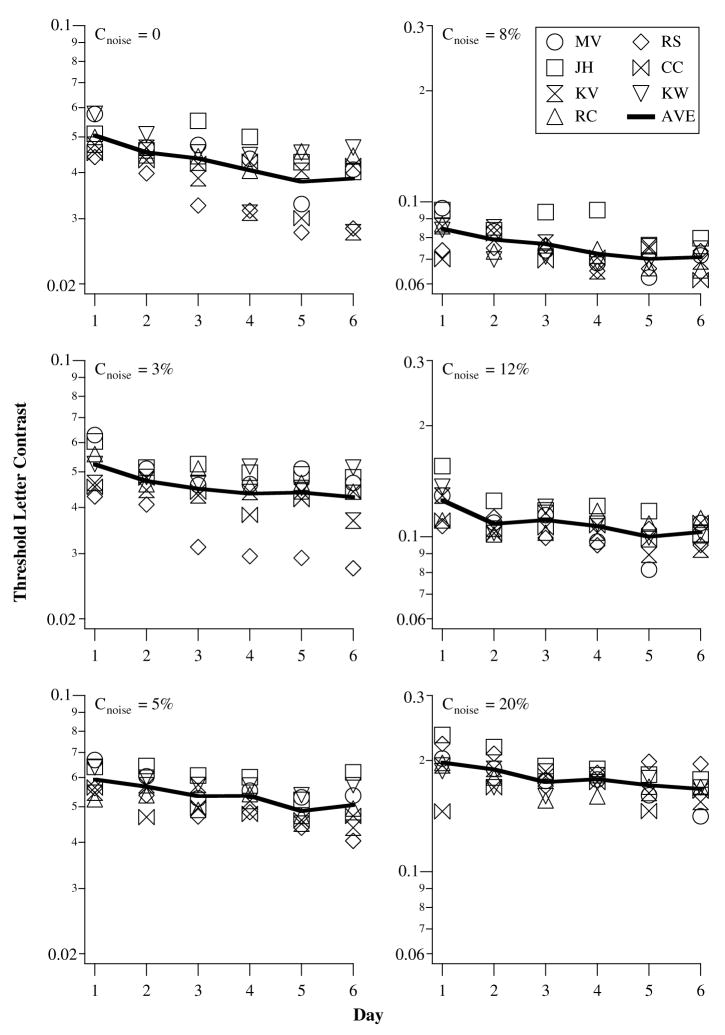
In Fig. 4, we replot the threshold contrast as a function of training days, for each individual noise level, to show how learning progresses with time. In each panel (a given noise level), data are plotted for all seven observers, with the average thresholds connected by the thick solid line. There is a progressive reduction in threshold contrast as training progresses, although the overall reduction (improvement across all noise levels) averages only 21.6% (range: 17.2–31%). This magnitude of improvement is similar to that reported by Li, Levi, and Klein (2004) who examined perceptual learning in a position discrimination task at the fovea.
Fig. 4.
Threshold letter contrast is plotted as a function of training day, for each level of external noise contrast. In each panel, data from individual observers, as well as the group mean contrast thresholds, are shown. Note the change in the scale of the ordinate between the left and the right columns of panels.
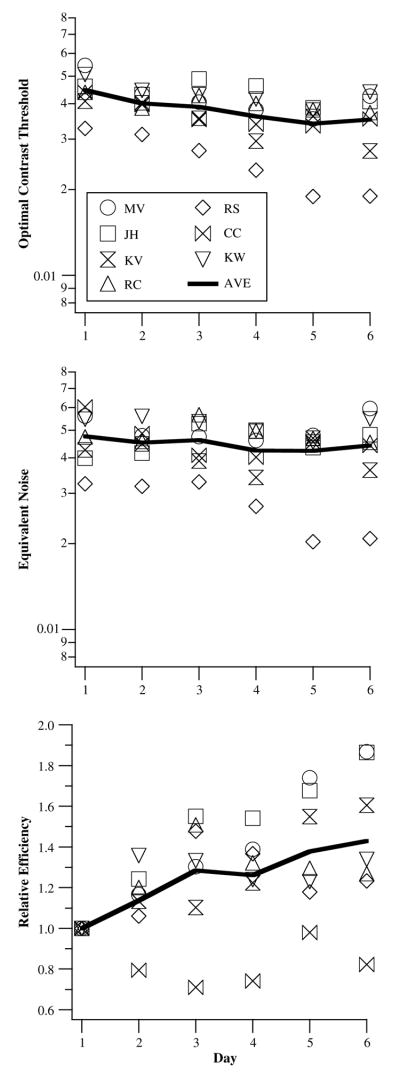
To determine the nature of the processes underlying perceptual learning, we compared the parameters of LAM (as derived from the best-fit curves to the data of each day), as a function of training days in Fig. 5. Averaged across the six observers, there is a significant decrease in optimal contrast threshold between the first and the last day (0.045 vs. 0.035: paired-t(df=6) = 7.08, p = 0.0004), no change in equivalent internal noise (0.043 vs. 0.036: paired-t(df=6) = 1.07, p = 0.33), and an improvement in the relative sampling efficiency (t(df=6) = 3.01, p = 0.024). The significance of these changes with respect to LAM will be discussed in Section 4.
Fig. 5.
The three parameters of LAM are plotted as a function of training day: optimal contrast threshold (top), equivalent internal noise (middle) and relative sampling efficiency (bottom). Data are shown for each individual observer. Thick curves drawn through the data points represent the values averaged across the seven observers.
3.1. Double-pass
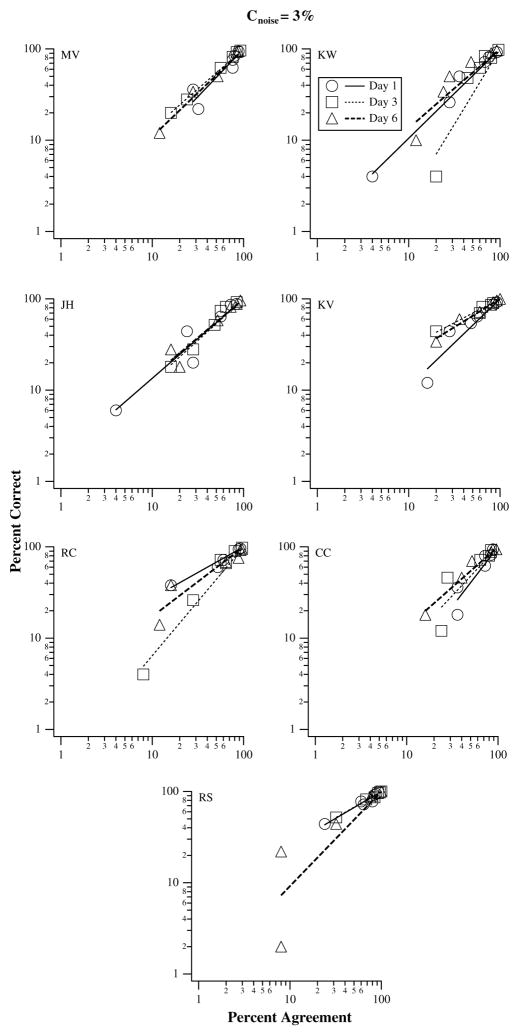
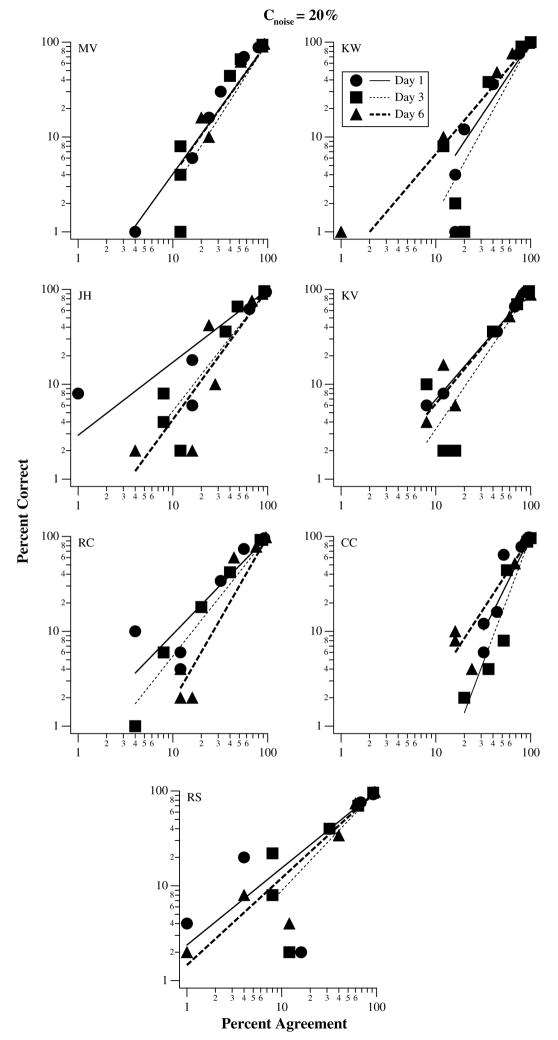
Data obtained using the double-pass method in this study, for the 3% and 20% external noise level, are shown in Figs. 6 and 7, respectively. Following Burgess and Colborne (1988) and Gold et al. (1999), we present the data as percent-correct performance vs. percent- agreement of responses between the two runs. Percent-correct performance refers to the averaged percent-correct performance of letter identification of the two runs. Percent-agreement of responses was determined by comparing the responses to the same stimuli (and noise pattern) between the two runs, regardless of whether the response was correct or not. If learning results from a reduction in the observers’ internal noise (stimulus-independent and/or stimulus-dependent), then we would expect that with training, observers would become more consistent in making their responses. This would result in an increase in the percent agreement between the two runs, for a given percent-correct letter identification performance. In other words, the percent- correct vs. percent-agreement function should shift systematically toward the right as training progresses. We fit each set of data using a straight line on log–log axes that passes through the point (100,100). The slope of this line represents the relationship between percent-correct and percent-agreement. To quantify whether learning results in a change in the percent-correct vs. percent-agreement function, we compare the slopes of these lines obtained on different training days. A repeated measures ANOVA performed on the slopes of these lines confirms that these lines do not shift as a function of training day (F(df=2,12) = 2.01, Greenhouse– Geisser corrected p = 0.19). This result implies that the internal noise (stimulus-independent and stimulus-dependent) does not change with training.
Fig. 6.
Percent-correct of letter identification is plotted as a function of percent-agreement between the two runs of the identical signal-noise combination (the double-pass method), for an external noise level of 3% contrast. Straight lines through the data-set represent the curve-fit (see text for details). If an improvement in performance is attributed to a reduction in the internal noise, then the percent-correct vs. percent-agreement function should fan out, or, the slope of the straight line should change systematically, from left to right, as learning progressed. This was not what we found.
Fig. 7.
Similar to Fig. 6, except that the external noise level was 20% contrast.
4. Discussion
Following six consecutive days of repeated testing (at least 900 trials per day), five of our seven observers showed a sizeable improvement (a reduction in contrast threshold) in their letter identification performance at the trained eccentric retinal location (10° eccentricity in the inferior visual field). This finding is consistent with that of Chung et al. (2004) in which percent-correct performance of letter identification at 10° eccentricity was shown to improve with training.
Westheimer (2001) showed that peripheral Landolt C acuity does not benefit from training. While these results may seem to be at odds with ours, there are several reasons why they might be expected to differ. First, we measured contrast thresholds for identifying letters from amongst a large array (26); a more demanding task than identifying the orientation of a C. Second, our letters were a fixed size, about twice the acuity limit. Because the slope of the high spatial frequency limb of the contrast sensitivity function is very steep, a 20% change in sensitivity (i.e., a 20% change along the contrast axis) translates into a very small (≈6.4%) change along the size (spatial frequency) axis. Thus, even if learning occurred, it would be expected to produce only very tiny changes in acuity. Third, it is also possible that Westheimer did not see learning because the size of the stimulus (and therefore the visual information (i.e. template) needed to perform the task) was the parameter used to increase task difficulty. This would make it difficult to learn a specific template since it would be changing over time. Finally, peripheral acuity is likely to be limited by anatomical constraints of the retina, e.g. the density of photoreceptors and the convergence of photoreceptors onto ganglion cells (e.g. Levi, Klein, & Aitsebaomo, 1985), therefore, improvement in acuity might not be possible because the retinal anatomy is unlikely to change with training.
Recently, Dosher and Lu (2004) examined whether perceptual learning at the fovea occurred at the first or second stage of visual processing. They measured contrast thresholds for discriminating the letter K from its mirror images for first (luminance-defined) and second- order (texture-defined) stimuli embedded in external Gaussian noise following five days of training. For first-order stimuli, they reported no improvement in contrast threshold. However, for second-order stimuli, there was a reduction (improvement) in contrast threshold, with the magnitude of improvement similar to the average magnitude reported in the present paper. Dosher and Lu argued that their results hint at a site for perceptual learning to be located at the second (nonlinear) stage of visual processing, at least for foveal tasks. Within the general context of a linear–nonlinear –linear model, our results suggest that for peripheral (first-order) letter identification task, learning is possible at the first (linear) stage of visual processing. Because nonlinearities can be combined to form a linear system, our results, although parsimoniously modeled by linear factors alone, do not guarantee the site of learning must be at a linear stage of visual processing, nor do they guarantee that the physiological site of learning must be early. Although differences in perceptual learning between the fovea and periphery (e.g. Chung, 2002) may be due to difference in the learning sites, they may simply reflect the fact that foveal letter identification is over-trained through years of reading, while peripheral vision is inexperienced in this task. In other words, with regard to letter-identification, peripheral vision may be amblyopic.
We found that the improvement in contrast threshold for letter identification following training occurs almost uniformly across all levels of external noise. To derive the nature of the processes underlying the improvement, we applied the LAM to analyze our data. Analysis using the LAM shows that training leads to an increase in the relative sampling efficiency, but no changes to the equivalent internal noise. As a result, the optimal contrast threshold was reduced. These findings are very similar to those reported by Gold et al. (1999), who showed that learning to identify faces and random texture in the fovea is due to an increase in the sampling efficiency 2 but not a reduction in the equivalent noise. Our results are also similar to the changes seen in foveal position discrimination following learning (Li et al., 2004). Like Gold et al. (1999), Li et al. found that practice improved performance more or less uniformly across (positional) noise levels––consistent with an improvement in sampling efficiency. In a second experiment, Li et al. (2004) measured the observer’s perceptual template using the classification image technique, and found that learning re-tuned the observer’s template (i.e., it became more ideal) resulting in improved sampling efficiency. Here, using a different task (letter identification) and in a peripheral retinal location (10° eccentricity inferior visual field), we also attribute learning to an increase in the sampling efficiency. In plain words, an increase in sampling efficiency means that observers’ template for the task becomes closer to that of the ideal observer, so that the template is more capable of extracting the crucial information from the signal.
4.1. The perceptual template model
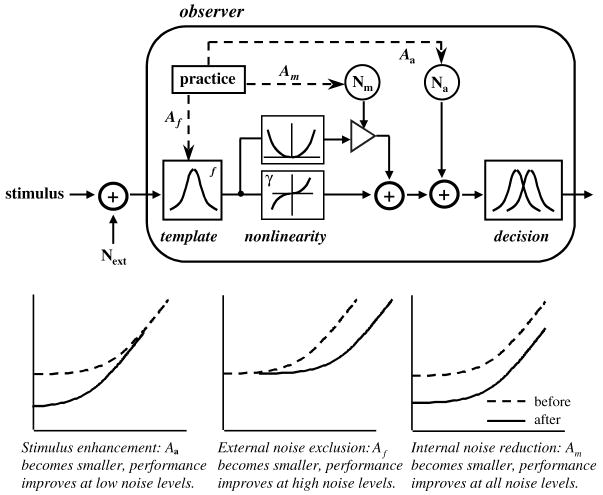
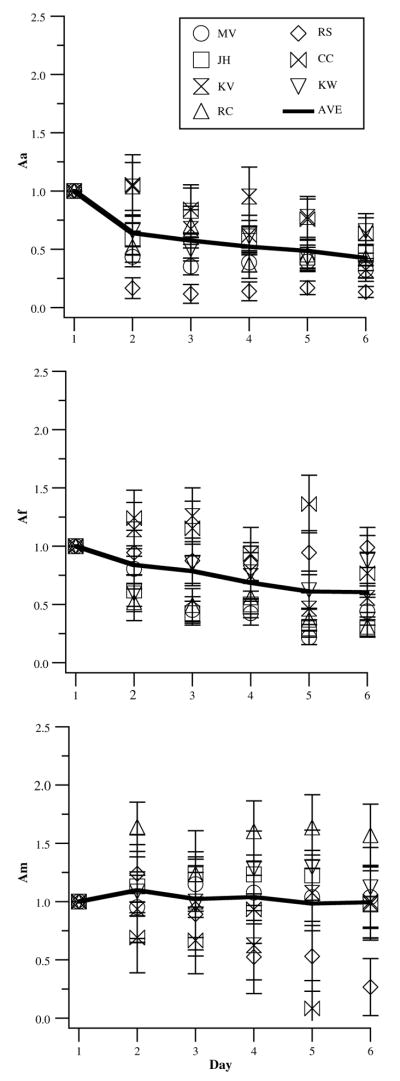
The LAM analysis, although popular (e.g. Gold et al., 1999; Legge, Kersten, & Burgess, 1987; Tjan, Braje, Legge, & Kersten, 1995), may be an over simplification. First, when threshold contrast energy is plotted as a function of external noise variance, the function is assumed to be a straight line. This restriction, however, has very little impact on our data since the deviation from linearity in our results was slight, and when presented, concentrated within the low external noise regime. Second, the LAM analysis is criterion-dependent, thus the changes in sampling efficiency and equivalent internal noise as analyzed by the model are also criterion- dependent. To ascertain that our qualitative findings are not specific to the criterion used, we reanalyzed our data using two approaches. First, we reanalyzed our data using LAM for thresholds specified at two other criteria––d′ of 1.0 and 2.9, corresponding to 20% and 80% correct performance (after correction for guessing) on our psychometric functions. Analyses using these two criteria yielded qualitatively similar results (Tjan, Chung, & Levi, 2002). Second, we reanalyzed our data using the perceptual template model (PTM: Dosher & Lu, 1998; Dosher & Lu, 1999; Lu & Dosher, 2004). The PTM extends LAM to include a nonlinear transducer function and a stimulus-dependent noise component. The added machinery allows us to fit the data at more than one criterion simultaneously. Details of this model can be found elsewhere (Dosher & Lu, 1998; Dosher & Lu, 1999; Lu & Dosher, 2004). In brief, PTM attributes the improvement as a result of learning to three mechanisms in isolation or in combination: stimulus enhancement, external noise exclusion and internal multiplicative noise suppression (Fig. 8). According to the model, if learning is a consequence of stimulus enhancement, which is equivalent to turning- up the gain of the perceptual template (filter) or equivalently reducing the internal additive (stimulus-independent) noise, then it will be reflected as an improvement primarily at low noise levels. With respect to the model, there will be a reduction in the parameter Aa (proportional change in stimulus-independent internal noise) following learning. Another possibility is that learning results from external noise exclusion, which simply means that the perceptual template becomes more appropriately tuned to include only the signal, thus eliminating the irrelevant noise in the stimulus. In this case, the improvement due to learning will occur primarily at high noise levels. Accordingly, parameter Af (proportional change in the effective external noise perceived by the observer) will become smaller in value following learning. The third possibility for an improvement in performance is a result of a reduction in the internal multiplicative (stimulus-dependent) noise, which will lead to improvement at both low and high noise levels. If so, then the parameter Am (proportional change in stimulus-dependent internal noise) will be reduced following learning. The following is the mathematical description of the model:
where β is a proportional constant, γ is the transducer nonlinearity, Nm and Na are the variance (or spectral density) of the multiplicative (stimulus-dependent) and the additive (stimulus-independent) internal noise, respectively.
Fig. 8.
A schematic figure showing the perceptual template model (PTM), and how practice can lead to an improvement in performance by modifying the various components in the model. The bottom panels illustrate the three scenarios (contrast threshold vs. external noise on log–log axes) in which improvement in performance can occur as a result of training: (left) an improvement only at the low noise levels; (middle) an improvement only at the high noise levels and (right) improvement across all noise levels. Predictions as to how the parameters of the model changes for the three scenarios are given below each of the three panels.
When applying the PTM to analyze our data, the curve-fit to our plots of contrast threshold vs. external noise contrast was in general, very good. Table 1 compares the goodness-of-fit of the curves fitted by LAM and PTM, taking into account the different degrees of freedom in each model.
To summarize the major findings of the PTM analysis (Fig. 9), we found that learning leads to a reduction in both the ratios Aa (internal additive noise: t(df=6) = 3.78, p = 0.009) and Af (external additive noise: t(df=6) = 8.24, p = 0.0002), but not Am (internal multiplicative noise: t(df = 6) = 0.05, p = 0.96). These findings are identical to those of Dosher and Lu (1998, 1999) even though the task was different (they used an orientation discrimination task). According to the model, a reduction in Aa following training is consistent with an improvement in observers’ ability to enhance the stimulus by reducing the additive internal noise. A reduction in Af following training means that observers are more capable of excluding the external noise in the stimulus, by fine-tuning the shape of the perceptual template. Therefore, even with the PTM which is criterion-free, we obtained the same conclusion for our data on learning to identify letters in peripheral vision––that the improvements in learning is primarily attributable to an increased in the observers’ ability to extract and use the relevant information in the stimulus. However, we also found a reduction in Aa following learning, which according to the model, is consistent with an improvement in observers’ ability to enhance the stimulus by reducing the additive internal noise. This seems to contradict the results from the LAM and the double-pass analyses, which suggested no changes in internal noise. As we shall elaborate next, this apparent contradiction is superficial.
Fig. 9.
The three parameters of PTM are plotted as a function of training day: Aa (top), Af (middle) and Am (bottom). Data are shown for each individual observer. Thick curves drawn through the data points represent the values averaged across the seven observers.
4.2. Differences between LAM and PTM
According to LAM, there is no change in the equivalent noise (assumed to be additive), whereas the PTM analysis leads to the conclusion that there is a reduction in the additive internal noise (but not the multiplicative noise). As has been shown elsewhere (Gold, Sekuler, & Bennett, 2004; Tjan et al., 2002), this difference in results is superficial and arises solely because of the relative placement of the various components in the two models ––an argument we shall restate here.
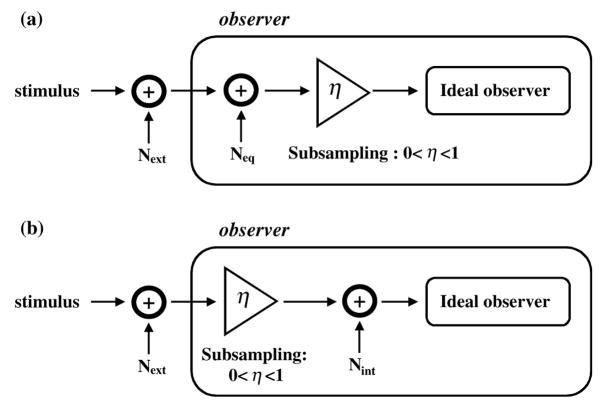
The position of the equivalent noise component (Neq) in the LAM (Fig. 2) and the additive internal noise component (Na) in the PTM (Fig. 8) are not the same in their respective models; therefore, these two components cannot be treated as identical. The traditional formulation of LAM places the internal noise at the stimulus. This is why it is referred to as the “equivalent noise”––a noise if added to the stimulus is equivalent to the noise internal to an observer. In this formulation, sampling efficiency corresponds to the fraction of the net signal-to- noise ratio (SNR) utilized by an otherwise ideal observer to make perceptual decisions, where net SNR equals signal energy (E) divided by the sum of the spectral densities of the external noise (Next) and the equivalent internal noise (Neq). That is, the effective SNR utilized by an observer is equal to sampling efficiency (η) times net SNR, or, effective SNR = η(E/(Next + Neq)). Because the noise and the sampling processes in LAM are linear operators, their relative positions can be swapped relative to each other. Therefore, an equivalent formulation of LAM is that a fraction (equal to the sampling efficiency) of the stimulus SNR is passed on to the observer. The observer’s internal noise, which shall be denoted as Nint to distinguish it from Neq, is then added to the sampled input. Thus, in this formulation, the effective SNR is equal to E/(Next/η + Nint). The difference between these two formulations of LAM is illustrated in Fig. 10a and b. Mathematically, the two formulations are identical up to a change of the variable (Nint = Neq/η), and no empirical test can distinguish between the two. However, since Nint = Neq/η, if sampling efficiency increases but no change is found in equivalent noise according to the first formulation, then the internal noise of the second formulation will show an increase by a ratio precisely equal to the reciprocal of the ratio of change in sampling efficiency. Refer to Fig. 10, the second formulation of LAM (panel b) resembles that of PTM (Fig. 8) in that sampling (template operation) precedes internal additive noise. That is, the reason that PTM shows a decrease in internal additive noise (Na) is because this component corresponds to Nint in the second formulation of LAM, which decreases when sampling efficiency increases if Neq is held constant.
Fig. 10.
The two formulations of the LAM, with different placements of the internal noise relative to the sampling process.
Although there are similarities in conclusions drawn from the analyses presented above, there are also substantial differences between PTM and LAM from a model point of view. PTM differs from LAM (either formulation) because of its non-linear components (nonlinear transducer function and internal multiplicative noise). With these non-linear components, it is not possible to have an equivalent formulation of PTM by moving its additive internal noise component before the template computation to provide a component closely resembling Neq in the first formulation of LAM. Also, PTM models the entire psychometric function and thus its conclusions (reduction in Aa and Af, no change in Am) can be generalized qualitatively and quantitatively to all performance criteria (Tjan et al., 2002; Lu & Dosher, 2004). In contrast, the conclusion based on LAM (increase in sampling efficiency, no change in equivalent noise) is quantitatively true only at the criterion tested. There is a restricted set of conditions that if met, will allow conclusions from LAM to generalize qualitatively to other criterion levels as well. The set of conditions and their derivations are outside the scope of the present paper.
Despite the fundamental differences between LAM and PTM, both models imply that the mechanism underlying perceptual learning of letter identification in peripheral vision is a consequence of the template (or filter) becoming more capable of extracting the crucial information from the stimulus.
Acknowledgments
This study was supported by research grants R01- EY12810 (STLC) and R01-EY01728 (DML) from the National Institutes of Health, and USC Zumberge Fund (BST).
Footnotes
The original “double-pass” method was developed based on a two-alternative forced choice paradigm. To apply the method to our experiment, which consisted of 26 alternatives, we assumed that all 26 letters are equally detectable.
Instead of using the term “sampling efficiency”, Gold et al. (1999) used the term “calculation efficiency” in their paper, which is taken to quantify the degree of optimality in terms of accuracy of the deterministic computation used to reach a perceptual decision. We prefer the less assumption-laden term “sampling efficiency”
References
- Ball KK, Sekuler R. A specific and enduring improvement in visual motion discrimination. Science. 1982;218:697–698. doi: 10.1126/science.7134968. [DOI] [PubMed] [Google Scholar]
- Ball KK, Sekuler R. Direction-specific improvement in motion discrimination. Vision Research. 1987;27:953–965. doi: 10.1016/0042-6989(87)90011-3. [DOI] [PubMed] [Google Scholar]
- Barlow HB. Retinal noise and absolute threshold. Journal of the Optical Society of America. 1956;46:634–639. doi: 10.1364/josa.46.000634. [DOI] [PubMed] [Google Scholar]
- Barlow HB. Increment thresholds at low intensities considered as signal/noise discrimination. Journal of Physiology. 1957;136:469–488. doi: 10.1113/jphysiol.1957.sp005774. [DOI] [PMC free article] [PubMed] [Google Scholar]
- Beard BL, Levi DM, Reich LN. Perceptual learning in parafoveal vision. Vision Research. 1995;35:1679–1690. doi: 10.1016/0042-6989(94)00267-p. [DOI] [PubMed] [Google Scholar]
- Burgess AE, Colborne B. Visual signal detection. IV. Observer inconsistency. Journal of the Optical Society of America A. 1988;5:617–627. doi: 10.1364/josaa.5.000617. [DOI] [PubMed] [Google Scholar]
- Chung STL. Learning to identify unfamiliar letters in central and peripheral vision. Journal of Vision. 2002;2(7):35a. doi: 10.1167/2.7.359. Available from http://journalofvision.org/2/7/35/ [DOI]
- Chung STL, Legge GE, Cheung SH. Letter recognition and reading speed in peripheral vision benefit from perceptual learning. Vision Research. 2004;44:695–709. doi: 10.1016/j.visres.2003.09.028. [DOI] [PMC free article] [PubMed] [Google Scholar]
- Dosher BA, Lu ZL. Perceptual learning reflects external noise filtering and internal noise reduction through channel reweighting. Proceedings of the National Academy of Science USA. 1998;95:13988–13993. doi: 10.1073/pnas.95.23.13988. [DOI] [PMC free article] [PubMed] [Google Scholar]
- Dosher BA, Lu ZL. Mechanisms of perceptual learning. Vision Research. 1999;39:3197–3221. doi: 10.1016/s0042-6989(99)00059-0. [DOI] [PubMed] [Google Scholar]
- Dosher BA, Lu ZL. Perceptual learning in first- and second-order letter identification. Journal of Vision. 2004;4(8):296a. doi: 10.1167/4.8.296. Available from http://journalofvision.org/4/8/296/ [DOI] [PubMed]
- Fahle M, Edelman S. Long-term learning in Vernier acuity: Effects of stimulus orientation, range and of feedback. Vision Research. 1993;33:397–412. doi: 10.1016/0042-6989(93)90094-d. [DOI] [PubMed] [Google Scholar]
- Fahle M, Henke-Fahle S. Interobserver variance in perceptual performance and learning. Investigative Ophthalmology and Visual Science. 1996;37:869–877. [PubMed] [Google Scholar]
- Fine I, Jacobs RA. Comparing perceptual learning tasks: A review. Journal of Vision. 2002;2:190–203. doi: 10.1167/2.2.5. [DOI] [PubMed] [Google Scholar]
- Fiorentini A, Berardi N. Perceptual learning specific for orientation and spatial frequency. Nature. 1980;287:43–44. doi: 10.1038/287043a0. [DOI] [PubMed] [Google Scholar]
- Fiorentini A, Berardi N. Learning in grating waveform discrimination: Specificity for orientation and spatial frequency. Vision Research. 1981;21:1149–1158. doi: 10.1016/0042-6989(81)90017-1. [DOI] [PubMed] [Google Scholar]
- Gold J, Bennett PS, Sekuler AB. Signal but not noise changes with perceptual learning. Nature. 1999;402:176–178. doi: 10.1038/46027. [DOI] [PubMed] [Google Scholar]
- Gold JM, Sekuler AB, Bennett PJ. Characterizing perceptual learning with external noise. Cognitive Science. 2004;28:167–207. [Google Scholar]
- Karni A, Sagi D. Where practice makes perfect in texture discrimination: Evidence for primary visual cortex plasticity. Proceedings of the National Academy of Sciences of the United States of America. 1991;88:4966–4970. doi: 10.1073/pnas.88.11.4966. [DOI] [PMC free article] [PubMed] [Google Scholar]
- Legge GE, Kersten D, Burgess AE. Contrast discrimination in noise. Journal of the Optical Society of America A. 1987;4:391–404. doi: 10.1364/josaa.4.000391. [DOI] [PubMed] [Google Scholar]
- Legge GE, Mansfield JS, Chung STL. Psychophysics of reading. XX. Linking letter recognition to reading speed in central and peripheral vision. Vision Research. 2001;41:725–743. doi: 10.1016/s0042-6989(00)00295-9. [DOI] [PubMed] [Google Scholar]
- Levi DM, Klein SA, Aitsebaomo AP. Vernier acuity, crowding and cortical magnification. Vision Research. 1985;25:963–977. doi: 10.1016/0042-6989(85)90207-x. [DOI] [PubMed] [Google Scholar]
- Li RW, Levi DM, Klein SA. Perceptual learning improves efficiency by re-tuning the decision ‘template’ for position discrimination. Nature Neuroscience. 2004;7:178–183. doi: 10.1038/nn1183. [DOI] [PubMed] [Google Scholar]
- Lu ZL, Dosher BA. Perceptual learning retunes the perceptual template in foveal orientation identification. Journal of Vision. 2004;6:44–56. doi: 10.1167/4.1.5. [DOI] [PubMed] [Google Scholar]
- McKee SP, Westheimer G. Improvement in Vernier acuity with practice. Perception and Psychophysics. 1978;24:258–262. doi: 10.3758/bf03206097. [DOI] [PubMed] [Google Scholar]
- Pelli DG. The quantum efficiency of vision. In: Blakemore C, editor. Visual coding and efficiency. Cambridge: Cambridge University Press; 1990. [Google Scholar]
- Pelli DG, Farell B, Moore DC. The remarkable inefficiency of word recognition. Nature. 2003;423:752–756. doi: 10.1038/nature01516. [DOI] [PubMed] [Google Scholar]
- Poggio T, Fahle M, Edelman S. Fast perceptual learning in visual hyperacuity. Science. 1992;256:1018–1021. doi: 10.1126/science.1589770. [DOI] [PubMed] [Google Scholar]
- Saarinen J, Levi DM. Perceptual learning in Vernier acuity: What is learned? Vision Research. 1995;35:519–527. doi: 10.1016/0042-6989(94)00141-8. [DOI] [PubMed] [Google Scholar]
- Tjan BS, Braje WL, Legge GE, Kersten D. Human efficiency for recognizing 3-D objects in luminance noise. Vision Research. 1995;35:3053–3069. doi: 10.1016/0042-6989(95)00070-g. [DOI] [PubMed] [Google Scholar]
- Tjan BS, Chung STL, Levi DM. Limitation of ideal-observer analysis in understanding perceptual learning. Investigative Ophthalmology and Visual Science. 2002;43 E-Abstract 2916. [Google Scholar]
- Westheimer G. Is peripheral visual acuity susceptible to perceptual learning in the adult? Vision Research. 2001;41:47–52. doi: 10.1016/s0042-6989(00)00245-5. [DOI] [PubMed] [Google Scholar]


