Abstract
Objective
This study presents total body volume (TBV) and regional body volume, and their relationships with widely used body composition indices [BMI, waist circum ference (WC), and percentage body fat (% fat)] in severely obese adults (BMI ≥35 kg/m2).
Research Methods and Procedures
We measured TBV, trunk volume (TV), arm volume (AV), leg volume (LV), and WC and estimated % fat in 32 severely obese persons with BMI 36 to 62 kg/m2 (23 women; age, 19 to 65 years; weight, 91 to 182 kg) and in 58 persons with BMI <35 kg/m2 (28 women; age, 18 to 83 years; weight, 48 to 102 kg) using a newly validated 3-day photonic image scanner (3DPS, Model C9036 - 02, Hamamatsu Co., Japan) and calculated TV/TBV, AV/TBV, and LV/TBV.
Results
Men had significantly larger TBV and higher TV/TBV and AV/TBV, but significantly lower LV/TBV than women, independently of BMI. TV/TBV increased while AV/TBV and LV/TBV decreased with increasing BMI, WC, and % fat, and the rate of increase in TV/TBV per % fat was significantly greater in severely obese individuals than in individuals with BMI <35 kg/m2. The relationships for TBV with % fat were much lower than with BMI or WC.
Conclusion
Body volume gains were mainly in the trunk region in adults, irrespective of sex or BMI. For a given BMI, WC, or % fat, men had a significantly larger TV than women. The implication is that men could have higher health risks due to having higher trunk body weight as a proportion of total body weight compared with severely obese or less severely obese women.
Keywords: body composition, body image, body fat distribution
Introduction
Numerous studies have documented that an increase in central adiposity as indicated by an enlarged waist circumference (WC)1 is associated with the presence of hypertension, coronary heart disease, type 2 diabetes, and increased mortality risk (1-4). Other studies have reported that greater lower body obesity as indicated by increased thigh circumference is negatively associated with insulin and glucose levels, and the accumulation of fat in the legs may be protective against abnormal glucose metabolism, especially in women (5-7), because the adipocytes in the leg region are less sensitive than the adipocytes in the trunk region to lipolytic stimuli (8,9). Because of the lack of reliable methodology for measuring body size or volumes in severely obese individuals, information on total or regional body size or body volume in severely obese individuals is unavailable. Body circumferences have been used as indices of fat distribution at different body regions across various levels of BMI (kg/m2). Seidell et al. (5) reported that persons with a small WC and large hip circumference have a lower risk of cardiovascular disease. However, it is difficult to obtain reliable values for body circumferences using traditional tape measures in severely obese individuals (10).
We recently validated a 3-day photonic scanner (3DPS, Model C9036 - 02; Hamamatsu Co., Japan) for measuring total and regional body volumes and dimensions in humans (11). The 3DPS can accommodate the maximum adult body size and is, therefore, without body size constraints.
The main objective of this study was to investigate the efficacy of this newly developed 3DPS technique in the assessment of body composition, body volumes, and dimensions, and secondly to investigate the relationships between regional body volumes as proportions of total body volume and their associations with BMI, WC, and percentage body fat (% fat) in severely obese individuals (BMI ≥35 kg/m2) and to compare the results to persons with BMI <35 kg/m2. The cut-off point at 35 kg/m2 was selected for two reasons: 1) the standard classification for severe obesity is BMI ≥35 kg/m2 (12), and 2) persons with BMI ≥35 kg/m2 are likely to weigh >250 lbs and are usually excluded from measurements using scanning techniques that could generate total or regional body volumes, such as magnetic resonance imaging (MRI) or computed tomography (CT); therefore, body volume data are unavailable in severely obese individuals.
Research Methods and Procedures
Subjects
Thirty-two severely obese adults with BMI 36 to 63 kg/m2 were recruited for the study (23 women; age, 19 to 65 years; weight, 91 to 182 kg). Fifty-eight adults with BMI >18 to 34 kg/m2 were included in the study as controls (28 women; age, 18 to 83 years). The study was approved by the St. Luke’s-Roosevelt Hospital Institutional Review Board. A written consent form was obtained from each participant.
Measurements
Body weight was measured to the nearest 0.1 kg (Ohaus Champ General Purpose Bench Scale; Ohaus Corp., Pine Brook, NJ) and height to the nearest 1 mm using a stadiometer (Holtain, Ltd., Crymych, U.K.) while the subjects wore minimal underwear and no shoes.
The 3DPS used in this study is a non-invasive optical method (Model # C9036 - 02; Hamamatsu Photonics K.K., Japan). The scan system has 4 photonic image production units mounted on four poles in the scanner. Each unit has an eye-safe Class 1 laser-light source (664 nm) and a digital camera (charge-coupled device camera), which uses high-speed digital sensors. The scan field is 200 cm high × 100 cm wide × 60 cm deep. The software uses triangulation mathematics to detect the actual position of the light point that projected onto the surface of an object and reflected to the cameras. During the scanning process, the 4 scanning units move vertically and simultaneously, producing a maximum of 2560 data points at each of the 800 cross sections over the 2-m vertical scan field in 10 seconds with a 2.5-mm pitch interval to generate a total 2,048,000 data points. The software connects the points to generate a 3-day body image and calculates values for total and regional body volumes and dimensions such as body circumferences, lengths, widths, and thicknesses. The size of a cross section on the scanned surface is calculated from all detected data points at the cross section, and the distance between any 2 body surface points is determined by all data points on the line between the 2 points. The software can also calculate volume for any selected region of the body. Using traditional underwater weighing and tape measure results as the criterion methods, we have documented that this newly developed 3DPS has a high accuracy and reproducibility for the measurement of total and regional body volumes and dimensions in children and adults with a wide range of age, weight, and body fatness, and in a commercially available mannequin. The above information was described in detail in a previous report (11).
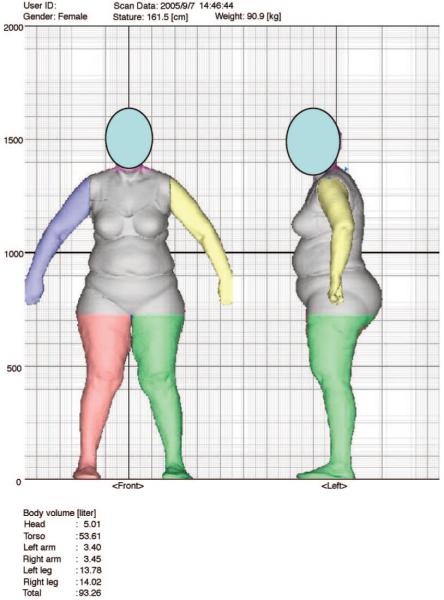
Figure 1 defines the total body volume (TBV) and regional body volumes measured by the 3DPS. Arm volume (AV) was the sum of left and right arms, and leg volume (LV) was the sum of left and right legs. Each subject wore a tight-fitting cap to minimize air-spaces between the hair and skull and well-fitting underwear that clung to the skin surface. The arms and legs were positioned using the standard 3DPS landmarks, and the subject was instructed to remain motionless during the scan. Subjects were scanned 3 times during normal breathing and 3 times at the end of a maximal expiration; % fat was estimated using the TBV measure at the end of maximal expiration as described previously. The reported total and regional body volume values and WC were measured at normal breathing. The measurement reproducibility by the 3DPS for circumferences range from 99.2% for chest to 99.6% for thigh, and for body volumes range from 99.4% for total body to 95.7% for leg (11).
Figure 1.
The image of a total body scan and the definition of regional body volumes of a participant measured by the 3DPS scanner. AV is the sum of left arm and right arm volumes, and LV is the sum of left leg and right leg volumes.
Data Analysis
Descriptive statistics, mean, standard deviation, minimum value, and maximum value were calculated for each variable. Linear regression analysis was used to model the associations of TBV and each regional body volume as a proportion of TBV with BMI, WC, and % fat for each sex within each group. All statistical analyses were calculated using SAS version 9.1 (SAS Institute, Inc., Cary, NC) and STATA version 9.2 (StataCorp LP., College Station, TX) statistical software packages for personal computers. The level of significance was set at 0.05 for all statistical tests.
Results
Table 1 shows the physical characteristics of both study groups. Within the severely obese group, men were significantly heavier and taller and had higher BMI and larger WC than women, but there were no differences in age and % fat compared with women. Within the BMI <35 kg/m2 group, men were significantly heavier and taller and had larger WC and lower % fat, but there were no differences in age and BMI compared with women.
Table 1.
Physical characteristics of severely obese participants (BMI ≥ 35 kg/m2) and participants with BMI <35 kg/m2
| Females (n = 23) |
Males (n = 9) |
||||||
|---|---|---|---|---|---|---|---|
| Mean | SD | Range | Mean | SD | Range | p | |
| BMI ≥35 kg/m2 | |||||||
| Age (yrs) | 41 | 13 | 24 to 65 | 40 | 13 | 19 to 55 | 0.7114 |
| Weight (kg) | 111 | 15 | 91 to 143 | 140 | 30 | 98 to 182 | 0.0007* |
| Height (cm) | 166 | 7 | 150 to 181 | 176 | 9 | 162 to 186 | 0.0016* |
| BMI (kg/m2) | 40 | 5 | 36 to 51 | 45 | 9 | 35 to 62 | 0.0431* |
| WC (mm) | 1142 | 128 | 960 to 1372 | 1326 | 157 | 1146 to 1564 | 0.0018* |
| % fat | 47 | 7 | 28 to 59 | 44 | 8 | 30 to 57 | 0.2200 |
| Females (n = 28) |
Males (n = 30) |
||||||
|---|---|---|---|---|---|---|---|
| Mean | SD | Range | Mean | SD | Range | p | |
| BMI <35 kg/m2 | |||||||
| Age (yrs) | 39 | 17 | 18 to 83 | 44 | 14 | 18 to 74 | 0.1917 |
| Weight (kg) | 72 | 16 | 48 to 102 | 79 | 11 | 51 to 100 | 0.0447* |
| Height (cm) | 165 | 8 | 147 to 195 | 174 | 6 | 160 to 192 | 0.0001* |
| BMI (kg/m2) | 26 | 5 | 18 to 34 | 26 | 4 | 18 to 34 | 0.8884 |
| WC (mm) | 853 | 115 | 650 to 1060 | 928 | 101 | 741 to 1125 | 0.0129* |
| % fat | 36 | 7 | 24 to 47 | 25 | 9 | 11 to 47 | 0.0002* |
SD, standard deviation; WC, waist circumference.
Significant.
Table 2 shows the TBV, regional volumes, and regional volumes as proportions of TBV in both groups. In the severely obese group, men had significantly higher TBV, TV, and AV than women (p = 0.0055 to 0.0003), but there was no significant difference in LV between men and women (p = 0.97). When the regional volumes were expressed as proportions of the TBV in the severely obese group, men had higher TV/TBV (0.68 vs. 0.62, p = 0.0014), but lower LV/TBV (0.21 vs. 0.26, p = 0.0009), than women, and there was no significant difference in AV/TBV between sexes (p = 0.53). However, the latter may, in part, be due to the smaller sample size in men. In the BMI <35 kg/m2 group, men had significantly higher TV (p = 0.0125) and AV (p = 0.0001) than women. Men had higher TV/TBV and AV/TBV, but lower LV/TBV (0.0001), than women.
Table 2.
Total and regional body volumes (L), and regional body volumes as proportions of total body volume measured by 3DPS in severely obese participants (BMI ≥ 35 kg/m2) and in participants with BMI <35 kg/m2
| Females (n = 23) |
Males (n = 9) |
||||||
|---|---|---|---|---|---|---|---|
| Mean | SD | Range | Mean | SD | Range | p | |
| BMI ≥35 kg/m2 | |||||||
| TBV (L) | 113 | 16 | 93 to 146 | 143 | 31 | 98 to 184 | 0.0013* |
| TV (L) | 70 | 13 | 50 to 94 | 97 | 24 | 66 to 129 | 0.0003* |
| AV (L) | 8 | 1 | 6 to 12 | 10 | 2 | 7 to 13 | 0.0055* |
| LV (L) | 29 | 5 | 20 to 37 | 29 | 7 | 19 to 43 | 0.9997 |
| TV/TBV | 0.62 | 0.05 | 0.54 to 0.73 | 0.68 | 0.03 | 0.64 to 0.73 | 0.0014* |
| AV/TBV | 0.07 | 0.01 | 0.06 to 0.09 | 0.07 | 0.01 | 0.06 to 0.09 | 0.5342 |
| LV/TBV | 0.26 | 0.04 | 0.17 to 0.34 | 0.21 | 0.02 | 0.17 to 0.24 | 0.0009* |
| Females (n = 28) |
Males (n = 30) |
||||||
|---|---|---|---|---|---|---|---|
| Mean | SD | Range | Mean | SD | Range | p | |
| BMI <35 kg/m2 | |||||||
| TBV (L) | 73 | 16 | 50 to 104 | 79 | 11 | 57 to 100 | 0.0928 |
| TV (L) | 41 | 10 | 26 to 59 | 47 | 8 | 32 to 64 | 0.0103* |
| AV (L) | 6 | 1 | 4 to 8 | 8 | 1 | 6 to 12 | 0.0009* |
| LV (L) | 21 | 6 | 13 to 35 | 29 | 5 | 20 to 37 | 0.1950 |
| TV/TBV | 0.57 | 0.04 | 0.50 to 0.65 | 0.60 | 0.03 | 0.54 to 0.66 | 0.0009* |
| AV/TBV | 0.08 | 0.01 | 0.06 to 0.10 | 0.07 | 0.01 | 0.06 to 0.09 | 0.0001* |
| LV/TBV | 0.28 | 0.03 | 0.22 to 0.35 | 0.26 | 0.04 | 0.17 to 0.34 | 0.0001* |
3DPS, 3-day photonic scanner; SD, standard deviation; TBV, total body volume; TV, trunk volume; AV, arm volume; LV, leg volume.
Significant.
Table 3 presents the linear regression equations for the relationships of TBV and each regional volume as proportion of TBV with BMI, WC, and % fat in the severely obese women and men. In women, all of the relationships were significant (except AV/TBV vs. BMI): TBV and TV/TBV increased with increasing BMI, WC, and % fat, while AV/TBV and LV/TBV decreased with increasing BMI, WC, and % fat. In men, TBV also increased with increasing BMI, WC, and % fat, while for regional volumes, only TV/TBV increased with increasing WC. The r2 values for TBV with BMI and WC were higher than those with % fat in both sexes.
Table 3.
Linear relationships of TBV and regional body volumes as proportions of TBV with BMI, WC, and % fat in severely obese participants (BMI ≥ 35 kg/m2)
| Sex | Dependent variable | Independent variable | Linear equation | r2 | SEE | P |
|---|---|---|---|---|---|---|
| Females | TBV | BMI | TBV = 2.63BMI +7.42 | 0.60 | 10.0 | 0.001* |
| WC | TBV = 0.10WC - 0.96 | 0.72 | 8.3 | 0.001* | ||
| % fat | TBV = 0.98% fat +67.97 | 0.19 | 14.0 | 0.043* | ||
| TV/TBV | BMI | TV/TBV = 0.0068BMI +0.3434 | 0.47 | 0.0340 | 0.001* | |
| WC | TV/TBV = 0.0003WC +0.3322 | 0.54 | 0.0302 | 0.001* | ||
| % fat | TV/TBV = 0.0041% fat +0.4277 | 0.39 | 0.0348 | 0.002* | ||
| AV/TBV | BMI | AV/TBV = -0.00060BMI +0.0980 | 0.13 | 0.0075 | 0.097 | |
| WC | AV/TBV = -0.00003WC +0.1078 | 0.24 | 0.0068 | 0.020* | ||
| % fat | AV/TBV = -0.00055% fat +0.1000 | 0.23 | 0.0068 | 0.023* | ||
| LV/TBV | BMI | LV/TBV = -0.0056BMI +0.4845 | 0.37 | 0.0342 | 0.002* | |
| WC | LV/TBV = -0.00020WC +0.4864 | 0.42 | 0.0309 | 0.001* | ||
| % fat | LV/TBV = -0.0033% fat +0.4147 | 0.32 | 0.0334 | 0.006* | ||
| Males | TBV | BMI | TBV = 3.04BMI +5.04 | 0.71 | 18.0 | 0.004* |
| WC | TBV = 0.18WC - 90.30 | 0.77 | 16.2 | 0.002* | ||
| % fat | TBV = 3.03% fat +13.63 | 0.54 | 23.6 | 0.038* | ||
| TV/TBV | BMI | TV/TBV = 0.0020BMI +0.5834 | 0.33 | 0.0270 | 0.106 | |
| WC | TV/TBV = 0.00016WC +0.4692 | 0.62 | 0.0203 | 0.012* | ||
| % fat | TV/TBV = 0.0026% fat +0.5658 | 0.46 | 0.0241 | 0.066 | ||
| AV/TBV | BMI | AV/TBV = -0.00048BMI +0.0935 | 0.28 | 0.0073 | 0.147 | |
| WC | AV/TBV = -0.00003WC +0.1127 | 0.37 | 0.0068 | 0.085 | ||
| % fat | AV/TBV = -0.00055% fat +0.0964 | 0.27 | 0.0077 | 0.188 | ||
| LV/TBV | BMI | LV/TBV = -0.00045BMI +0.2262 | 0.03 | 0.0259 | 0.681 | |
| WC | LV/TBV = -0.000072WC +0.3015 | 0.21 | 0.0233 | 0.214 | ||
| % fat | LV/TBV = -0.00092% fat +0.2414 | 0.11 | 0.0224 | 0.428 |
TBV, total body volume; WC, waist circumference; SEE, standard error of the estimate; TV, trunk volume; AV, arm volume; LV, leg volume.
Significant.
Between-sex differences were found for TV/TBV vs. % fat (p = 0.001), LV/TBV vs. % fat (p = 0.001), AV/TBV vs. WC, AV/TBV vs. BMI (p = 0.009), and LV/TBV (p = 0.010) vs. BMI (p = 0.019).
Table 4 presents similar equations in the BMI <35 kg/m2 group. In women, TBV increased with increasing BMI, WC, and % fat, but there were no other significant relationships. In men, TBV increased with increasing BMI and WC, but not with increasing % fat, while for regional volumes, TV/TBV and LV/TBV, but not AV/TBV, increased with increasing BMI and WC. Similar to the results in the severely obese group, the r2 values for TBV with BMI and WC were higher than those with % fat in both sexes.
Table 4.
Linear relationships of TBV, and regional body volumes as proportions of TBV with BMI, WC, and % fat in participants with BMI <35 kg/m2
| Sex | Dependent variable | Independent variable | Linear equation | r2 | SEE | p |
|---|---|---|---|---|---|---|
| Females | TBV | BMI | TBV = 2.77BMI +0.07 | 0.79 | 7.6 | 0.001* |
| WC | TBV = 0.12WC - 26.53 | 0.70 | 9.0 | 0.001* | ||
| % fat | TBV = 1.23% fat +31.90 | 0.31 | 13.5 | 0.013* | ||
| TV/TBV | BMI | TV/TBV = 0.00146BMI +0.5279 | 0.04 | 0.0391 | 0.324 | |
| WC | TV/TBV = 0.00011WC +0.4782 | 0.10 | 0.0377 | 0.114 | ||
| % fat | TV/TBV = 0.0011% fat +0.5378 | 0.04 | 0.0390 | 0.414 | ||
| AV/TBV | BMI | AV/TBV = 0.00011BMI +0.0767 | 0.00 | 0.0080 | 0.726 | |
| WC | AV/TBV = -0.00000WC +0.0811 | 0.00 | 0.0082 | 0.896 | ||
| % fat | AV/TBV = -0.00029% fat +0.0886 | 0.08 | 0.0075 | 0.253 | ||
| LV/TBV | BMI | LV/TBV = 0.00008BMI +0.2826 | 0.00 | 0.0340 | 0.948 | |
| WC | LV/TBV = -0.00003WC +0.3088 | 0.01 | 0.0342 | 0.623 | ||
| % fat | LV/TBV = -0.0003% fat +0.2893 | 0.00 | 0.0358 | 0.805 | ||
| Males | TBV | BMI | TBV = 2.18BMI +21.45 | 0.75 | 5.5 | 0.001* |
| WC | TBV = 0.08WC +4.12 | 0.69 | 5.6 | 0.001* | ||
| % fat | TBV = 0.41% fat +69.90 | 0.11 | 10.2 | 0.107 | ||
| TV/TBV | BMI | TV/TBV = 0.00285BMI +0.5227 | 0.16 | 0.0277 | 0.027* | |
| WC | TV/TBV = 0.00020WC +0.4104 | 0.49 | 0.0213 | 0.001* | ||
| % fat | TV/TBV = 0.0016% fat +0.5606 | 0.22 | 0.0275 | 0.024* | ||
| AV/TBV | BMI | AV/TBV = -0.0002BMI +0.0941 | 0.01 | 0.0080 | 0.553 | |
| WC | AV/TBV = -0.00003WC +0.1127 | 0.11 | 0.0074 | 0.073 | ||
| % fat | AV/TBV = -0.00015% fat +0.0932 | 0.03 | 0.0085 | 0.470 | ||
| LV/TBV | BMI | LV/TBV = -0.0013BMI +0.2790 | 0.05 | 0.0246 | 0.255 | |
| WC | LV/TBV = -0.00013WC +0.3628 | 0.27 | 0.0214 | 0.004* | ||
| % fat | LV/TBV = -0.0012% fat +0.2753 | 0.19 | 0.0237 | 0.036* |
TBV, total body volume; WC, waist circumference; SEE, standard error of the estimate; TV, trunk volume; AV, arm volume; LV, leg volume.
Significant.
Between-sex differences were found for all dependent variables (TV/TBV, AV/TBV, and LV/TBV) vs. % fat, WC, and BMI (p = 0.046 - p = 0.001). Across both groups, there were no significant differences between the slopes for men and women; i.e., there were no significant interactions between sex and % fat, WC, and BMI. However, the intercepts for men were different than for women. That is, for a given BMI, WC, or % fat, men had higher TV/TBV and AV/TBV but lower LV/TBV than women.
Figures 2, 3, and 4 are scatter plots of the relationships between TBV and BMI, WC, and % fat in the severely obese women and men. Figures 5, 6, and 7 are similar plots for each regional volume as a proportion of TBV vs. BMI, WC, and % fat in the severely obese women and men.
Figure 2.
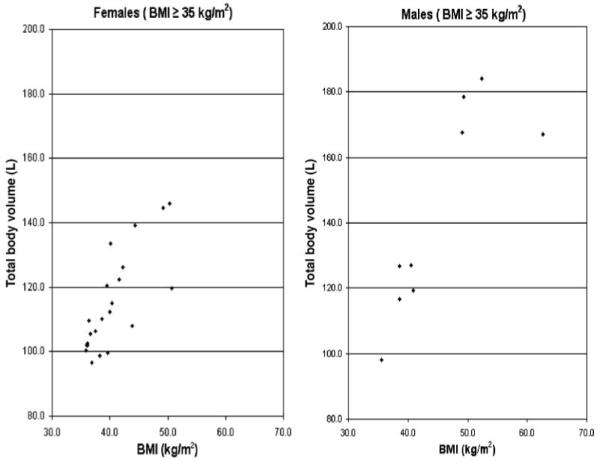
The scatter plot of TBV measured by 3DPS vs. BMI for severely obese women and men (BMI ≥35 kg/m2).
Figure 3.
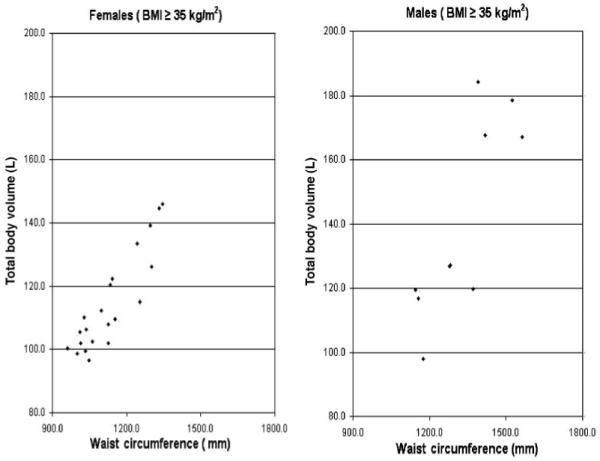
The scatter plot of TBV measured by 3DPS vs. WC for severely obese women and men (BMI ≥35 kg/m2).
Figure 4.
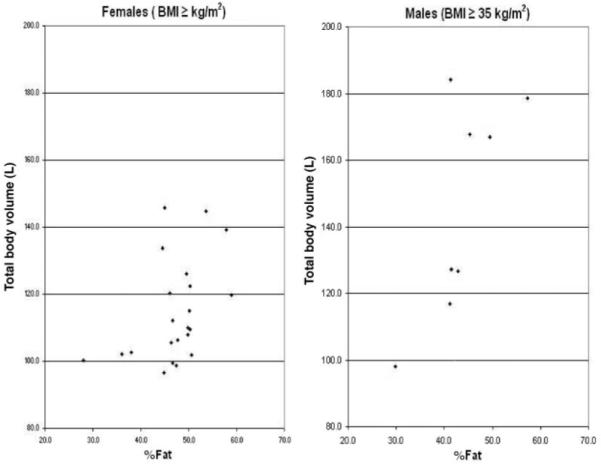
The scatter plot of TBV measured by 3DPS vs. % fat for severely obese women and men (BMI ≥35 kg/m2).
Figure 5.
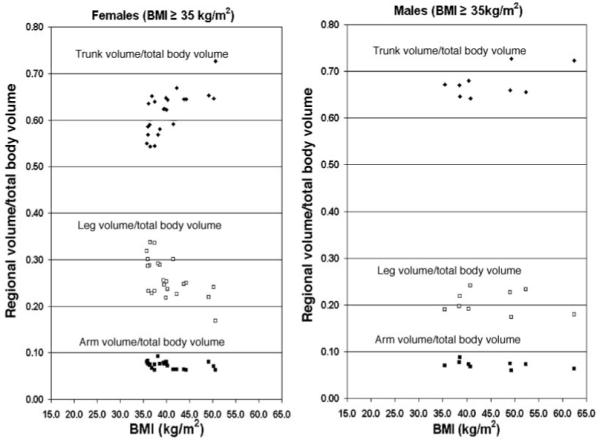
The scatter plot of TV, AV, and LV as proportion of TBV measured by 3DPS vs. BMI for severely obese women and men (BMI ≥35 kg/m2).
Figure 6.
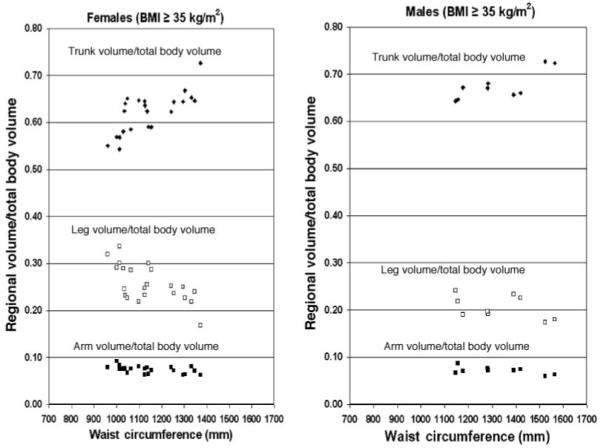
The scatter plot of TV, AV, and LV as proportion of TBV measured by 3DPS vs. WC for severely obese women and men (BMI ≥35 kg/m2).
Figure 7.
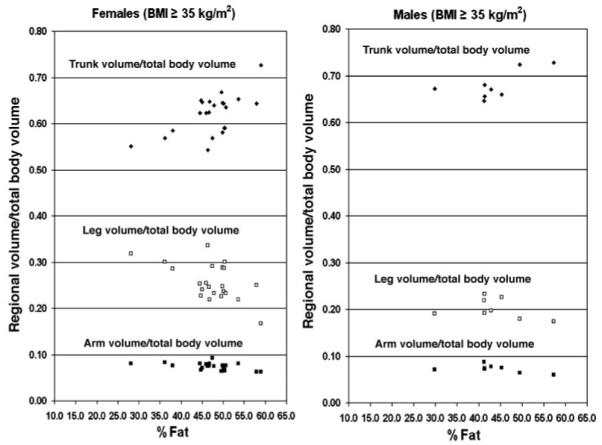
The scatter plot of TV, AV, and LV as proportion of TBV measured by 3DPS vs. % fat for severely obese women and men (BMI ≥35 kg/m2).
Discussion
In this study, we found that men had a greater body weight and TBV compared with women. TBV was highly and positively associated with BMI and WC (Figures 2 and 3) for both women and men in both BMI cohorts, with r2 values ranging from 0.60 to 0.77 in the study group with BMI ≥35 kg/m2 (Table 3) and r2 values ranging from 0.69 to 0.79 in subjects with BMI < 35 kg/m2 (Table 4). TBV was also positively associated with % fat in women (Figure 4) for both BMI cohorts, but the r2 values were much lower than the r2 values with BMI or WC. No significant relationship was found between TBV and % fat in men with BMI <35 kg/m2. Since TBV is determined by body weight, and body weight alone is not a reliable predictor for % fat, we were not surprised by the low correlations between TBV and % fat. In this study, we found that r2 was >0.998 for the relationships between TBV and body weight in the combined study cohorts.
However, it is important to point out that the relatively low association between TBV and % fat does not imply that measurement of TBV by this technique is less useful in this population. Indeed, TBV can be used to estimate % fat (13). In this study, all of the severely obese subjects were able to perform the 10-second scan measurements. Also, there were no body size constraints imposed by the 3DPS, unlike other currently available techniques such as CT, MRI, or DXA (14-16), which is the major advantage of this technique for studying body composition in severe obesity.
To our knowledge, this is the first study to indicate that men, irrespective of BMI, have a greater trunk volume as a proportion of total body volume compared with women, while women have a greater leg volume (Table 2), and TV/TBV is positively associated with BMI, WC, and % fat, while LV/TBV is negatively associated with BMI, WC, and % fat in severely obese men and women (Figures 5 to 7). These results suggest that, in both sexes, with increasing weight gain, more weight is gained in the trunk region, independently of BMI, but men have more trunk weight than women for a given BMI. Since abdominal obesity is associated with health risks while greater leg fat appears to be protective against unfavorable glucose metabolism (5-7), the implication from these findings is that the health risks due to unfavorable regional body mass distribution could be greater in men than in women. These findings apply in conditions of normal-weight, overweight, and severely overweight.
CT and MRI could be used to measure total or regional body volumes. CT has been used to measure adipose tissue volume (14). MRI has been used to measure volume of the breast during the menstrual cycle (15), skeletal muscle and adipose tissue (17-19), and select organs (20). However, no attempt has been made to use these techniques to measure whole-body volumes, even though such information is important for various health-related reasons.
We also failed to find any previous studies presenting such results in individuals with BMI <35 kg/m2. Therefore, no published reference data are available for us to make any comparisons of the results obtained in this study. Our previous results obtained in studies of mannequins documented the accuracy of the 3DPS in measuring total and regional body volumes and dimensions compared with underwater weighing and tape measure techniques (11) and are supportive of the reliability of the results presented in this report.
Various body circumferences have been used to estimate body fat content. WC measurement using the simple and inexpensive tape measure technique has been considered a reliable anthropometric measurement for identifying obesity, establishing risks for obesity, and monitoring the effects of treating obesity (21). However, anthropometric results using the traditional tape measure technique may vary by the instrument used, protocol definitions, and observer’s measurement skill. Also, the measurement reliability is low for studies in obese subjects (10). Our previous studies in children and adults, as well as in a mannequin, have documented that the newly developed 3-day photonic scanner measures body circumferences at chest, waist, hip, and midthigh accurately (11). In this study, we found that the association of % fat with WC (r = 0.62 for women, and r = 0.81 for men) was higher than with BMI (r = 0.57 for women, and r = 0.62) in individuals with BMI ≥35 kg/m2. These results further confirm that, in severely obese individuals, WC is also a better predictor than BMI for % fat.
This study used the 3DPS technique, which is easy, fast, and accurate, to determine total and regional body volumes and dimensions and to estimate volume or mass distribution in a population that has historically been neglected due to the lack of reliable measurement techniques. All subjects were able to perform the measurements, and there were no body size constraints imposed by the 3DPS in the current study population where the maximum body weight and BMI were 182 kg and 63 kg/m2, respectively.
Measurements of changes in total and regional body volume and in body dimensions reflect changes in total and regional body fat and lean tissue storage. The outcomes from this study indicate that the 3DPS could be used to determine changes in total and regional body volumes and dimensions during obesity treatments and/or interventions in severely obese individuals and to investigate whether regional body volumes as proportions of total body volume have any influence on lipid metabolism.
Acknowledgments
The authors thank all of the participants in the study, as well as Hideo Hiruma of the Mamamatsu Photonics K.K. of Japan, and his colleagues for their technical and instrumentation supports to make the study possible. This study was supported by DK26687-05 and DIDDK-42618.
Footnotes
- WC
- waist circumference
- 3DPS
- 3-day photonic scanner
- MRI
- magnetic resonance imaging
- CT
- computed tomography
- TBV
- total body volume
- AV
- arm volume
- LV
- leg volume.
References
- 1.Bigaard J, Frederiksen K, Tjonneland A, et al. Waist circumference and body composition in relation to all-cause mortality in middle-aged men and women. Int J Obes. 2005;29:778–84. doi: 10.1038/sj.ijo.0802976. [DOI] [PubMed] [Google Scholar]
- 2.Bigaard J, Frederiksen K, Tjonneland A, et al. Body fat and fat-free mass and all-cause mortality. Obes Res. 2004;12:1042–9. doi: 10.1038/oby.2004.131. [DOI] [PubMed] [Google Scholar]
- 3.Hoefle G, Saely CH, Aczel S, et al. Impact of total and central obesity on vascular mortality in patients undergoing coronary angiography. Int J Obes. 2005;29:785–91. doi: 10.1038/sj.ijo.0802985. [DOI] [PubMed] [Google Scholar]
- 4.Poirier P, Giles TD, Bray GA, et al. Obesity and cardiovascular disease: pathophysiology, evaluation, and effect of weight loss: an update of the 1997 American Heart Association Scientific Statement on Obesity and Heart Disease from the Obesity Committee of the Council of Nutrition, Physical Activity, and Metabolism. Circulation. 2006;113:898–918. doi: 10.1161/CIRCULATIONAHA.106.171016. [DOI] [PubMed] [Google Scholar]
- 5.Seidell JC, Perusse L, Despress JP, Bouchard C. Waist and hip circumferences have independent and opposite effects on cardiovascular disease risk factors: the Quebec Family Study. Am J Clin Nutr. 2001;74:315–21. doi: 10.1093/ajcn/74.3.315. [DOI] [PubMed] [Google Scholar]
- 6.Snijder MB, Visser M, Dekker JM, et al. Low subcutaneous thigh fat is a risk factor for unfavourable glucose and lipid levels, independently of high abdominal fat: the Health ABC Study. Diabetologia. 2005;48:301–8. doi: 10.1007/s00125-004-1637-7. [DOI] [PubMed] [Google Scholar]
- 7.Snijder MB, Dekker JM, Visser M, et al. Trunk fat and leg fat have independent and opposite associations with fasting and postload glucose levels. Diabetes Care. 2004;27:372–7. doi: 10.2337/diacare.27.2.372. [DOI] [PubMed] [Google Scholar]
- 8.Arner P. Differences in lipolysis between human subcutaneous and omental adipose tissues. Ann Med. 1995;27:435–8. doi: 10.3109/07853899709002451. [DOI] [PubMed] [Google Scholar]
- 9.Bos G, Snijder MB, Nijpels G, et al. Opposite contributions of trunk and leg fat mass with plasma lipase activities: the Hoorn study. Obes Res. 2005;13:1817–23. doi: 10.1038/oby.2005.221. [DOI] [PubMed] [Google Scholar]
- 10.Wang J, Bartsch G, Rahgavan SS, et al. Reliability of body circumference and skinfold measurements by observers trained in groups. Int J Body Comp Res. 2004;2:31–6. [Google Scholar]
- 11.Wang J, Gallagher D, Thorton JC, Yu W, Horlick M, Pi-Sunyer FX. Validation of a 3-dimensional photonic scanner for the measurement of body volumes, dimensions, and percentage body fat. Am J Clin Nutr. 2006;83:809–16. doi: 10.1093/ajcn/83.4.809. [DOI] [PMC free article] [PubMed] [Google Scholar]
- 12.World Health Organization . Report of a World Health Organization Consultation on Obesity. Geneva, Switzerland: Jun 3-5, 1998. Obesity: preventing and managing the global epidemic. 1997. [PubMed] [Google Scholar]
- 13.Siri WE. The gross body composition of the body [Report 3349] University of California Radiation Laboratory; Berkeley, CA: 1956. [Google Scholar]
- 14.Kvist H, Chowdhury B, Sjöström L, Tylen U, Cederblad A. Adipose tissue volume determination in males by computed tomography and 40K. Int J Obes. 1988;12:249–66. [PubMed] [Google Scholar]
- 15.Fowler PA, Casey CE, Cameron GG, Foster MA, Knight CH. Cyclic changes in composition and volume of the breast during the menstrual cycle, measured by magnetic resonance imaging. Br J Obstet Gynaecol. 1990;97:595–602. doi: 10.1111/j.1471-0528.1990.tb02546.x. [DOI] [PubMed] [Google Scholar]
- 16.Soriano JM, Ioannidou E, Wang J, et al. Pencil-beam vs. fan-beam dual-energy x-ray absorptiometry comparisons across four systems: body composition and bone mineral. J Clin Densitom. 2004;7:281–9. doi: 10.1385/jcd:7:3:281. [DOI] [PubMed] [Google Scholar]
- 17.Ross R, Kimberley DS, Martel Y, Guise JD, Avruch L. Adipose tissue distribution measured by magnetic resonance imaging of obese women. Am J Clin Nutr. 1993;57:470–5. doi: 10.1093/ajcn/57.4.470. [DOI] [PubMed] [Google Scholar]
- 18.Sobol W, Rossner S, Hinson B, et al. Evaluation of a new magnetic resonance imaging method for quantitating adipose tissue areas. Int J Obes. 1991;15:589–99. [PubMed] [Google Scholar]
- 19.Gallagher D, Belmonte D, Deurenberg P, et al. Organ-tissue mass measurement allows modeling of REE and metabolically active tissue mass. Am J Physiol. 1998;275:E249–58. doi: 10.1152/ajpendo.1998.275.2.E249. [DOI] [PubMed] [Google Scholar]
- 20.Gallagher D, Kuznia P, Heshka S, et al. Adipose tissue in muscle: a novel depot similar in size to visceral adipose tissue. Am J Clin Nutr. 2005;81:903–10. doi: 10.1093/ajcn/81.4.903. [DOI] [PMC free article] [PubMed] [Google Scholar]
- 21.National Institutes of Health . Practical Guide Identification, Evaluation, and Treatment of Overweight and Obesity in Adults. National Institutes of Health; Bethesda, MD: 2000. NIH Publication Number 00 - 4084. [Google Scholar]


