Abstract
Objective:
The misuse and abuse of alcohol among college students remain persistent problems. Using a systems approach to understand the dynamics of student drinking behavior and thus forecasting the impact of campus policy to address the problem represents a novel approach. Toward this end, the successful development of a predictive mathematical model of college drinking would represent a significant advance for prevention efforts.
Method:
A deterministic, compartmental model of college drinking was developed, incorporating three processes: (1) individual factors, (2) social interactions, and (3) social norms. The model quantifies these processes in terms of the movement of students between drinking compartments characterized by five styles of college drinking: abstainers, light drinkers, moderate drinkers, problem drinkers, and heavy episodic drinkers. Predictions from the model were first compared with actual campus-level data and then used to predict the effects of several simulated interventions to address heavy episodic drinking.
Results:
First, the model provides a reasonable fit of actual drinking styles of students attending Social Norms Marketing Research Project campuses varying by “wetness” and by drinking styles of matriculating students. Second, the model predicts that a combination of simulated interventions targeting heavy episodic drinkers at a moderately “dry” campus would extinguish heavy episodic drinkers, replacing them with light and moderate drinkers. Instituting the same combination of simulated interventions at a moderately “wet” campus would result in only a moderate reduction in heavy episodic drinkers (i.e., 50% to 35%).
Conclusions:
A simple, five-state compartmental model adequately predicted the actual drinking patterns of students from a variety of campuses surveyed in the Social Norms Marketing Research Project study. The model predicted the impact on drinking patterns of several simulated interventions to address heavy episodic drinking on various types of campuses.
College drinking is recognized as a major problem at institutions of higher learning across the United States (Task Force of the National Advisory Council on Alcohol Abuse and Alcoholism, 2002). Alcohol is a factor in 40% of academic problems as well as 28% of dropouts, and an estimated 1,825 student deaths per year are related to alcohol (Hingson et al., 2005; Hingson et al., 2009). The relationship between students and alcohol is a complex, dynamic one. Attempts to understand and characterize the college community and its dynamics offer the potential to aid in policy decisions and reduce the problems that arise from alcohol use. In this article, we introduce a mathematical model that treats the college community as a system where levels of drinking vary over time not only as a result of student characteristics (Weitzman et al., 2003b), social interactions (Harford et al., 2002; Reifman et al., 2006), and social norms (Borsari and Carey, 2001; Perkins et al., 1999) but also because of external factors related to the “wetness” of a particular campus (Harford et al., 2002; Scribner et al., 2008; Wechsler and Nelson, 2008; Weitzman et al., 2003a). System models have been developed for analyzing drug use in other areas, including tobacco (Levy et al., 2001, 2002; Tengs et al., 2004), alcohol (Gorman et al., 2006), cocaine (Caulkins et al., 2004; Everingham and Rydell, 1994; Homer, 1993; Rydell et al., 1996), and heroin (Caulkins et al., 2007).
The rationale underlying our effort to mathematically model college drinking as a system is two pronged. First, college drinking represents an important public health problem that has not been amenable to preventive interventions targeting individuals (Dowdall and Wechsler, 2002; Hingson et al., 2005; Wechsler et al., 2000a). However, there is evidence that comprehensive community interventions, specifically those that target the campus alcohol environment, may be more successful in addressing the problem of college drinking (Clapp and Shillington, 2001; DeJong and Langford, 2002; Dowdall and Wechsler, 2002; Hingson and Howland, 2002; Knight et al., 2003; Toomey et al., 2007; Wechsler et al., 2000a).
Second, the campus environment represents a relatively simple system to model compared with other population systems, such as cities, major metropolitan areas, or larger scale communities. This observation stems from the fact that the individual-in-population hierarchy tends to be more homogeneous in the college population than in other populations such as cities (Schulenberg and Maggs, 2002). In addition, the scale of the hierarchy is fixed, with students nested within campus. For all these reasons, a systems approach to college drinking represents a promising direction in alcohol policy research for projecting future trends and as a quantitative tool in policy analysis.
The importance of a systems approach has long been recognized in the social sciences (Ackoff, 1956) and more recently in alcohol prevention research (Holder, 1993). However, recent criticism of multilevel, observational research attempting to demonstrate a causal role for community-level constructs (Messer, 2007; Oakes, 2004), which are directly comparable to campus community environmental constructs (Scribner et al., 2008), has resulted in new appreciation for systems approaches (Auchincloss and Diez Roux, 2008; Diez Roux, 2007). In the case of college drinking, observational research on the effects of campus-level constructs like campus wetness may be structurally confounded because of the nonequivalence of students across college campus environments. Consequently, such potential for confounding ultimately affects the confidence of policymakers interested in implementing politically sensitive policies on their particular campus, because a policy shown to be effective at other institutions does not mean that it will work on their campus. Although there are a number of systems modeling approaches that can be used to address the limitations of observational research, we have chosen a dynamic equation modeling approach, which models the student population in terms of the drinking styles of various subpopulations (i.e., compartments). We chose this approach because of its relative ease of communicating the most relevant predicted results of campus-level policy changes to decision makers as opposed to an agent-based model, which would have been more useful if our goal was understanding the individual or spatial dynamics of student drinking behavior (Auchincloss and Diez Roux, 2008).
In the area of substance abuse, a systems approach has been used to project demand and analyze policy for a variety of substances of abuse. For example, Everingham and colleagues developed a two-state Markovian model of the demand for cocaine that has been used to evaluate the efficacy of various policy approaches to controlling cocaine use (Everingham and Rydell, 1994; Rydell et al., 1996). In the area of alcohol use, Gorman and colleagues (2006) recently developed an agent-based simulation model to study the development and maintenance of drinking behavior in the general population. The model we introduce is a compartmental model, which is most similar to Caulkins and colleagues' model of drug use in Australia (Caulkins et al., 2007). Both models are deterministic and both have five compartments—a fairly large number—to improve the differentiation between styles of substance use. However, there are differences.
First, Caulkins and colleagues (2007) model time discretely, whereas in our model time is treated continuously, with discrete inputs to reflect annual matriculation and dropout rates at each campus. Second, their model has one parameter determining rates of flows between compartments, whereas our model has three rate parameters that reflect the various processes believed to be involved in college drinking: student characteristics, social norms, and social interactions. These three parameters provide a convenient mechanism for modeling alternative policy interventions.
Method
Model development
The modeling process can be thought of as a loose hierarchy in which each step informs the next (Ackoff, 1956; Jacquez, 1996). The first step in modeling college drinking involves characterizing the processes that can be used to effectively address the problem. The second step involves quantifying these processes into mathematical relationships that describe the dynamics. The third step is to compare the predictions of the model with actual college drinking data. Should the model need refinement, the next step is to reconsider assumptions and examine results to enhance the model. Finally, a model that performs favorably with existing data can be used to predict population behavior under differing conditions. In the present work, we compared our predictions of levels of student drinking in our model with actual data from a limited number of college campuses. We then conducted simulated interventions to demonstrate predictive capabilities for future policy studies.
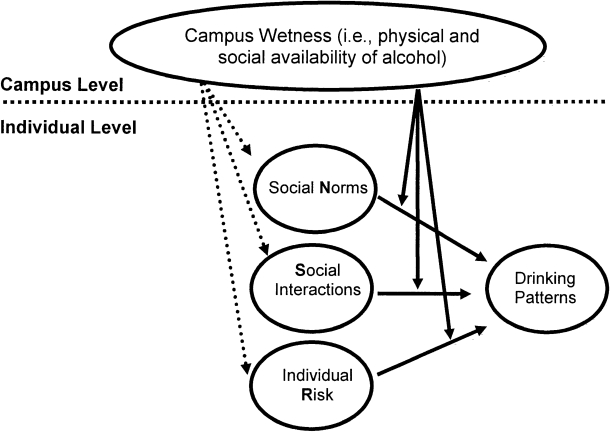
In defining the processes involved, we began with a conceptual model that represents underlying processes believed to be responsible for life-course changes involved in phenomena of college drinking. These processes defined our rate parameters and included the following: (1) individual characteristics associated with changes in drinking behavior (Baer et al., 1995; Reis and Riley, 2000; Wechsler et al., 1995), (2) social interactions that result in changes in drinking behavior (McCabe et al., 2005; Thombs et al., 1997), and (3) social norms that affect drinking behavior (Perkins et al., 1999, 2005). Our model also included campus wetness as a moderator of these processes (Scribner et al., 2008; Wechsler and Nelson, 2008M; Wechsler et al., 2000b; Weitzman et al., 2003b). The wetness parameter permitted the modeling of community-level interventions targeting the physical and social availability of alcohol. A graphic model of these processes is provided in our conceptual model (Figure 1). Basically, the effect of social norms, social interactions, and individual risk on drinking patterns is moderated by campus wetness.
Figure 1.
Conceptual model of college drinking describing the various rate parameters included in the resulting model
To capture the essential features related to patterns of college drinking, we structured the model to include five drinking compartments: (1) abstainers, (2) light drinkers, (3) moderate drinkers, (4) problem drinkers, and (5) heavy episodic drinkers. The compartments were chosen to distinguish among various styles of college drinking. The first compartment distinguishes nondrinkers from drinkers as defined by the abstainer compartment. The next compartment distinguishes the physically or psychologically dependent users who are unlikely to be influenced by social processes. This compartment is defined as problem drinkers. The third compartment identifies heavy episodic drinkers as a unique style of drinking compared with light or moderate social drinking. The final compartments distinguish between levels of social drinking defined by the light and moderate drinking compartments in the absence of heavy episodic drinking.
At this point, it should be noted that, although we discuss individuals and individual behaviors in our model design and construction, the model does not maintain detailed information on each individual in the population. Each compartment is assumed to contain similar individuals in terms of their drinking behaviors. Individuals may change behaviors many times and in many ways. The compartmental modeling approach was chosen because it represents one of the simplest methods of encapsulating mean behaviors associated with college drinking styles while capturing the overall dynamic at the systems level. Consequently, the model captures mean changes in student population dynamics at a time when they are integrating into college life while providing the flexibility to study population-level policy interventions (Caulkins et al., 2007).
Model definition
This discussion leads us to the specific definition of the model compartments and the rates at which they change. The compartments and rates of change come together in a system of equations that comprise the mathematical model. We let Nj(t) (with j = 1, 2, 3, 4, or 5) be the number of students in compartment j at time t, where Compartment 1 represents the abstainers; 2, light drinkers; 3, moderate drinkers; 4, problem drinkers; and 5, the heavy episodic drinkers. In our model, there are three possible rate parameters that transition students from one compartment to another, corresponding to the process in the conceptual model: (1) individual risk, (2) social interaction, and (3) social norms.
To model an “individual risk” type of transition from compartment i to j, we assumed that the rate of movement between the compartments was proportional to the number of individuals in the “donor” compartment i. That is, the rate at which i decreases as a result of an i-to-j individual risk is rijNi, where the rij parameter governs the rate at which individuals Ni in a compartment will transition because of their individual characteristics (e.g., increasing age, joining a fraternity). In the dynamic equations (detailed below), rijNi will appear as a negative in the rate equation for compartment i and a positive for the rate equation of compartment j.
The subscripting convention for the remaining rate parameters, discussed below, will be consistent with the individual-risk parameterization of the previous paragraph. The first subscript denotes the donor compartment, and the second subscript denotes the receiver compartment.
To model a “social interaction” transition from compartment i to compartment j, we used a rate model, similar to epidemiologic rate models using compartments of susceptible, infectious, and recovered (SIR), in which movement from the susceptible to the infectious compartments, for example, depends on the contact rate (Anderson and May, 1979). That is, the rate of transition from compartment i to compartment j attributable to social interaction is proportional to the total number of possible interactions among individuals in the two compartments. The product NiNj represents the total number of interactions of individuals from compartment i with individuals from compartment j, and the sij parameter represents the rate at which those interactions will result in an individual in compartment i adopting the behavior of an individual in compartment j. Thus, the rate at which compartment i loses individuals and compartment j gains individuals attributable to this transition is SijNjNj. Again, this term will appear as a negative term, or a loss, in compartment i's rate equation and as a positive term in compartment j's rate equation.
As for social norms, we assumed that only three compartments are affected by this type of transition: abstainers becoming light drinkers, light drinkers becoming heavy episodic drinkers, and moderate drinkers becoming heavy episodic drinkers. The social-norms parameter was intended to model the rate at which individuals change compartments as a result of the perception that a certain level of drinking behavior is typical (the norm) of fellow students. The first of these terms models that fraction of abstainers (i = 1) who become light drinkers (j = 2) as a result of the overall level of drinking on a particular campus (which is the sum of the numbers in Compartments 2, 3, 4, and 5). This rate takes the form:
 |
The ratio gives the fraction of drinkers in the population. The n12 parameter, therefore, governs the rate at which abstainers N1 will become drinkers given the proportion of all students on campus who drink. Similarly, the transition to heavy episodic drinking is based on the fraction of heavy episodic drinkers in the drinking population, leading to transitions from Compartment 2 to Compartment 5 and from Compartment 3 to Compartment 5, respectively, as:
 |
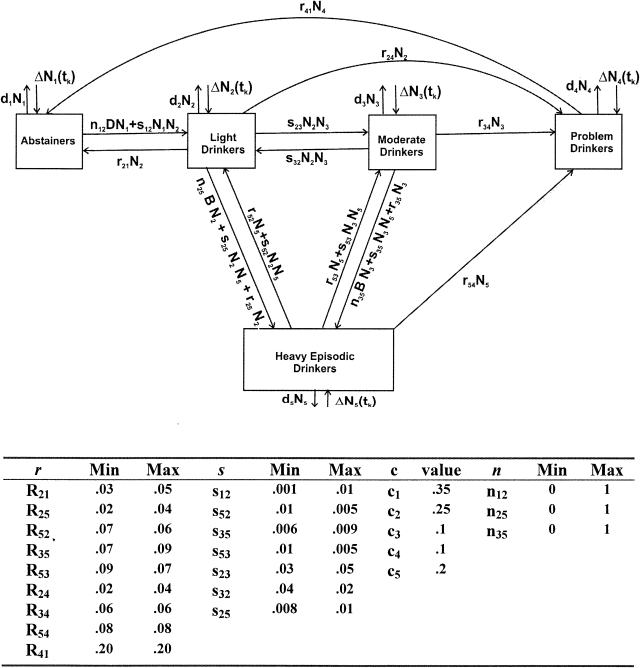
Again, the n 25 and n 35 parameters govern the rate at which light and moderate drinkers will become heavy episodic drinkers given the proportion of heavy episodic drinking among all drinkers on a particular campus. Figure 2 graphically summarizes the individual-risk, social-interaction, and social-norms parameters governing transitions through the drinking compartments.
Figure 2.
Five-compartment model of college drinking. All transfers are shown. Here N
1, N
2, N
3, N
4, and N
5 and are the numbers of abstainers, light drinkers, moderate drinkers, problem drinkers, and heavy episodic drinkers, respectively, at time t. For convenience, we let 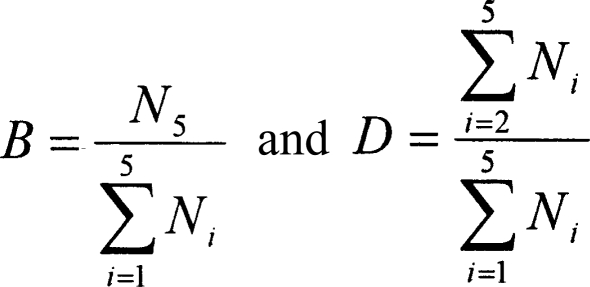 Actual values for each parameter defining the transfer are also shown, including the range when the “wetness” parameter equals 0 (i.e., minimum [min]) and 1 (i.e., maximum [max]).
We used linear terms to model the loss in each compartment attributable to dropout and/or graduation. Finally, at the beginning of each year we matriculated students as incoming freshman equal to the number of all students who either dropped out or graduated in the previous year. Therefore, the number of students at the beginning of each year was the same. However, the distribution of the matriculating students across compartments can be varied, and, indeed, we varied it in our simulations depending on the type of campus we were modeling. As we discuss below, these rate parameters can be extracted from survey data. To be specific, we modeled the rate of dropouts and graduations from compartment j as djNj, assuming that the rate of loss was proportional to the number in the compartment. Matriculation was modeled as a jump in the number of students in each of the compartments at the beginning of the year. We denoted by tk the time at which the school year began, and we looked at the times “right before” and “right after” school started, denoted by tk− and tk+ The incoming class has proportions ci in compartment i. If the campus maintains a constant total enrollment over time, then the total new membership to compartment i must be equal to the size of the incoming class multiplied by the proportion of the incoming class having compartment i's drinking behavior:
 |
With all of these features defined, we combined them to create our model.
The Compartmental Model
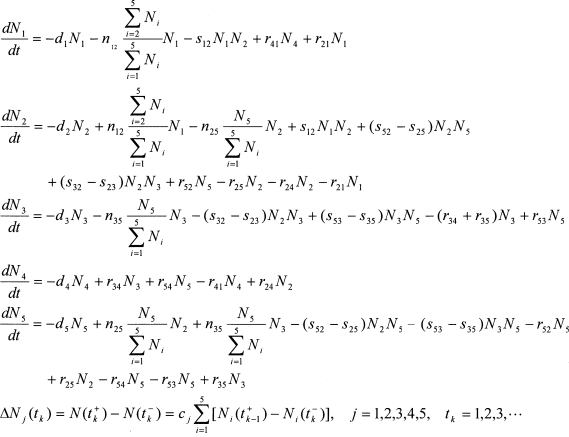 |
The first five equations in the above model represent the rate of change of the number of students in each compartment attributable to all three of our processes that move students between compartments (social norms, social interactions, individual risk) plus infusion of new students to replace dropouts and graduations. Each term in the first five equations should be clear from the previous discussion. For the reader's convenience, we ordered the processes that lead to changes in compartments in the above model as follows: dropouts/graduation (dj), social norms (nij), social interaction (sij), and individual risk (rij). The last equation in the model represents the impulsive change in each compartment at the beginning of every year (tk) as a result of newly matriculated students. In summary, this is a continuous-time, deterministic model with impulsive input (i.e., student matriculation) taking place once every year.
To better understand and appreciate this system of equations, we will examine the first equation in detail. The left side of the equation, dN 1/dt, denotes the rate of change of the number of abstainers in the population. This rate of change is the sum of several terms. First, there is a loss as a result of dropout and graduation. The fact that this term is a loss is emphasized by the negative sign (with the rate d 1 assumed to be positive, of course). The second term, also a loss, is the social-norms transition, the rate at which abstainers become light drinkers as a result of the social normative process of perceiving the proportion of drinkers on the campus and aligning personal behavior accordingly. Third is another loss, the rate at which all social interactions with drinkers result in abstainers initiating drinking behavior. Fourth is a positive rate, denoting the rate at which problem drinkers (Compartment 4) become abstainers (perhaps as a result of treatment or some other external influence). Finally, we have a positive rate modeling light drinkers deciding to give up drinking. The remaining four compartments each have a rate equation that is interpreted in a similar manner.
It is important to emphasize that each of the individual-risk terms, the social-interaction terms, and the social-norms terms appears in exactly two rate equations. That is, except for the dropout/graduation rates, each negative rate of change out of a compartment becomes a positive rate of change into a different compartment. For example, there is a −s 12 N 1 N 2 term (negative) in the N 1 rate equation and an identical s 12 N 1 N 2 term but of the opposite, positive, sign in the N 2 rate equation. Again, note that these aggregated rates of change model the average behavior of the population.
We should also point out that we have proposed a small set of transitions compared with all the possible transitions. In the spirit of our discussion concerning empirical and mechanistic models, we note that we could construct a model with a “complete” set of individual-risk and social-interaction terms. This model is given by the form:
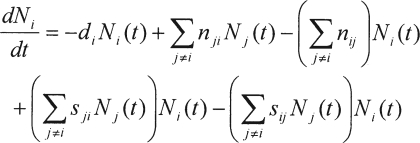 |
so that the dynamics of each and every compartment contain all possible types of individual-risk gains, individual-risk losses, and gains and losses as a result of social interactions. As posed, this model does not yet contain social-norms terms, and yet each compartment has 10 distinct rates in and out of the compartment. For such a model, we must specify five dropout rates, five incoming-class fractions, 20 individual-risk rate parameters, and 20 social-interaction rate parameters. Additionally, one could consider a large variety of social-norms dynamic terms, whose specific structures could be quite complex. The corresponding full model would be extraordinarily complex, contain so many parameters that parameter estimation and hence model fitting would be impossible, and not in fact correspond to any current body of theory of college drinking, because alternative styles of college drinking are recognized as having different mechanistic bases (e.g., the causes thought to underlie heavy episodic drinking differ from those of abstaining). To develop a useful, understandable model that is consistent with the present body of theory regarding the styles and causes of campus drinking, we have taken the route of selecting, a priori, the interactions we believe are the most important to the overall population dynamics.
It is important to note that, even with a reduced set of possible interactions, we have a very large number of parameters: five dropout rates (d), five incoming-class proportions (c), three social norms (n), seven social interactions (s), and nine individual risks (r), for a total of 29 parameters. Ten of these, the dropout rates and the incoming-class proportions, can be determined (or estimated) from survey data, leaving 19 parameters. Moreover, some of the social-interaction terms appear in terms of nets (e.g., s 25–s 52). Thus, if we consider these net rates as one combined parameter, we have 16 total parameters that must be inferred from data.
Model evaluation
To compare predictions from the model with actual survey data from multiple campuses, we accessed the survey database from the Social Norms Marketing Research Project (SNMRP). A detailed description of the study design and survey methods is available in the literature (DeJong et al., 2006). The SNMRP database contains data from 32 campuses over 4 years, permitting the determination of the number of students in each compartment at one fixed time point per year for each of the 4 years. Each compartment is defined from the survey data as follows: Students who report themselves to be abstainers are classified as abstainers, those who report drinking at least five drinks (for men) or four drinks (for women) in one sitting during the past 2 weeks are classified as heavy episodic drinkers, and those who indicate having at least two problem-drinking criteria based on the CAGE questionnaire (Mayfield et al., 1974) are classified as problem drinkers. Self-reported light drinkers comprise the light compartment and self-reported moderate or heavy drinkers who do not meet problem-drinker criteria comprise the moderate compartment.
With 20 data points (five compartment levels, four observation times) and 16 free parameters, direct estimation from these data is likely to involve significant levels of uncertainty. Toward that end, with additional rationale related to policy studies, we have defined all of the rate parameters in terms of a single hyperparameter that we call wetness. All of our model parameters are also assumed to be a function of the campus wetness, w. Specifically, we assume that each of the 16 parameters lies in an interval with known minimum and maximum values. Choosing the wetness index w (a number between 0 and 1) fixes each parameter at a particular value in this interval. For example, we treat s 12 as S12min + (S12max − S12min)w, so that when w = 0, s12 = S12min; when w = 1, s12 = S12max; and when w is between 0 and 1, s12 is between S12min and S12max. This simplifying assumption has two important consequences: One parameter can be estimated from the data with a greater degree of confidence, and studying potential policy impacts in terms of changing a single parameter, the wetness level, is a much more straightforward undertaking. The wetness level used for each campus to evaluate the model in predicting the number of students in each compartment is a standardized measure of wetness derived from a separate study that determined wetness as the number of bars within 3 miles of the campus per 1,000 students enrolled (Scribner et al., 2008).
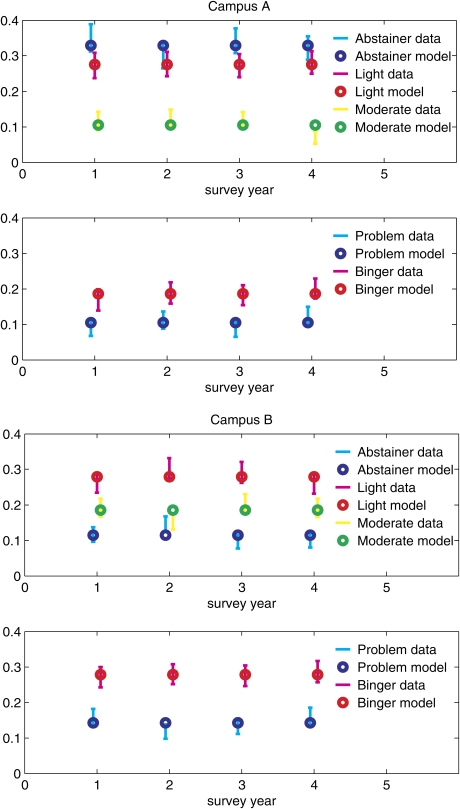
We have developed a numerical code in MATLAB Version 7.6 (The MathWorks, Inc., Natick, MA) to simulate the above model. In addition, a graphical user interface was developed to facilitate changing the model parameters and presenting them graphically (see Figure 3). For consistency, each campus is considered to have 1,000 students whose distribution across drinking compartments is initially set to match the distribution in the actual survey data for that campus.
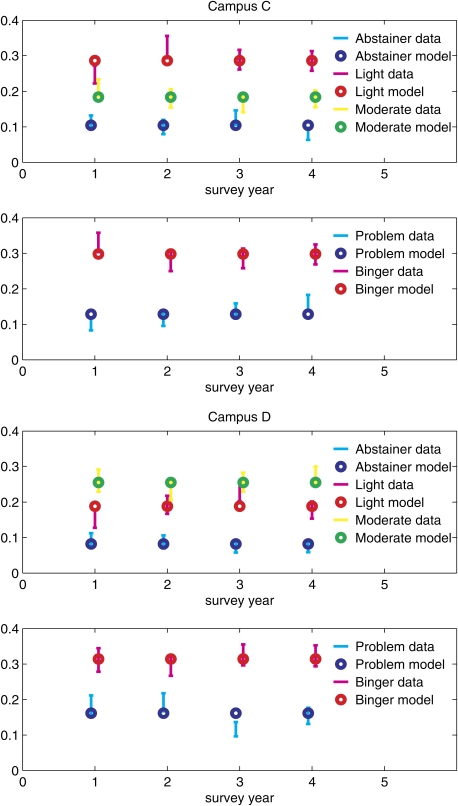
Figure 3.
Proportion of individuals in each compartment for four campuses varying by levels of “wetness”: Campus A, wetness = .01; Campus B, wetness = .23; Campus C, wetness = .24; Campus D, wetness = .77.
In summary, we conducted a least squares analysis using actual data from four campuses that vary with regard to level of wetness to validate the predictions of the model. Data from each specific campus with regard to the proportion of students in each compartment as well as rates of matriculation by compartment and overall dropout rates were used to initially populate the compartments and specify the impulsive inputs.
Model prediction
To further explore our model, we conducted two numerical experiments by altering several parameters that mimic simplistic interventions and observing the resulting effects on the dynamics of the system (i.e., changing compartment composition). We tried two types of intervention. First, we decreased the wetness parameter along the range from .75, a moderately wet campus, to .25, a moderately dry campus. This might mimic an intervention whereby the physical availability of alcohol surrounding the campus was reduced (e.g., reduction in bar density). Second, we changed the dropout and incoming-class composition by first doubling the proportion of heavy episodic drinkers dropping out each year and then preventing heavy episodic drinkers from matriculating. This might mimic a policy intervention whereby a campus expelled heavy episodic drinkers and precluded heavy episodic drinkers from matriculating. Although of unrealistic severity, it provides a simple test of the model. Again, we modeled a campus with a constant number of students (i.e., 1,000), although the initial composition of each compartment reflected the mean proportion of students in each compartment for the overall SNMRP sample rather than the sample for one particular campus.
Results
Model evaluation
To demonstrate that the model compares well with data on college drinking from a variety of campuses, we provide some comparisons with the SNMRP data. In Table 1, the results of the least squares analysis in terms of the estimated wetness index are presented for 4 of the 32 SNMRP campuses. The four campuses presented represent a range from a relatively low-wetness or dry campus, Campus A, to a relatively wet campus, Campus D. The results demonstrate that the model did a reasonable job in predicting the measured wetness obtained by determining the number of bars per undergraduate students enrolled within 3 miles of the campus in a separate study (Scribner et al., 2008).
Table 1.
Estimated “wetness” from the model and actual wetness (i.e., alcohol outlet density) for four Social Norms Marketing Research Project schools.
| Variable | Campus A | Campus B | Campus C | Campus D |
| Wetness index | .010 | .230 | .240 | .770 |
| Outlet density | 5.250 | 10.750 | 16.230 | 32.810 |
In the analyses that follow, predictions of the proportion of individuals within each compartment estimated by the model are compared with the actual proportion of students in each compartment derived from the SNMRP data for each of the four campuses. In Figure 3, the model predictions are presented as standard proportion estimator error bars, whereas the actual data are presented as a point estimate. The model was simulated forward in time for 5 years to attain a steady state.
For Campus A, with relatively low wetness, the abstainers constituted the largest compartment, with more than 300 students each year. The model adequately predicted these numbers as well as all the other compartments. For Campus D, the wettest campus, the heavy episodic drinker compartment was the largest, with more than 300 students each year. Again, the model adequately predicted these numbers. However, there were isolated instances where fit to the actual data was relatively poor (e.g., problem drinkers on Campus D in Year 3).
Model prediction
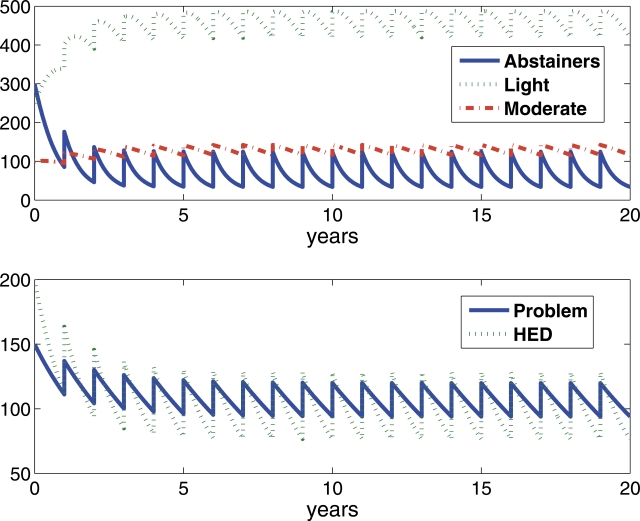
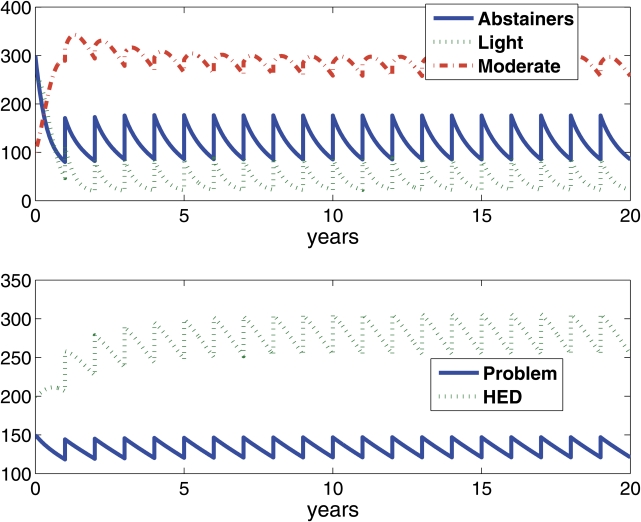
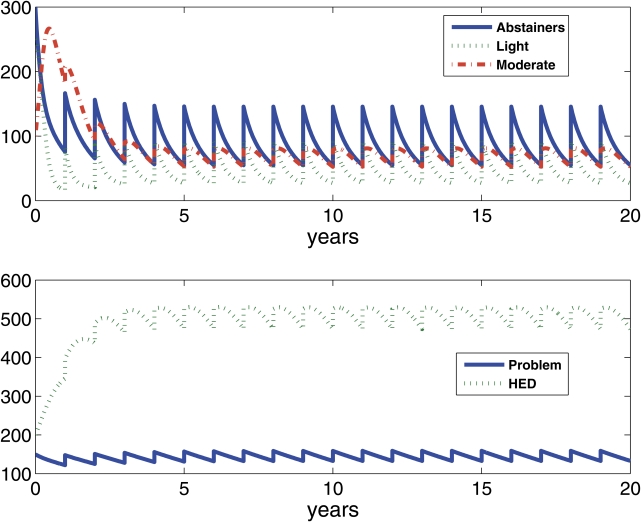
In our first experiment, campus wetness was varied from .25 to .75. Figure 4 represents the evolving student population in each drinking compartment of a typical campus with 1,000 students over a 10-year period at the varying campus wetness conditions. Two parallel graphs, one showing Compartments 1 to 3, the other showing Compartments 4 to 5, are presented for each condition to allow easier visualization of changes within each compartment. It should be noted that in these models the initial student population reaches equilibrium in approximately 3–4 years in nearly all cases. For purposes of this article, we define equilibrium as a system state such that the numbers of students in each of the different compartments (e.g., abstainers, heavy episodic drinkers) attain a fixed annual pattern year after year.
Figure 4a.
Wetness parameter = .25. Populations of a five-compartment model of a college drinking model over a 10-year period for a hypothetical campus with 1,000 students, with varying campus “wetness” from .25 (i.e., a moderately dry campus) to .75 (i.e., a moderately wet campus). HED = heavy episodic drinker.
Figure 4a demonstrates the evolution of drinking patterns of a typical SNMRP campus if the wetness is decreased to a moderately dry campus environment (i.e., wetness parameter = .25). At this hypothetical campus, light drinkers dominate the student population (i.e., they comprise approximately 40% of students at equilibrium) as abstainers tend to experiment with light drinking. It should be noted that, although abstainers tend to experiment with light drinking, few light drinkers move on to moderate drinking or heavy episodic drinking in this model.
Again, the sawtooth pattern reflects the implusive component in the model corresponding to the matriculation of new students every year (i.e., fall semester). For this reason, the model does not attain full equilibrium but demonstrates a stable periodic (oscillatory) solution.
In Figure 4b, the wetness parameter has been increased to .5 to represent an “average” campus with regard to our wetness index. In this hypothetical campus, moderate drinkers tend to dominate, increasing from 15% of the student population at the moderately dry campus to 30% of the student population at this campus with average wetness. The proportion of heavy episodic drinkers also increases from roughly 12% on the dry campus to 28% on the average-wetness campus.
Figure 4b.
Wetness parameter = .5.
In Figure 4c, the graphs detail the change in drinking patterns from a typical campus to a moderately wet campus (i.e., wetness parameter = .75). On this campus, heavy episodic drinkers come to dominate, increasing from the 28% level seen for an average campus to 50% of the student population. The proportion of abstainers is actually increased over that for the moderately dry campus, however, suggesting that the student population is becoming polarized between the abstainers and heavy episodic drinkers as the light and moderate drinkers move into either the abstainer or heavy episodic drinker compartments. It is also interesting to note that the heavy episodic drinking rate in this moderately wet campus reflects the average proportion of heavy episodic drinkers across U. S. campuses (45%), suggesting we have scaled our wetness parameter too low, such that a typical campus is moderately wet according to our model's wetness scale.
Figure 4c.
Wetness parameter = .75.
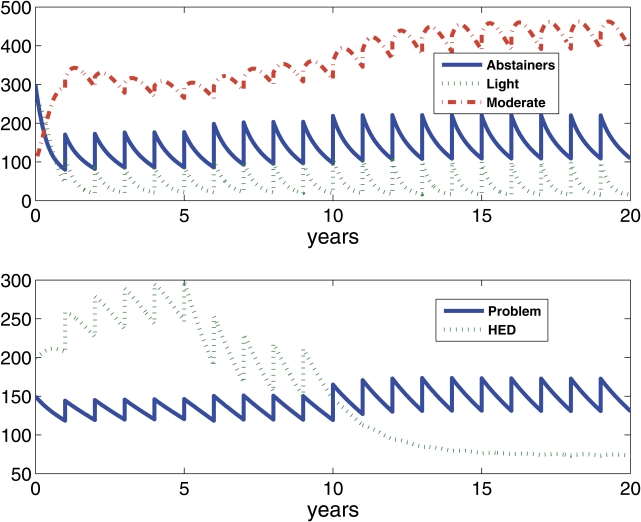
Next, we report the results of the simulated interventions targeting the proportion of heavy episodic drinkers on a campus. They simulate the effect of a hypothetical administration policy to first remove and then prevent the matriculation of students who participate in heavy episodic drinking. Although these interventions are unrealistic because of their severity, they do represent interventions whose results are easy to understand and interpret in terms of initial tests of the model.
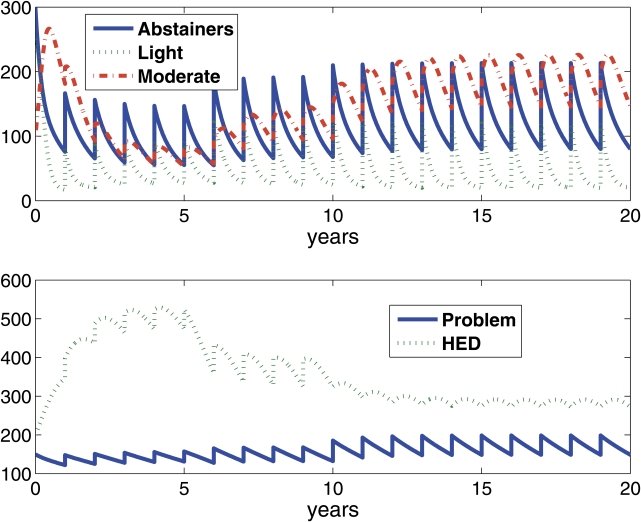
We repeated the series of interventions at our average-wetness campus (i.e., wetness parameter = .5) and a moderately wet campus (i.e., wetness parameter = .75) (Figure 5). For the average-wetness campus, the intervention increasing the proportion of heavy episodic drinkers leaving the campus every year was instituted at 5 years into the run. This intervention resulted in a dramatic drop in proportion of heavy episodic drinkers on campus, basically cutting their numbers in half (Figure 5a). The additional intervention of not allowing heavy episodic drinkers to matriculate was instituted in the same model at 10 years into the run. The cumulative effect of these two interventions essentially ended heavy episodic drinking at the average-wetness campus as well as a dry campus (not shown) (Figure 5b).
Figure 5a.
Wetness parameter = .50. Populations of a five-compartment model of college drinking model over a 20-year period for a hypothetical campus with 1,000 students with a moderate wetness (i.e., wetness parameter = .75) and an average wetness (i.e., wetness parameter = .50). At 5 years, the dropout rate for heavy episodic drinkers is doubled from .3 to .6, and at 10 years the matriculation rate for heavy episodic drinkers goes from .2 to zero. HED = heavy episodic drinker.
Figure 5b.
Wetness parameter = .75.
The same series of interventions were repeated at the moderately wet campus. The effect of doubling the proportion of heavy episodic drinkers leaving the campus had a more muted effect on the wetter campus. Finally, adding the nonmatriculation of heavy episodic drinkers on the wet campus had a small effect, but the heavy episodic drinkers who remained still constituted the dominant drinking group on campus at 30% of the student population. The implications for a hypothetical administrator are clear: Despite the severity of the intervention (e.g., widespread expulsion of heavy episodic drinkers), the proportion of heavy episodic drinkers would be relatively unaffected on a moderately wet campus.
Discussion
Our results demonstrate that a deterministic, compartmental model of college drinking did an adequate job of reproducing the patterns of college drinking on a variety of campuses varying by their wetness. The results also suggest that policy insights can be gained using the model (e.g., relatively severe interventions targeting heavy episodic drinkers may be relatively ineffective in a campus alcohol environment that is relatively wet).
Given that a deterministic, compartmental model can be considered fairly simplistic, it should be noted that our model with five compartments and 29 parameters governing the transitions among them is of sufficient complexity to predict the effects of a variety of system changes (e.g., alcohol control policies) on drinking patterns at the population level in a variety of campus settings. The conditions at different campuses can be simulated (e.g., wet vs dry, commuter vs noncommuter, “party” vs “nonparty”) by adjusting the initial conditions, the matriculation/dropout parameters, and the wetness parameter.
Once a campus type is characterized, simulated interventions can be conducted. Here are some examples of possible “interventions.” The risk parameters governing the flow of students into and out of the abstainer and problem drinking compartments could be manipulated (e.g., delayed) to identify the optimum timing and magnitude for the implementation of a brief alcohol intervention program (Larimer and Cronce, 2007; Neighbors et al., 2006) to maximize its effect across the entire student body. With regard to a current initiative to lower the minimum legal drinking age, proponents argue that the social norms of underage drinkers on college campuses are biased toward heavy episodic drinking because underage drinkers tend to drink in private settings, where heavy episodic drinking is the norm, rather than in public settings, where more moderate drinking is the norm (Maloney, 2008; McCardell, 2008). In our model, the social-norm parameters governing the flow of students from the social-drinking compartments to the heavy episodic drinking compartment could be manipulated to simulate an increase in the flow to heavy episodic drinking simulating a misperception of the heavy episodic drinking norms by underage drinkers. Finally, a policy to ban alcohol on campus that would basically reduce social interactions between abstainers and drinkers could be simulated as a decrease in the social-interaction parameter from the abstainer to the light-drinker compartments.
For a number of reasons, the college drinking environment represents an ideal social system for applying the systems approach outlined in this discussion. First, the college environment is a relatively closed system inhabited by a relatively homogenous population with regard to various demographic parameters (e.g., age, socioeconomic status). This greatly simplifies modeling because the number of processes influencing changes in drinking behavior is small compared with open systems with heterogeneous populations, such as cities. Frequently, attempts to model social systems may fail because of the complexity of the overall system.
Second, there is strong evidence that the college environment, an exogenous system level factor, is a powerful force in affecting changes in drinking patterns. Researchers note that the college environment represents a developmental mismatch, in which individuals who would otherwise not be inclined to engage in heavy episodic drinking do so because the environmental niche in which they find themselves promotes heavy drinking patterns (Schulenberg et al., 2001; Schulenberg and Maggs, 2002; Sher and Rutledge, 2007).
Finally, there is a practical reason. College administrators have been reluctant to address the college drinking environment because of the great amount of political will required to enact such policies based on the studies of the effectiveness of the policy on a campus that may be nothing like theirs (Wechsler et al., 2000a). However, predictions made using a systems approach begin to address the comparability issue, through the use of “experiments” where the settings are exchanged, permitting the consideration of counterfac-tual evidence typically unavailable in observational research (Diez Roux, 2007; Messer, 2007; Oakes, 2004).
These strengths, however, should be tempered by the many limitations associated with the systems approach. First, our model is deterministic and based on a number of assumptions that may or may not be correct. It ignores finite population size and treats the individuals in each compartment as being infinitely divisible. As a result, the flows among compartments can consist of fractions of individuals, rather than integer wholes. Events themselves, such as the “instigation” of a social contact between a drinker and a nondrinker that results in the nondrinker transitioning to a drinking compartment, are also treated as continuous, rather than as discrete, phenomena. Finally, our discrete formulation assumes the compartments are entirely homogeneous and instantaneously well mixed. Thus, all light drinkers are identical to one another, and the moment abstainers become light drinkers, they are indistinguishable from all other light drinkers. We plan to relax the assumptions of infinite population size, continuous events, homogeneity, and instantaneous mixing by developing stochastic and individual-level counterparts to the deterministic formulation.
Second, the model is a simplification and an abstraction of a highly complex reality, as are all models. Our task is to reach the appropriate tradeoff between realism and tractability, where tractability is measured by our ability to understand the model and to estimate the model's parameters, while retaining reasonable predictive ability.
Third, our model has not been fully validated experimentally, and further testing is needed in predicting college drinking behaviors using additional real data from actual colleges. We are just now beginning to address this limitation by estimating parameters of the model using data from the SNMRP (DeJong et al., 2006). In the near future, this will allow us to evaluate the accuracy of the model predictions across the 32 campuses of this multicampus data set.
The most important reason for modeling college drinking patterns is that it allows us to predict drinking behavior while varying the different parameters of the system to mimic actual college environments. Mathematical models have been successfully used to predict the behavior of systems ranging from particle physics to global climate change (Sarewitz and Pielke, 1999). Historically, heavy episodic drinking on college campuses has proved resistant to individual-level interventions designed to address one or another process (e.g., social norms, enforcement) associated with heavy episodic drinking. This study represents the first attempt to model the various processes involved with college drinking patterns in a systematic way. The results suggest that a relatively complex social system like college drinking can be modeled to provide policymakers a tool for forecasting the consequences of a variety and/or a combination of interventions. Although the predictions from the model would require further validation experimentally, they do begin to provide an explanation for the varying results associated with the numerous efforts to address the high rate of heavy episodic drinking across U. S. college campuses.
Footnotes
This research was supported by National Institute on Alcohol Abuse and Alcoholism grants RO1 AA015573 and RO1 AA014679.
References
- Ackoff RL. The development of operations research as a science. Oper. Res. 1956;4:265–295. [Google Scholar]
- Anderson RM, May RM. Population biology and infectious disease: Part I. Nature. 1979;280:361–367. doi: 10.1038/280361a0. [DOI] [PubMed] [Google Scholar]
- Auchincloss AH, Diez Roux AV. A new tool for epidemiology: The usefulness of dynamic-agent models in understanding place effects on health. Amer. J. Epidemiol. 2008;168:1–8. doi: 10.1093/aje/kwn118. [DOI] [PubMed] [Google Scholar]
- Baer JS, Kivlahan DR, Marlatt GA. High-risk drinking across the transition from high school to college. Alcsm Clin. Exp. Res. 1995;19:54–58. doi: 10.1111/j.1530-0277.1995.tb01472.x. [DOI] [PubMed] [Google Scholar]
- Borsari B, Carey KB. Peer influences on college drinking: A review of the research. J. Subst. Abuse. 2001;13:391–424. doi: 10.1016/s0899-3289(01)00098-0. [DOI] [PubMed] [Google Scholar]
- Caulkins JP, Behrens DA, Knoll C, Tragler G, Zuba D. Markov chain modeling of initiation and demand: The case of the U.S. cocaine epidemic. Hlth Care Manag. Sci. 2004;7:319–329. doi: 10.1007/s10729-004-7540-4. [DOI] [PubMed] [Google Scholar]
- Caulkins JP, Dietze P, Ritter A. Dynamic compartmental model of trends in Australian drug use. Hlth Care Manag. Sci. 2007;10:151–162. doi: 10.1007/s10729-007-9012-0. [DOI] [PubMed] [Google Scholar]
- Clapp JD, Shillington AM. Environmental predictors of heavy episodic drinking. Amer.. J. Drug Alcohol Abuse. 2001;27:301–313. doi: 10.1081/ada-100103711. [DOI] [PubMed] [Google Scholar]
- DeJong W, Langford LM. A typology for campus-based alcohol prevention: Moving toward environmental management strategies. J. Stud. Alcohol. 2002;(Supplement No. 14):140–147. doi: 10.15288/jsas.2002.s14.140. [DOI] [PubMed] [Google Scholar]
- DeJong W, Schneider SK, Towvim LG, Murphy MJ, Doerr EE, Simonsen NR, Mason KE, Scribner RA. A multisite randomized trial of social norms marketing campaigns to reduce college student drinking. J. Stud. Alcohol. 2006;67:868–879. doi: 10.15288/jsa.2006.67.868. [DOI] [PubMed] [Google Scholar]
- Diez Roux AV. Integrating social and biologic factors in health research: A systems view. Ann. Epidemiol. 2007;17:569–574. doi: 10.1016/j.annepidem.2007.03.001. [DOI] [PubMed] [Google Scholar]
- Dowdall GW, Wechsler H. Studying college alcohol use: Widening the lens, sharpening the focus. J. Stud. Alcohol. 2002;(Supplement No. 14):14–22. doi: 10.15288/jsas.2002.s14.14. [DOI] [PubMed] [Google Scholar]
- Everingham SS, Rydell CP. Modeling the Demand for Cocaine. Santa Monica, CA: Drug Policy Research Center, RAND; 1994. [Google Scholar]
- Gorman DM, Mezic J, Mezic I, Gruenewald PJ. Agent-based modeling of drinking behavior: A preliminary model and potential applications to theory and practice. Amer.. J. Publ Hlth. 2006;96:2055–2060. doi: 10.2105/AJPH.2005.063289. [DOI] [PMC free article] [PubMed] [Google Scholar]
- Harford TC, Wechsler H, Seibring M. Attendance and alcohol use at parties and bars in college: A national survey of current drinkers. J. Stud. Alcohol. 2002;63:726–733. doi: 10.15288/jsa.2002.63.726. [DOI] [PubMed] [Google Scholar]
- Hingson R, Heeren T, Winter M, Wechsler H. Magnitude of alcohol-related mortality and morbidity among U.S. college students ages 18–24: Changes from 1998 to 2001. Annual Rev. Publ Hlth. 2005;26:259–279. doi: 10.1146/annurev.publhealth.26.021304.144652. [DOI] [PubMed] [Google Scholar]
- Hingson RW, Howland J. Comprehensive community interventions to promote health: Implications for college-age drinking problems. J. Stud. Alcohol. 2002;(Supplement No. 14):226–240. doi: 10.15288/jsas.2002.s14.226. [DOI] [PubMed] [Google Scholar]
- Hingson RW, Zha W, Weitzman ER. Magnitude of and Trends in Alcohol-Related Mortality and Morbidity Among U.S. College Students Ages 18–24, 1998–2005. J. Stud. Alcohol Drugs. 2009;(Supplement No. 16):12–20. doi: 10.15288/jsads.2009.s16.12. [DOI] [PMC free article] [PubMed] [Google Scholar]
- Holder HD. Prevention of alcohol-related accidents in the community. Addiction. 1993;88:1003–1012. doi: 10.1111/j.1360-0443.1993.tb02118.x. [DOI] [PubMed] [Google Scholar]
- Homer JB. A system dynamics model for cocaine prevalence estimation and trend projection. J. Drug Issues. 1993;23:251–279. [Google Scholar]
- Jacquez JA. Compartmental Analysis in Biology and Medicine. Ann Arbor, MI: Biomedware Press; 1996. [Google Scholar]
- Knight JR, Harris SK, Sherritt L, Kelley K, Van Hook S, Wechsler H. Heavy drinking and alcohol policy enforcement in a statewide public college system. J. Stud. Alcohol. 2003;64:696–703. doi: 10.15288/jsa.2003.64.696. [DOI] [PubMed] [Google Scholar]
- Larimer ME, Cronce JM. Identification, prevention, and treatment revisited: Individual-focused college drinking prevention strategies 1999–2006. Addict. Behav. 2007;32:2439–2468. doi: 10.1016/j.addbeh.2007.05.006. [DOI] [PubMed] [Google Scholar]
- Levy DT, Chaloupka F, Gitchell J, Mendez D, Warner KE. The use of simulation models for the surveillance, justification and understanding of tobacco control policies. Hlth Care Manag. Sci. 2002;5:113–120. doi: 10.1023/a:1014476916361. [DOI] [PubMed] [Google Scholar]
- Levy DT, Friend K, Polishchuk E. Effect of clean indoor air laws on smokers: The clean air module of the SimSmok computer simulation model. Tob. Control. 2001;10:345–351. doi: 10.1136/tc.10.4.345. [DOI] [PMC free article] [PubMed] [Google Scholar]
- McCabe SE, Schulenberg JE, Johnston LD, O'Malley PM, Bachman JG, Kloska DD. Selection and socialization effects of fraternities and sororities on US college student substance use: A multi-cohort national longitudinal study. Addiction. 2005;100:512–524. doi: 10.1111/j.1360-0443.2005.01038.x. [DOI] [PubMed] [Google Scholar]
- McCardell J. The Drinking Age: The Status Quo Has Bombed. US News World Rep. 2008;145((6)):11. September 15–22, [PubMed] [Google Scholar]
- Maloney J. College Presidents Want Drinking Age Lowered to 18. New York: Newsday; 2008. August 19, [Google Scholar]
- Mayfield D, McLeod G, Hall P. The CAGE Questionnaire: Validation of a new alcoholism screening instrument. Amer J. Psychiat. 1974;131:1121–1123. doi: 10.1176/ajp.131.10.1121. [DOI] [PubMed] [Google Scholar]
- Messer LC. Invited commentary: Beyond the metrics for measuring neighborhood effects. Amer. J. Epidemiol. 2007;165:868–871. doi: 10.1093/aje/kwm038. discussion 872–873, [DOI] [PubMed] [Google Scholar]
- Neighbors C, Lewis MA, Bergstrom RL, Larimer ME. Being controlled by normative influences: Self-determination as a moderator of a normative feedback alcohol intervention. Hlth Psychol. 2006;25:571–579. doi: 10.1037/0278-6133.25.5.571. [DOI] [PMC free article] [PubMed] [Google Scholar]
- Oakes JM. The (mis)estimation of neighborhood effects: Causal inference for a practicable social epidemiology. Social Sci. Med. 2004;58:1929–1952. doi: 10.1016/j.socscimed.2003.08.004. [DOI] [PubMed] [Google Scholar]
- Perkins HW, Haines MP, Rice R. Misperceiving the college drinking norm and related problems: A nationwide study of exposure to prevention information, perceived norms and student alcohol misuse. J. Stud. Alcohol. 2005;66:470–478. doi: 10.15288/jsa.2005.66.470. [DOI] [PubMed] [Google Scholar]
- Perkins HW, Meilman PW, Leichliter JS, Cashin JR, Presley CA. Misperceptions of the norms for the frequency of alcohol and other drug use on college campuses. J. Amer. Coll. Hlth. 1999;47:253–258. doi: 10.1080/07448489909595656. [DOI] [PubMed] [Google Scholar]
- Reifman A, Watson WK, McCourt A. Social networks and college drinking: Probing processes of social influence and selection. Pers. Social Psychol. Bull. 2006;32:820–832. doi: 10.1177/0146167206286219. [DOI] [PubMed] [Google Scholar]
- Reis J, Riley WL. Predictors of college students' alcohol consumption: Implications for student education. J. Genet. Psychol. 2000;161:282–291. doi: 10.1080/00221320009596711. [DOI] [PubMed] [Google Scholar]
- Rydell C, Caulkins JP, Everingham SS. Enforcement or treatment? Modeling the relative efficacy of alternatives for controlling cocaine. Oper. Res. 1996;44:687–695. [Google Scholar]
- Sarewitz D, Pielke R., Jr Prediction in Science and Policy. Technol. Soc. 1999;21:121–133. [Google Scholar]
- Schulenberg JE, Maggs JL. A developmental perspective on alcohol use and heavy drinking during adolescence and the transition to young adulthood. J. Stud. Alcohol. 2002;(Supplement No. 14):54–70. doi: 10.15288/jsas.2002.s14.54. [DOI] [PubMed] [Google Scholar]
- Schulenberg J, Maggs JL, Long SW, Sher KJ, Gotham HJ, Baer JS, Kivlahan DR, Marlatt GA, Zucker RA. The problem of college drinking: Insights from a developmental perspective. Alcsm Clin. Exp. Res. 2001;25:473–477. [PubMed] [Google Scholar]
- Scribner R, Mason K, Theall K, Simonsen N, Schneider SK, Towvim LG, DeJong W. The contextual role of alcohol outlet density in college drinking. J. Stud. Alcohol Drugs. 2008;69:112–120. doi: 10.15288/jsad.2008.69.112. [DOI] [PubMed] [Google Scholar]
- Sher KJ, Rutledge PC. Heavy drinking across the transition to college: Predicting first-semester heavy drinking from precollege variables. Addict. Behav. 2007;32:819–835. doi: 10.1016/j.addbeh.2006.06.024. [DOI] [PMC free article] [PubMed] [Google Scholar]
- Task Force of the National Advisory Council on Alcohol Abuse and Alcoholism. A Call to Action: Changing the Culture of Drinking at U.S. Colleges, NIH Publication No. 02-5010. Bethesda, MD: National Institute on Alcohol Abuse and Alcoholism; 2002. [Google Scholar]
- Tengs TO, Ahmad S, Moore R, Gage E. Federal policy mandating safer cigarettes: A hypothetical simulation of the anticipated population health gains or losses. J. Policy Anal. Manag. 2004;23:857–872. doi: 10.1002/pam.20051. [DOI] [PubMed] [Google Scholar]
- Thombs DL, Wolcott BJ, Farkash LG. Social context, perceived norms and drinking behavior in young people. J. Subst. Abuse. 1997;9:257–267. doi: 10.1016/s0899-3289(97)90020-1. [DOI] [PubMed] [Google Scholar]
- Toomey TL, Lenk KM, Wagenaar AC. Environmental policies to reduce college drinking: An update of research findings. J. Stud. Alcohol Drugs. 2007;68:208–219. doi: 10.15288/jsad.2007.68.208. [DOI] [PubMed] [Google Scholar]
- Wechsler H, Dowdall GW, Davenport A, Castillo S. Correlates of college student binge drinking. Amer. J. Publ. Hlth. 1995;85:921–926. doi: 10.2105/ajph.85.7.921. [DOI] [PMC free article] [PubMed] [Google Scholar]
- Wechsler H, Kelley K, Weitzman ER, SanGiovanni JP, Seibring M. What colleges are doing about student binge drinking: A survey of college administrators. J. Amer. Coll. Hlth. 2000a;48:219–226. doi: 10.1080/07448480009599308. [DOI] [PubMed] [Google Scholar]
- Wechsler H, Kuo M, Lee H, Dowdall GW. Environmental correlates of underage alcohol use and related problems of college students. Amer. J. Prev. Med. 2000b;19:24–29. doi: 10.1016/s0749-3797(00)00163-x. [DOI] [PubMed] [Google Scholar]
- Wechsler H, Nelson TF. What we have learned from the Harvard School of Public Health College Alcohol Study: Focusing attention on college student alcohol consumption and the environmental conditions that promote it. J. Stud. Alcohol Drugs. 2008;69:481–490. doi: 10.15288/jsad.2008.69.481. [DOI] [PubMed] [Google Scholar]
- Weitzman ER, Folkman A, Folkman MP, Wechsler H. The relationship of alcohol outlet density to heavy and frequent drinking and drinking-related problems among college students at eight universities. Hlth Place. 2003a;9:1–6. doi: 10.1016/s1353-8292(02)00014-x. [DOI] [PubMed] [Google Scholar]
- Weitzman ER, Nelson TF, Wechsler H. Taking up binge drinking in college: The influences of person, social group, and environment. J. Adolesc. Hlth. 2003b;32:26–35. doi: 10.1016/s1054-139x(02)00457-3. [DOI] [PubMed] [Google Scholar]


