

Abstract
This report used a population-representative longitudinal twin study with two birth cohorts to explore the association between intelligence and education by understanding how genetic and environmental influences on intelligence moderate genetic and environmental influences on school grades and educational attainment. Non-shared environmental influences on grades were strong when IQ was low, but decreased across the range of IQ. Shared environmental influences common to age 24 educational attainment and age 17 IQ were strong when IQ was low, but genetic influences common to IQ and education were strong when IQ was high. These results suggest that the causal mechanisms linking educational variables with intelligence differ for people with different levels of intelligence.
Keywords: grade point average, gene-environment correlation and interaction, educational attainment, IQ, genetic and environmental influences
The fact that intelligence and education are associated has been realized as long as intelligence has been measured. Identification of children who would not benefit from standard educational practices was the primary motive when Binet (1905) developed the first IQ tests. Concurrently, Spearman (1904) found teachers’ subjective estimates of intelligence to be correlated with school exam results. A typical cross-sectional correlation between intelligence and educational achievement measures is about 0.5 (Johnson, McGue, & Iacono, 2005). Like any other correlation, the association between intelligence and education can arise through different causal pathways. More intelligent people may seek and gain access to more and higher-level education. On the other hand, exposure to more education may directly increase intelligence test scores. But intelligence tests may also resemble school tasks and tests in content and form, and/or important third variables such as access to financial resources may contribute to both. Causal effects may flow in all directions, and longitudinal studies can help to quantify their relative magnitudes.
Intelligence generally predicts educational attainment moderately to strongly, whether educational attainment is assessed by years spent in full-time education, the highest qualification obtained by a person, or the scores obtained on educational assessments (Jencks, 1979). For example, the general factor from the Cognitive Abilities Test (CAT) battery taken at age 11 correlated about .8 with the general factor of grades on the General Certificate of Secondary Education (GCSE) examinations taken at age 16 in a sample of about 70,000 British students (Deary et al., 2007). This study was particularly noteworthy because differences in exposure to education were minimized at both time points. The CAT was administered at the end of primary education, which has the same curriculum for all children, and the GCSE examinations were administered while all participants were still in school; that is, prior to the end of compulsory education. Older studies have reported similar correlations ranging from .60 to .96 (e.g., Bouchard, 1984; Kemp, 1955; Wiseman, 1966). These studies all indicate that intelligence has strong causal effects on education.
Studies of the effects of education on intelligence have not tended to be longitudinal, but they instead have made use of circumstances affecting school attendance in order carefully to examine the relation between length of schooling and intelligence. In general, these studies have indicated that more time in school also leads to greater intelligence. For example, Baltes and Reinert (1969) took advantage of the German school system’s age requirement at the time that children be 6 years old by April 1 in order to enter school. This made it possible to compare the scores of children whose birthdays fell either just before or just after that date, so that the groups were effectively matched for chronological ages but had a 1-year difference in schooling. Baltes and Reinert compared the intelligence scores of three cross-sections of German 8- to 10-year-olds who differed in age by at most 4-months within cross-section. The 8-year-olds who had received an extra year of schooling performed more like the 10-year-olds who had received less schooling than they did like their own age-mates who had received one year less schooling. In another example (Sherman & Key, 1932), many early 20th century children of Scotch-Irish immigrants in the Blue Ridge Mountains received little or no schooling or access to movies and newspapers. When tested using performance IQ measures that did not depend on literacy, the older children had lower IQ’s than the younger children. There was one community in the area that did have access to schooling, however, and the IQ’s of the children in that community did not vary with age. A South African community of East Indian immigrants also experienced varying exposure to school that was not dependent on ability. Schmidt (1967) reported correlations between schooling and two measures of nonverbal intelligence and one measure of verbal intelligence that ranged from .49 to .68.
Intelligence and education: Genetic and Environmental Variance and Covariance
It is clear that not everyone derives the same benefit from any given educational opportunity and that the same educational opportunities are not available to everyone. This is the fundamental developmental issue about which we still have much to learn in order to understand the bidirectional effects involved in the association between intelligence and education. At bottom, addressing the questions of nature/nurture, person/situation, genes and environment, cause and effect involves understanding how direct environmental effects and genetic and environmentally-based niche-picking processes are balanced in the association between education and intelligence. Niche-picking processes take place when individual characteristics lead one to behave in ways that create particular environmental circumstances. The individual characteristics involved may arise through any combination of genetic and environmental influences (Johnson, 2007), but people often tend to link the term ‘niche picking’ with genetic influences. Measurement models that can simultaneously provide evidence for causal attributions through precise timing and identify both genetic and environmental influences and their relations to the timing of measurement can be particularly helpful in illuminating these processes.
It is well established that intelligence shows genetics influences. In childhood, they run less than 50% of variance, but they increase to around 70% in adulthood (Bouchard & McGue, 1981; Deary, Spinath, & Bates, 2006; Plomin & Spinath, 2004). Shared environmental influences account for perhaps 35% of variance in early childhood, but its contribution declines to near zero in adulthood. Non-shared environmental influences, including error of measurement, contribute a pretty consistent approximately 30% of variance through most of life.
We can make use of multivariate variance decompositions to explore the genetic and environmental transactions involving intelligence further. Multivariate variance decompositions can provide estimates of the environmental and genetic contributions to the association between intelligence and education, and the extent to which the two variables share common genetic and environmental influences. For example, the CITO is a national test of educational achievement used in the Netherlands at age 12. In a sample providing intelligence test scores at ages 5, 7, 10, and 12, the intelligence test scores predicted age 12 achievement test scores between .41 and .63 (Bartels, et al., 2002). Genetic influences on the achievement test accounted for about 60% of variance, and genetic influences were the principal reason for the correlations between the intelligence and achievement tests. Johnson, McGue, and Iacono (2005, 2006) obtained similar results in an adolescent sample in the United States. There, a latent variable representation of school grades formed the measure of achievement. Almost 70% of its variance could be attributed to genetic influence, and 56% was common to genetic influences on intelligence. Importantly, of course, though intelligence clearly contributes to educational achievement, it is not the only such contributor. In particular, engagement and motivation, family risk, personality traits such as conscientiousness, and disruptive behaviors are all variables that have received attention as contributors to school achievement (e.g., Johnson, 2008). These variables also show genetic and environmental influences that may be related to those on either or both of intelligence and school achievement. In the Johnson, McGue, and Iacono studies, however, even after controlling for the genetic and environmental influences on such predictors of school grades 34% of the genetic influences on the level of school grades could be attributed to genetic influences on intelligence.
The present study
Though these multivariate variance decompositions have helped to clarify the reasons for the association between education and intelligence, they have relied on the assumptions that genetic and environmental influences function independently and constantly across their ranges. There is increasing evidence that these assumptions are often violated (Johnson, 2007). With direct relevance to the subject at hand, for example, Turkheimer, et al. (2003) found that genetic influences on intelligence in 7-year-olds varied with level of family socioeconomic status (SES). Though this study failed to address the existence of and possible effects of SES on variance common to intelligence and SES, it did demonstrate some of the processes involved. This suggests that it is important to test the validity of these assumptions with respect to the association between intelligence and education. The point of such analyses is not to develop evidence for the existence of “gene-environment interaction” or moderation of genetic and/or environmental influences per se. Rather, it is to explore the transactions between person and situation, nature and nurture, genetic and environmental influences in order to understand more clearly how individuals differences in intelligence contribute to individual differences in educational outcomes.
In the present study we focused on educational performance and attainment in late adolescence and young adulthood. We made use of two linked samples to explore the genetic and environmental transactions linking education and intelligence. At age 17, when adolescents were still in relatively homogeneous educational environments (high school), we made use of school grade point averages to measure performance. At age 24, when most young adults had made most of their choices regarding educational attainment, we assessed that educational attainment. At both ages, we wished to make use of variables that reflected the readily externally available measures of education generally used as control variables in the sort of study whose methodology we wished to address rather than what participants actually learned in their educational careers. For this reason, we did not wish to make use of standardized tests of educational achievement.
We employed multivariate models that simultaneously allow for the examination of the extent to which genetic and environmental influences may be common to education and intelligence and the extent to which the magnitudes of genetic and environmental influences on education may vary with levels of intelligence. The use of these models allowed us to address the degree to which education results from direct environmental effects and niche-picking associated with intelligence as well as the degree to which these processes may vary with level of intelligence. In addition, the models allowed us to estimate the extent to which genetic and environmental influences on education may vary with levels of intelligence, making it possible to assess the kinds of effects that education may have on cognitive performance in later life. Our study thus helps to clarify how education and intelligence are linked as young people move from their environments of origin to those they establish in their own rights.
As we have noted, genetic influences on IQ are strong and well-established. IQ is also relatively stable throughout the lifespan (Deary, Spinath, & Bates, 2006; Deary, Whiteman, Starr, Whalley, & Fox, 2004; Fagan, Holland, & Wheeler, 2007; Fagan & Detterman, 1992). Because of this, we made use of IQ measured 6-7 years before education in our young samples. In doing so, we were relying on the evidence cited above that IQ is the more causal variable in the association between IQ and education, yet also selecting a statistical treatment that measured the strength of that causal association. If, in addition, we found substantive common genetic or environmental influences on both IQ and education, then the causal process could be described as one involving niche-picking. In contrast, if IQ moderated genetic or environmental influences on education that were independent of those on IQ, then the causal process could be described as one in which IQ exerts a directly limiting or enabling environmental force on education.
But the very existence of genetic or environmental niche-picking processes involving education and IQ implies that the social system in which these processes exist will not be static over time, and thus will also not be static across the range of IQ. Niche-picking involves actively seeking out as well as passively receiving different experiences involving educational attainment, but with varying degrees of success over time. Thus genetic and environmental differences in educational attainment may be expressed to differing degrees in people with different IQ’s. As long as there is any correlation at all between education and IQ, the presence of both moderating effects of IQ on variance in education and substantial correlation between the common genetic and environmental influences is likely (Johnson, 2007). In this paper we explored both the magnitudes and implications of such effects and their implications for the use of education variables as controls in studies of important outcomes such as health and well-being.
Method
Sample
Participants were male and female twin pairs from the ongoing Minnesota Twin Family Study (MTFS). The MTFS is a population-based accelerated longitudinal study of same-sex twins and their parents. It consists of two cohorts, initially recruited at ages 11 and 17. We made use of both cohorts for this study. The younger cohort has been assessed at ages 11, 14, and 17, with assessments at age 20 in progress. The older cohort has been assessed at ages 17, 20, and 24, with assessments at age 29 in progress. The cohorts were recruited using publicly available databases to determine the current status and location of more than 90% of the same-sex twin pairs born in Minnesota in the targeted years.
For the younger cohort the targeted birth years were 1977-1982 for males, and 1981-1984 and 1988-1990 for females. For the older cohort the targeted birth years were 1972-1978 for males and 1975-1979 for females. Located twins without significant mental or physical handicap who lived within a day’s drive of Minneapolis with at least one biological parent were invited to complete a day-long, in-person assessment at the University of Minnesota. Less than 20% of located, eligible families declined participation.
The twins and their parents were generally representative of the Minnesota population during the approximately 20-year period in which the twins were born. Fathers averaged a little over 14.5 years of education, mothers about 1 year less. The average Hollingshead (1957) occupational level of the families was about 4, reflecting jobs at the skilled ‘blue collar’ level. The full range of educational and occupational levels was represented, however. Some parents held graduate degrees or professional credentials and worked in highly professional occupations, while others had dropped out of high school and/or were unemployed or working in semi-skilled jobs. The standard deviation was just under 2 Hollingshead levels. More than 80% of the families who did not participate completed a brief mail or telephone survey, which made it possible to compare participants and non-participants on some measures, and thus to develop a good understanding of the representativeness of the sample. Parents in non-participating families averaged .3 years less education than those in participating families, a difference that was statistically significant but not of great substance (about .1 sd). Participating and non-participating families did not differ significantly in self-reported mental health. A complete analysis of non-participants and description of the ascertainment and assessment procedures used in the MTFS is provided by Iacono, et al. (1999).
In the younger cohort, the male sample consisted of 762 twins (381 pairs). Of these, 256 pairs were monozygotic (MZ), 122 were dizygotic (DZ), and 3 were missing zygosity. The female sample in the younger cohort consisted of 886 twins (443 pairs). Of these, 269 pairs were MZ, 173 were DZ, and 1 was missing zygosity. At the age 17 assessment, 625 individual boys (82%) and 507 individual girls (57%) returned for assessment. The proportion of females with data at age 17 was much lower than that of males because many of the females had not yet reached age 17. There were no significant differences between those who returned at age 17 and those who did not in family occupational level or grades in school at age 11. Those who returned at age 17 did have somewhat higher IQ’s (p<.001, average IQ of 104.3 for those who returned and 101.6 for those who did not, standardized mean difference of .20).
In the older cohort, the male sample consisted of 578 twins (289 pairs). Of these, 376 were monozygotic (MZ) and 202 were dizygotic (DZ). The female sample in the older cohort consisted of 676 twins (338 pairs), including 446 MZ and 228 DZ twins. At age 24, 532 individual males (92%) and 631 individual females (93%) returned for assessment. There was no significant difference between those who returned at age 24 and those who did not in family occupational level. Those who returned at age 24 had slightly higher grades in school at age 17 than those who did not (p=.012, average grade point averages of 3.1 for those who returned and 2.9 for those who did not, standardized mean difference of .28). They also had somewhat higher IQ’s (p=.001, average IQ of 99.9 for those who returned and 94.9 for those who did not, standardized mean difference of .36). Consistent with the demographics of Minnesota for the targeted birth years, over 98% of the twins were Caucasian.
Measures
Younger Cohort: Grade Point Average at Age 17
In general, MTFS does not collect data on actual school grades. Rather, participants reported the grades they typically received in language arts, math, social studies, and science classes by indicating that the grades were much better than average (A’s=4), better than average (B’s=3), average (C’s=2), below average (D’s=1), or much below average (i.e., failing=0). Possible scores thus ranged from 0 to 4. This approach was taken because the MTFS families were drawn from many different school systems, which created disparity in grading formats, procedures, and standards. We made use of the average of the subject reports, and refer to this variable as GPA. A random sample of 67 participants from the younger MTFS cohort assessed at age 14 showed a correlation between our reporter measure and grade point average computed from school transcripts of .89. Most of the participants who did not end up completing high school generally still provided grade reports at the age 17 assessment, either because they were still in school at that time or because they reported the kinds of grades they had been earning before they dropped out.
Younger Cohort: IQ at Age 11
IQ was assessed using an abbreviated version of the Wechsler Intelligence Scale for Children – Revised (WISC-R; Wechsler, 1974) at age 11 when participants were recruited. The abbreviated version of this test consisted of 2 verbal (Vocabulary and Information) and 2 performance (Block Design and Picture Arrangement) subtests. These subtests were selected because the resulting IQ score correlates .90 with total WISC-R IQ based on all subtests. Scores ranged from 49 to 156.
Older Cohort: Educational Attainment
At age 24 participants reported both educational attainment to date and whether they were currently enrolled in educational programs. We used this information to compile a 12-point scale of educational attainment. Scale values ranged from 0 for failure to complete high school to 12 for completion of a professional degree (PhD, JD, MD, etc.). Participants who dropped out of high school but returned to complete a general equivalency degree were coded as 1; those who completed high school in the usual manner but attained no education beyond that were coded as 2. Completion of a post-high school vocational training program was coded as 4, while completion of a 4-year college degree was coded as 8. Participants who were enrolled in master’s degree programs were coded as 9; those who had completed master’s degrees but were no longer enrolled in school were coded as 10. The participant data observations ranged from 0 (failure to complete high school) to 11 (currently enrolled in a professional degree program). Thus our metric reflected at least to some degree the potential to attain education beyond the actual age of assessment. The educational attainment variable was approximately normally distributed (skewness=-.66, kurtosis=-.48). Parents from both cohorts also reported both their own years of education and degrees attained at the intake assessments.
Older Cohort: IQ at Age 17
Participants received an abbreviated version of the Wechsler Adult Intelligence Scale - Revised (WAIS- R; Wechsler, 1981) at age 17. Like the version for the younger cohort, this abbreviated version consisted of 2 verbal (Vocabulary and Information) and 2 performance (Block Design and Picture Arrangement) subtests. Scores ranged from 69 to 151. Parents from both cohorts also received this test at the intake assessments.
Descriptive statistics for the variables used for each cohort are shown in Table 1. In the remainder of this paper we will use the term GPA/Ed to refer interchangeably to educational attainment or GPA when appropriate.
Table 1.
Descriptive Statistics for Study Variables
| Variable | Mean | Standard Deviation |
|---|---|---|
| Age 11 Cohort | ||
| WISC IQ at age 11 | 103.47 | 13.85 |
| GPA at age 17 | 3.01 | .80 |
| Age 17 Cohort | ||
| WAIS IQ at age 17 | 99.52 | 14.06 |
| Attained Education | 6.30 | 2.40 |
Note: WISC is Wechsler Intelligence Scale for Children; GPA is grade point average; WAIS is Wechsler Adult Intelligence Scale; attained education was measured at age 24. 6.30 corresponds to completion of slightly more than a community college degree.
Analytical Approach
Conceptual Approach
To test whether GPA/Ed reflects primarily environmental influences and to explore whether and how IQ moderates genetic and environmental influences on GPA/Ed, we made use of a model that explicitly quantifies the genetic and environmental influences on a particular trait in the context of correlation with and moderation by genetic and environmental influences on an associated trait. The model was developed and outlined by Purcell (2002), and he provides reference to a website providing computer scripts for implementing the model. To show how this model works, we need to define several quantitative genetic concepts and describe how they form the foundation for the model we used. We begin by describing the much simpler standard bivariate quantitative genetic model. This model relies first on the idea that the phenotypic (observed) variance (Vp) in each of the two traits is a linear function of additive genetic (A2) and shared (C2) and non-shared (E2) environmental variance components (Vi = Ai2 + Ci2 + Ei2 and Ve = Ae2 + Ce2 + Ee2, with subscripts i and e for intelligence and education).
Shared environmental variance components reflect influences that distinguish among twin pairs but that act to make co-twins similar to each other. Family SES and parental efforts to equalize educational opportunities for their offspring are generally thought to contribute to shared environmental variance. Though they include measurement error, nonshared environmental variance components also reflect systematic influences that act to make co-twins different from each other. An important example may be different GPA’s and aptitude test scores that contribute to differing levels of qualification for higher education.
This standard bivariate model is generally depicted as shown in Figure 1. It shows both members of each twin pair and the correlations between the genetic and environmental influences contributing to their intelligence and GPA/Ed as well as paths allowing for genetic and environmental influences both common to intelligence and GPA/Ed and unique to GPA/Ed. Under this model, each of the components of variance in GPA/Ed is assumed to be constant across the range of IQ. As we were interested here in exploring the extent to which influences on GPA/Ed were direct environmental effects and whether niche-picking processes involving intelligence played some role, we required that the components of variance in GPA/Ed be allowed to vary with IQ. Moderation of the variance components of educational attainment with level of some other variable such as IQ is an example of gene-environment interaction (GxE). GxE can be thought of as environmentally driven genetic expression. The related phenomenon of niche-picking, or selecting genetically compatible environments, is usually measured using genetic correlation (rGE), which can be thought of as genetically driven environmental exposure. Similar kinds of moderating effects and correlations can take place for shared and nonshared environmental influences. Genetic and environmental correlations range from −1 to 1 in the manner usual to correlations.
Figure 1.
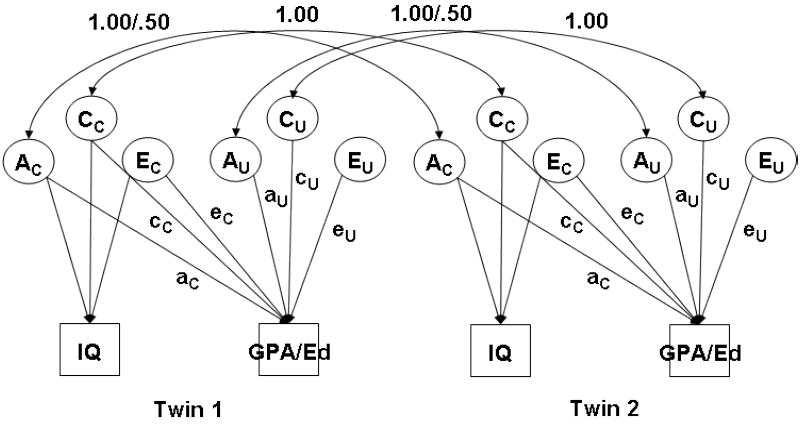
Standard bivariate quantitative genetic model estimating genetic and environmental influences on IQ and Grade Point Average or Educational Attainment (GPA/Ed) for both members of a twin pair. A refers to genetic influences, C to shared environmental influences, and E to nonshared environmental influences. Influences on GPA/Ed can be common to it and IQ or unique to it alone. Only the paths contributing to GPA/Ed are labeled.
As described by Purcell (2002), we adapted the standard quantitative genetic model shown in Figure 1 to include provision for these phenomena by explicitly measuring the possibilities that there are variance components of GPA/Ed common to intelligence and unique to it alone. We were thus measuring two possible kinds of moderating effects: differential sensitivity to IQ that affected both GPA/Ed and IQ, and differential sensitivity to IQ that affected GPA/Ed alone. The adapted model is shown in Figure 2, this time for only a single member of a twin pair, though the links between twins are the same as in Figure 1. Under this model, the paths expressing the genetic and environmental influences on IQ are considered constant as in Figure 1. Though of course we estimated them, we have not explicitly labeled these paths in Figure 2. We did this in order to keep the focus on the paths contributing to variance in GPA/Ed. The paths that are labeled in the figure express the genetic and environmental influences on GPA/Ed. These paths are all linear functions of the form x + M*b, where x and b are regression coefficients and M is the level of IQ1.
Figure 2.
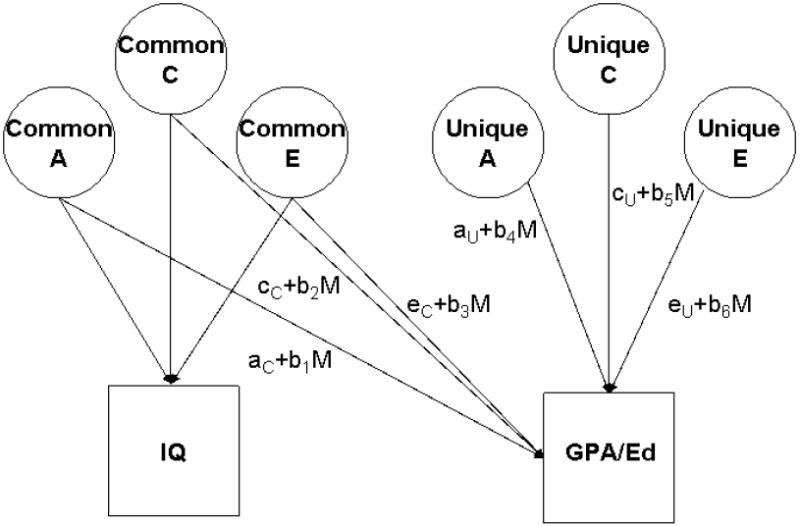
Model of moderation of genetic and environmental influences on Grade Point Average or Educational Attainment (GPA/Ed) in the presence of possible overlap in genetic and environmental influences on the two variables, shown here for one member of a twin pair only. A refers to genetic influences, C to shared environmental influences, and E to nonshared environmental influences. Variance in GPA/Ed can result from any combination of the labeled paths: A, C, and/or E common to IQ and GPA/Ed and/or A, C. and/or E unique to GPA/Ed. Each of these paths can vary with level of IQ, shown by M for moderator in the above path equations. The model includes the paths representing the influences on IQ as well, though they are not labeled in the figure.
Estimates of rGE and the environmental correlations that reflect niche-picking are based on the proportions of the total influences on GPA/Ed that are common to both GPA/Ed and IQ. Thus, for example, rGE is common . In most bivariate models of genetic and environmental influences, these correlations are treated as constant throughout the ranges of either variable. In the presence of significant moderation of genetic or environmental influences on GPA/Ed, however, the corresponding genetic or environmental correlations vary as functions of IQ. It is the measurement of these moderating and correlation effects that enables us to address the extent to which and manner in which intelligence may be involved in GPA/Ed. When changes in the level of the moderating variable, IQ, are associated with changes in variance in GPA/Ed that is unique to GPA/Ed, we can infer that IQ has a direct environmental effect on GPA/Ed.
Data Adjustment and Analytical Implementation
The variables were basically normally distributed. We had small amounts of missing data, but the assumption that these data were missing at random was reasonable (Little & Rubin, 1987), given that ongoing participation was in no way predicated on IQ or family occupational background. We thus used maximum likelihood to fit our models to raw data. We implemented the quantitative genetic models in the computer program Mx (Neale, Boker, Xie, & Maes, 1999), specifying them as recommended by Purcell (2002). All variables were standardized to place them on the same measurement scale.
Assortative mating, or the tendency for parents to be similar to each other, for IQ and education is common (Vandenberg, 1972). IQ’s in the parents of the twins in our samples were correlated .34 on average over both cohorts. Assortative mating for genetically influenced traits acts to make DZ twins more similar for the traits in question in the same manner as do shared environmental influences, making it impossible to distinguish the two kinds of effects. Because MTFS collects IQ and education on the parents of the twins in our samples, we were able to estimate the extent of phenotypic assortative mating in these samples directly. Years of education in the parents of the twins was correlated .57 on average over both cohorts. It is still practically necessary, given that assortative mating is not the primary focus of interest in this study, to assume assortment on the basis of phenotype, though other bases are plausible. We also had to make some assumption about the extent to which the phenotypic correlation reflects genetic influences, but substantial data from other studies are available for reference. We assumed that genetic influences accounted for about 60% of the variance in IQ and about 35% of the variance in Ed, which meant that DZ twins would share about 60% of their genes rather than the 50% that would apply if mating were random2. The assumption for IQ is supported by data from many other studies (Bouchard & McGue, 2003; Deary et al., 2006) that show ranges from 50 to 80%, and the assumption about educational attainment is consistent with these data. The higher the percentage of the parental correlation assumed to be genetic, the higher the estimates of genetic influences on the two traits will be.
We allowed parsimony to dictate the results presented because of the complexity of the quantitative genetic models with which we worked. To do so, we dropped all terms indicating moderating genetic and/or environmental effects from the models when we could do so without significant change in model -2*log likelihood. We evaluated the appropriateness of this using Akaike’s Information Criterion (AIC, Akaike, 1983), an information theoretic fit statistic. These kinds of information theoretic fit statistics make it possible to determine the most parsimonious or efficient representation of the data because they provide objective criteria for selecting models that minimize the amount of information required to express the data. Thus, this statistic was of primary importance in identifying the best model. It also has the advantages of eliminating concerns about planned comparisons and multiple testing and can be useful in clarifying the importance of effects when power to measure their statistical significance is low. The point of dropping insignificant moderating terms was to focus attention on the paths and thus the social forces that were most important in these data. It was not to deny the potential existence of smaller moderating effects on the paths that happened not to be significant in this particular sample.
Results
Descriptive statistics
As would be expected, the IQ and education measures were substantially correlated in both cohorts, and the correlations were similar to those that have been reported in prior studies. The correlation between IQ at age 11 and GPA at age 17 was .40 in the younger cohort, and the correlation between IQ at age 17 and educational attainment was .32 in the older cohort. In general, it was reasonable to conclude that the associations among the variables were similar in the two cohorts.
The correlations between members of monozygotic (MZ) and dizygotic (DZ) twin pairs for the study variables are given in Table 2, along with their cross-twin correlations. Genetic influences are indicated when MZ correlations are greater than DZ correlations, and their relative magnitude can generally be approximated for a given variable as twice the difference between the two correlations (Falconer & Mackay, 1996). Assortative mating and shared environmental influences are both possibly indicated to the extent that DZ correlations are more than half the MZ correlations, and their combined relative magnitude can be approximated for a given variable by doubling the DZ correlation and subtracting the MZ correlation (with a lower bound of 0), though they cannot be separately distinguished, as described above. Nonshared environmental influences and measurement error are indicated to the extent that MZ correlations are less than 1.00. The variables showed evidence of substantial influences of all three kinds. These initial data suggested that genetic influences on IQ accounted for about 40% of variance at age 11 and 60% at age 17, with indications for GPA being very similar. Educational attainment in particular showed important shared environmental influences, perhaps in excess of 40% of variance, but IQ and GPA, at least at age 11, also showed shared environmental influences in the 20-30% range. The observations for these variables at these ages in this sample were very similar to those from other studies.
Table 2.
Twin Correlations of Study Variables
| Variable | MZ | DZ |
|---|---|---|
| For Full Sample | ||
| Age 11 Cohort | ||
| WISC IQ at age 11 | .73 | .54 |
| GPA at age 17 | .75 | .43 |
| Cross-Twin | ||
| Age 17 Cohort | ||
| WAIS IQ at age 17 | .81 | .51 |
| Attained Education | .70 | .56 |
| Cross-Twin | .30 | .32 |
| For Sample in IQ Groups | ||
| Age 11 Cohort - Low IQ | ||
| WISC IQ at age 11 | .49 | .35 |
| GPA at age 17 | .79 | .41 |
| Cross-Twin | .27 | .04 |
| Age 11 Cohort - Moderate IQ | ||
| WISC IQ at age 11 | .38 | .35 |
| GPA at age 17 | .72 | .50 |
| Cross-Twin | .11 | .05 |
| Age 11 Cohort - High IQ | ||
| WISC IQ at age 11 | .44 | .26 |
| GPA at age 17 | .61 | .43 |
| Cross-Twin | -.03 | .13 |
| Age 17 Cohort - Low IQ | ||
| WAIS IQ at age 17 | .46 | .09 |
| Attained Education | .72 | .64 |
| Cross-Twin | .11 | .16 |
| Age 17 Cohort - Moderate IQ | ||
| WAIS IQ at age 17 | .48 | .12 |
| Attained Education | .68 | .58 |
| Cross-Twin | .29 | .11 |
| Age 17 Cohort - High IQ | ||
| WAIS IQ at age 17 | .55 | .26 |
| Attained Education | .62 | .18 |
| Cross-Twin | .10 | .08 |
Note: WISC is Wechsler Intelligence Scale for Children; GPA is grade point average; WAIS is Wechsler Adult Intelligence Scale; attained education was measured at age 24. Low IQ is 90 and below; moderate is 91-109; high is 110 and above.
Moderating Effects of IQ at Age 11 on GPA at Age 17, and of IQ at Age 17 on educational attainment at Age 24
Table 2 also provides correlations between members of MZ and DZ twin pairs broken into groupings by level of IQ, as well as cross-twin correlations between education and IQ. These correlations provide preliminary indications of the moderating effects of IQ that we can expect from the models we fit. They are of course subject to restriction of range to somewhat differing degrees, but their relative magnitudes should hold at least generally. They suggest that nonshared environmental influences on age 17 GPA decreased with increasing IQ and that genetic influences on age 24 educational attainment increased with increasing IQ while shared environmental influences decreased.
The top part of Table 3 shows the model fit statistics determining the best-fitting version of the model estimating the extent to which IQ at age 11 moderated the genetic and environmental influences on GPA at age 17. To determine this model, we did not drop any of the six common and unique A, C, or E paths, but only the moderating terms on them. In the best-fitting model, IQ moderated only the nonshared environmental influences unique to GPA; the model including the relevant moderating path fit significantly better than the model with no moderating paths, and this model’s fit did not differ significantly from that of the model including all 6 moderating paths. The bottom part of Table 3 shows the model fit statistics determining the best-fitting version of the model estimating the extent to which IQ at age 17 moderated the genetic and environmental influences on educational attainment at age 24 following the same procedures as above. Here IQ moderated both the genetic influences unique to educational attainment and the shared environmental influences common to educational attainment and IQ; the model including the relevant paths fit significantly better than the model with no moderating paths, and this model’s fit did not differ significantly from that of the model including all 6 moderating paths.
Table 3.
Fit Statistics from the Models of Variance Components Allowing for Gene-Environment Interaction and Correlation
| Model | -2*LL | df | χ2 | Δdf | p | AIC |
|---|---|---|---|---|---|---|
| Grade Point Average at Age 17 as a Function of Age 11 IQ | ||||||
| All parameters free | 6540.9 | 4196 | --- | --- | --- | 6574.9 |
| Fix common A, C, & E, unique A and C moderation paths to 0* | 6545.4 | 4201 | 4.5 | 5 | ns | 6569.4 |
| Fix all moderation paths to 0 | 6569.5 | 4202 | 24.1 | 1 | <.001 | 6591.5 |
| Educational Attainment at Age 24 as a Function of Age 17 IQ | ||||||
| All parameters free | 5173.5 | 3340 | --- | --- | --- | 5207.5 |
| Fix common A and E, unique C and E moderation paths to 0* | 5174.1 | 3344 | .6 | 4 | ns | 5200.1 |
| Fix all moderation paths to 0 | 5183.8 | 3346 | 9.7 | 2 | .008 | 5205.8 |
Note: A refers to genetic influences, C to shared environmental influences, and E to nonshared environmental influences. There are possible common and unique moderation paths for each of A, C, and E. Best-fitting models are indicated by *. Fixed moderation paths were constrained to 0, which means that those sources of influence were present but did not vary across the levels of the moderators. AIC is Akaike Information Criterion.
The estimated components of variance, proportions of variance, and genetic and environmental correlations from the best-fitting models from Table 3 are given in Table 4, along with their 95% confidence intervals. The table is organized so that results from the younger cohort appear on the left side of the table and those from the older cohort on the right. At the top, we show the estimated genetic and environmental influences for IQ, the environmental moderating variable. The paths corresponding to these estimates are the ones shown in Figure 2 but not labeled. In the middle, we show the same kinds of estimates for GPA in the younger cohort and Educational Attainment in the older. These estimates were derived by summing the squared path coefficients from the common and unique sources of variance in GPA/Ed. Thus, the estimates for any one source of variance could differ across the range of IQ if either or both of the variance components common or unique to GPA/Ed were moderated by IQ. At the bottom, we show the genetic and environmental correlations between IQ and the relevant measures of GPA/Ed.
Table 4.
Estimates of Variance Components and Proportions of Variance in Study Educational Variables, and Their Genetic and Environmental Correlations with IQ
| -2 sd | 0 sd | 2 sd | -2 sd | 0 sd | 2 sd | |
|---|---|---|---|---|---|---|
| Primary Educational Phenotype | ||||||
| Grade Point Average at Age 17 | Educational Attainment at Age 24 | |||||
| Variance components | ||||||
| Genetic | .57 (.34,.83) |
.57 (.34,.83) |
.57 (.34,.83) |
.16 (.09,.26) |
.35 (.13,.61) |
.64 (.09,1.57) |
| Shared environmental | .21 (.00,.44) |
.21 (.00,.44) |
.21 (.00,.44) |
.96 (.79,1.13) |
.39 (.14,.61) |
.07 (.00,.68) |
| Nonshared environmental | .53 (.46,.60) |
.26 (.22,.30) |
.08 (.03,.26) |
.26 (.22,.31) |
.26 (.22,.31) |
.26 (.22,.31) |
| Proportions of variance | ||||||
| Genetic | .44 (.21,.70) |
.55 (.32,.81) |
.66 (.43,.92) |
.12 (.05,.22) |
.35 (.13,.61) |
.66 (.11,.95) |
| Shared environmental | .16 (-.05,.39) |
.20 (-.01,.43) |
.24 (.03,.47) |
.70 (.53,.87) |
.39 (.14,.61) |
.07 (.00,.68) |
| Nonshared environmental | .40 (.33,.47) |
.25 (.21,.29) |
.09 (.04,.27) |
.19 (.15,.24) |
.26 (.22,.31) |
.27 (.23,.32) |
| Correlations with IQ | ||||||
| Genetic | .62 (.35,.88) |
.62 (.35,.88) |
.62 (.35,.88) |
.57 (.31,.86) |
.38 (.12,.67) |
.28 (.02,.57) |
| Shared environmental | .12 (-1.00,1.00) |
.12 (-1.00,1.00) |
.12 (-1.00,1.00) |
1.00 (.00,1.00) |
1.00 (.00,1.00) |
1.00 (.00,1.00) |
| Nonshared environmental | .06 (-.04,.16) |
.09 (-.01,.19) |
.16 (.06,.26) |
.00 (-.13,.13) |
.00 (-.13,.13) |
.00 (-.13,.13) |
Note: The variance components are raw; they do not sum to 1.00. The proportions of variance sum to 1.00. 95% confidence intervals are given in parentheses. To the extent they hit bounds they are of course not precisely 95% confidence intervals.
The confidence intervals for the genetic and environmental correlations were wide. This was particularly true of the shared environmental correlations. The models have little power to specify these any of these correlations exactly (Carey & DiLalla, 1994), so this is typical for these kinds of correlations, especially when, as for the shared environmental correlations, they apply to very small components of variance. Consistent with results from other studies (Bouchard & McGue, 2003; Deary et al., 2006), genetic influence on IQ increased with age. This was primarily at the expense of shared environmental variance, but nonshared environmental variance decreased as well. At age 11, 58% of the variation in IQ was under genetic influence, with 19% under shared environmental influence. The remaining 23% was under nonshared environmental influence. At age 17, 73% of the variation in IQ was under genetic influence and only 7% was under shared environmental influence, with the remaining 20% under nonshared environmental influence.
As Table 5 shows, some of the genetic and environmental components of variance in GPA and educational attainment differed with level of IQ. For example, though genetic and shared environmental variance in GPA did not change across the range of IQ, GPA’s nonshared environmental variance decreased. This meant that, as proportions of variance, both genetic and shared environmental influences increased with increasing IQ. Though it is common in behavior genetic studies to work with proportions of variance, in this situation they tend to obscure the underlying processes involved. Thus Figure 3 shows the three raw components of variance in GPA at age 17 as functions of IQ at age 11. Because there was no significant moderation of genetic or shared environmental variance in GPA by IQ, these variance components of GPA were constant across level of IQ. Because there was significant moderation of nonshared environmental variance, its variance component of GPA did vary with IQ. Nonshared environmental variance was greater when IQ was low, and dropped off with increasing levels of IQ. Two standard deviations below mean IQ, nonshared environmental variance in GPA was about three times greater than at two standard deviations above mean IQ. Regardless of whether the greater nonshared environmental variance at low levels of IQ arose from greater measurement error in GPA at low levels of IQ or greater effects on GPA of environmental circumstances unique to each individual such as particular teachers or classroom experiences, the results suggested that GPA outcomes for participants with lower IQ’s were less systematic than those for participants with higher IQ’s. Table 5 shows the genetic and environmental correlations as well as the variance components. The genetic correlations were constant across the range of IQ because there were no moderating genetic effects of IQ. They were also significant and substantive at .62, suggesting that a genetic niche-picking process involving IQ predicted GPA. Both shared and nonshared environmental correlations were low and nonsignificant, indicating that there were no important environmental niche-picking processes involving IQ.
Figure 3.
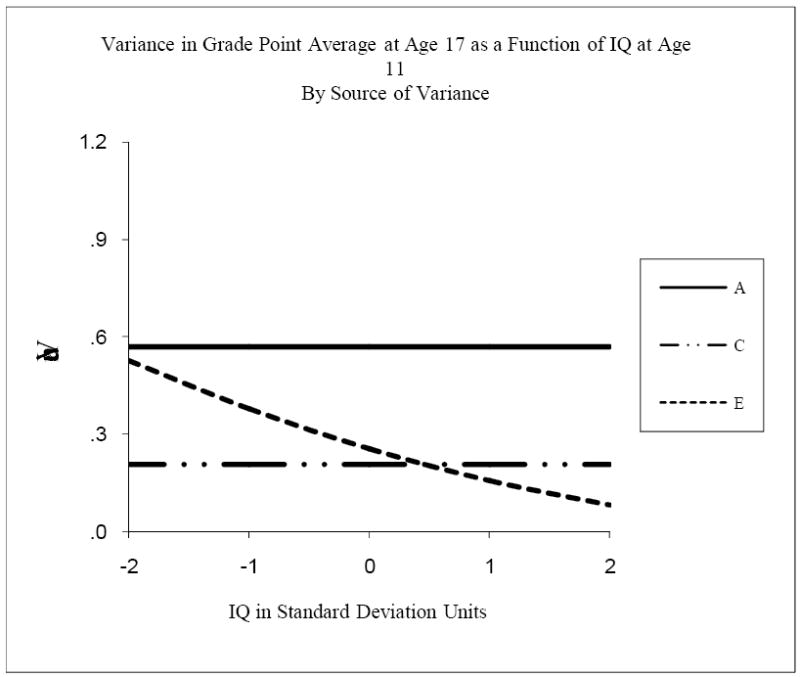
Variance in Grade Point Average at age 17 as a function of IQ at age 11, by source of variance. A refers to genetic variance, C to shared environmental variance, and E to nonshared environmental variance.
Figure 4 shows the three components of variance in educational attainment at age 24 as functions of IQ at age 17. It is directly analogous to Figure 3. The significant moderating effects in this model were somewhat complex. There was no significant moderation of nonshared environmental variance in educational attainment by IQ, so its variance component was fixed to be constant across the range of IQ. There were significant moderating effects of IQ on both the genetic and shared environmental variance components of educational attainment, however, so these variance components did vary with IQ. Genetic variance in educational attainment increased by a factor of four across the four standard deviation range of IQ, growing from .16 to .64. In contrast, shared environmental variance in educational attainment decreased by a factor of almost 14 across the same range. Thus there was a trade-off between the proportions of variance attributable to genetic and shared environmental influences across the range of IQ. At two standard deviations below mean IQ, 70% of the variance in educational attainment was due to shared environmental influences, and only 12% was due to genetic influences. At two standard deviations above mean IQ, these proportions had effectively reversed: 7% of the variance in educational attainment was due to shared environmental influences and 66% was due to genetic influences. Because total variance in educational attainment was somewhat greater when IQ was low, proportions of nonshared environmental variance also increased with increasing IQ, though absolute levels of nonshared environmental variance were constant throughout the range of IQ.
Figure 4.
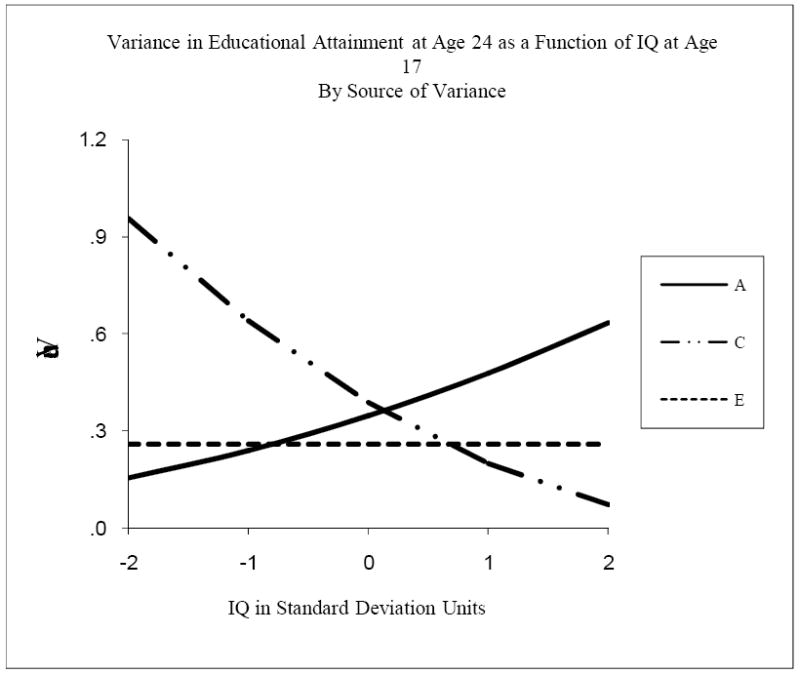
Variance in Educational Attainment at age 24 as a function of IQ at age 17, by source of variance. A refers to genetic variance, C to shared environmental variance, and E to nonshared environmental variance.
IQ moderated the genetic influences unique to educational attainment. Because the effect was positive, genetic variance unique to educational attainment increased with increasing IQ, so the genetic correlation between IQ and educational attainment fell with increasing IQ. This indicated that genetic niche-picking effects of IQ on educational attainment were strongest when IQ was low. These effects were, however, relatively unimportant when IQ was low, because genetic variance was relatively small. IQ moderated the shared environmental influences common to IQ and educational attainment and there were no shared environmental influences unique to educational attainment, so the shared environmental correlation between IQ and educational attainment was 1.00 throughout the range of IQ. This indicated that shared environmental niche-picking effects of IQ on educational attainment were strong throughout the range of IQ, but these effects were only relatively important at the low end of the IQ range where shared environmental variance was great. The nonshared environmental correlation was 0 throughout the range of IQ because there was no nonshared environmental variance common to IQ and educational attainment.
Discussion
In this study, we used new quantitative genetic methodology to explore some of the direct environmental effects and niche-picking processes linking educational performance and attainment with intelligence. We did this in order to provide information that should cause many using education and other multifactorial variables as statistical controls in psychological and other social science research to question the appropriateness of commonly used procedures and work to develop more rigorous approaches. To do so, we made use of two linked population-representative birth cohorts of twins. In the younger cohort, IQ was measured at age 11 and GPA at age 17. In the older cohort, IQ was measured at age 17 and educational attainment at age 24. In both cohorts, therefore, we examined the causal role played by IQ in the later manifestation of educational performance and attainment. We thus explicitly investigated the extent to which educational performance and attainment result from niche-picking processes involving IQ. Our specific results, which relate to a particular time and place, may not generalize to other situations. But the complexity they show should probably be considered typical and it is probably reasonable to think of them as at least generally applicable to a large proportion, though not necessarily all, of the United States population. Given their complexity, the lack of consistency in analytical treatment of education in psychological and other social science research and the often unstated assumptions about its role in these studies is understandable. The situation our results document was complex, but understanding and incorporating it and its variations over time and place into future research should improve our ability to understand the emergence of important psychological, physical, and behavioral life outcomes. We begin by discussing them in some detail and showing how they can be interpreted in terms of social forces. We then turn to discussion of the methodological implications of our results.
Genetic and Environmental Influences Linking IQ with GPA and Educational Attainment
We observed that nonshared environmental influences on GPA were greater when IQ was low, and that they fell across the range of increasing IQ. In contrast, genetic and shared environmental influences remained constant across the IQ range. The decreasing nonshared environmental influences across the range of increasing IQ indicated that, whether because of measurement error or because of the presence of other systematic but unmeasured variables, GPA was much more variable among those of low IQ than among those of high IQ. This could be the case if those of low IQ were much less accurate in reporting their GPA’s. It could also be the case if, for example, the school curriculum were structured so that those of high IQ could get good grades with relatively minimal effort while those of low IQ could not, so that individual differences in effort were more important to the grades of those of low IQ than to those of high IQ. Both situations are plausible, and there is no reason they, along with other analogous situations involving other personal characteristics, could not co-exist. The genetic correlation between IQ and GPA was both substantial and significant across the range of IQ, suggesting that the observed correlation of .40 between IQ at age 11 and GPA at age 17 was the result of a genetic niche-picking process. That is, the data indicated that genetic influences on individuals’ pre-existing levels of measured intelligence contributed importantly to levels of school performance in the last years of secondary education. Neither the shared nor the nonshared environmental correlation was substantive or significant, so there was no evidence for the involvement of environmental niche-picking processes.
For educational attainment, the situation was even more complex. Here both genetic and shared environmental influences on educational attainment varied with level of IQ while nonshared environmental influences remained constant. Shared environmental influences on educational attainment were much greater when IQ was low, and they fell sharply across the range of increasing IQ so that they were of little importance when IQ was two standard deviations above the mean. This indicated that family environmental background, likely including both parental emphasis on education and parental financial resources, was much more important to educational attainment when IQ was low than when it was high. It also indicated that family environmental background, probably most importantly lack of financial resources, rarely curtailed educational attainment for those of high IQ. In contrast, genetic influences on educational attainment were very slight when IQ was low, but increased to become of primary importance across the range of increasing IQ. This suggested that educational attainment was not strongly curtailed by genetic influences limiting IQ.
The genetic and environmental correlations between IQ and educational attainment reinforced these observations. The shared environmental correlation was 1.00 across the range of IQ. This indicated the existence of a shared environmental niche-picking process in which shared environmental influences on pre-existing IQ also acted to influence educational attainment. Shared environmental influences were so small when IQ was high, however, that this niche-picking process was of little importance when IQ was high. The genetic correlation was significant and moderate when IQ was low but, though it remained significant across the range of IQ, it decreased substantially so that it was small when IQ was high. This suggested the existence of some niche-picking process in which genetic influences on individuals’ pre-existing levels of IQ contributed to educational attainment, but the variance under genetic influence was so small in relation to the variance under shared environmental influence that this niche-picking process was also of little importance when IQ was low. The nonshared environmental correlation was 0 across the range of IQ.
We can summarize these results as follows. When pre-existing IQ was low, it was family environmental background that most heavily influenced educational attainment. That is, it is likely that those from families in which education was stressed and which had the financial resources to obtain higher education tended to do so, while those that came from families that did not stress education or that did not have the financial resources to pay for it did not obtain higher education. The correlation of .32 between age 17 IQ and educational attainment was explained primarily by this shared environmental niche-picking process, as fathers’ IQ and socioeconomic status were correlated about .40. When pre-existing IQ was high, genetic influences primarily on characteristics other than IQ influenced educational attainment, though a genetic niche-picking process played a small role as well, and served to explain a small portion of the correlation between age 17 IQ and educational attainment. Family environmental background was of little importance. Likely candidates for the characteristics whose genetic influences also contributed to genetic influences on educational attainment are personality and motivational traits such as conscientiousness, behavioral control, and achievement orientation. At average levels of IQ, genetic and both shared and nonshared environmental influences were all of relatively equal magnitudes. The shared environmental niche-picking process clearly dominated, but the genetic niche-picking process had some importance as well. At the same time, genetic influences on characteristics other than IQ were more important to educational attainment at average levels of IQ.
GPA and educational attainment are related phenotypes but they are not the same. Thus we should not expect the effects of IQ on their influences to be identical. In this case, they were actually quite consistent: as for educational attainment, heritability (or the proportion of variance attributable to genetic influence) of GPA increased with increasing IQ. Total environmentality (or the proportion of variance attributable to the sum of shared and nonshared environmental influences) decreased for both GPA and educational attainment, but IQ had its moderating effects on nonshared environmental influence on GPA and shared environmental influence on educational attainment. Given the parental tendency to equalize financial resources available to siblings for post-secondary education (Behrman et al., 1995) and the relative independence of GPA from such tendencies, the shift from moderating effects on shared to nonshared environmental influence made sense.
Limitations
This study is subject to some methodological limitations that should be taken into account when considering the significance and generalizability of the results. First, the sample is representative of the population born in Minnesota in the 1970’s and 1980’s, but it is primarily of European-American descent and thus should not be considered representative of the population of the United States as a whole, let alone other countries. In particular, Minnesota has consistently maintained one of the highest high school graduation rates in the United States, and college attendance rates tend to be higher than average there as well (Census, 1995). Moreover, it is becoming increasingly common for people to return for further education at ages well beyond the age 24 observation we had available here. Second, interaction effects of the kind we explored are often small and difficult to detect (Rowe, 2003). Though we did have power to identify several interactive effects, there may have been others (including possibly nonlinear effects) present that would have required larger sample sizes to detect. Moreover, using the chi-square test alone, it would be possible to conclude that all the moderating effects of IQ on educational attainment that we estimated could be constrained to 0. The AIC, however, which emphasizes model parsimony, showed quite clearly that the model we presented including the moderating effects provided a better description of the data.
Third, our data included both males and females, but we did not examine the data for possible gender differences in the associations we explored. In fact, we explicitly removed the effects of gender differences from the data before beginning our analyses. Future research should address the possibility of gender differences in this area. In addition, to piece together the developmental process linking educational performance at age 17 with educational attainment at age 24 from these results, it is necessary to assume that the social forces impacting the two cohorts providing data for this study were the same. As the two cohorts were born in the same metropolitan area and were separated by less than 10 years, this assumption is probably not unreasonable. Moreover, the fact that there were no differences in genetic and environmental influences on and correlations between IQ and GPA both measured at age 17 in the two cohorts (Δχ2=14.6, ns) provided some empirical evidence that this was the case as these statistics are population-dependent (Burton, Bowden, & Tobin (2007).
Finally, though the statistical significance of our findings was clear in this sample, moderation effects such as those we observed may be very dependent on both scale properties and environmental context. That is, different ways of measuring school achievement from GPA and different way of scaling educational attainment, as well as different ways of measuring intelligence such as latent variable representations may have different distributional properties that could lead to different moderation effects than those we observed. Of more likely substantive importance, however, cohorts reaching maturity in different places and at different times may show very different moderation effects or no moderation effects at all. Should this be the case, it would not mean that the effects observed here did not exist or were not important to those involved.
Integrating Our Results at Ages 17 and 24
The genetic and environmental processes indicated by our results with respect to GPA at age 17 were completely different from those indicated by our results with respect to Ed. There is actually little reason to expect that they might be the same. At age 17, most adolescents in our sample remained in school, but by age 19 school attendance was much more variable, both in presence or absence or attendance and type of program attended. Moreover, free schooling was available through about age 18 for most youth, but after that availability of financial resources played a major role in the ability to remain in school and the type of schooling obtained. Our results suggested that, when the school environment was relatively constant, genetic influences on and niche-picking within that environment were the main factors involved in performance within that environment. When the schooling environment was more variable, however, the transactions among genetic and environmental influences and their relative importance were more variable as well. This is consistent with a large volume of population genetic research with non-human animals and plants: in constant environments, individual differences tend to result from genetic influences, but in varying environments individual differences have more varied origins. This is especially true when individuals have some ability to control the environments they experience. One implication of this is that, within relatively consistent post-high school environments, such as among university attendees, achievement levels such as GPA, level of degree attainment, and intention to pursue post-graduate education may show associations with IQ that are very similar to those for GPA at age 17.
Another factor that likely contributed to the differences in the processes we observed is that educational achievement as measured by either grades or test scores while adolescents are still in similar educational environments is not the same as later educational attainment. School grades and test scores are, by their very nature, highly individual measures that can be considered theoretically as well as practically continuous. In contrast, though the educational degrees that form the basis of educational attainment are of course awarded individually, parents tend to work to equalize the educational opportunities available to their offspring (Behrman, Pollack, & Taubman, 1995). This helps to explain the greater importance of shared environmental influences on educational attainment than on GPA. Moreover, two offspring from the same family can differ considerably in the grades and test scores they produce in high school, yet both may end up graduating from college, especially if the parents provide financial and psychological support for college graduation. The difference in their high school-level performance may end up being reflected not in their educational attainment, but in the colleges they attend and the grades they earn in college.
This difference in genetic and environmental processes across what might be considered the developmental milestone of high school graduation and the transition to adulthood highlights an important point about the associations we observed. It is possible that they were specific to the samples’ timing in history and geographic location, but it is much more certain that they were specific to the samples’ positions in lifespan development. The associations among educational attainment, cognitive function, and other associated outcomes later in the lifespan may arise through quite different genetic and environmental transactions.
Conclusion and Future Directions
Understanding the way in which education and intelligence are associated has long challenged psychologists, economists, epidemiologists, and other social scientists. In this study, we made use of newly available methodology to explore their association in a way that should help to build understanding of its causal paths. Despite some limitations in our study’s ability to generalize to the whole population of the United States and the broader world, its results outline the subtlety of the interrelations involved in the association between education and intelligence and shed light on the reasons that understanding it has proven so challenging. Future research in this area should examine the extent to which the results from this study generalize to other environments and populations of similar age, and how these results may vary with development across the lifespan.
Acknowledgments
This research was supported by US Public Health Service Grants #AA00175, DA 13240, and DA 05147. Wendy Johnson holds a Research Council of the United Kingdom Fellowship. Wendy Johnson holds a RCUK Fellowship. She and Ian Deary are members of the MRC Centre for Cognitive Ageing and Cognitive Epidemiology, which is supported by the BBSRC, EPSRC, and MRC as part of the cross-council Health and Well-being Initiative. We thank the twins and their families and the recruiting, interviewing, data management, and lab staffs of the Minnesota Twin Family Study.
Footnotes
This model estimates means but not moderation of means. Moderation of means is completely confounded with moderation of genetic influences common to intelligence and education, so it is possible only to estimate one of them at a time. When moderation of means is estimated, then the variance common to intelligence and education cannot be decomposed. As we were primarily interested in the effects of intelligence on variance in education, the approach we took was preferable. It is of course possible that moderation could take other forms besides the linear, but the linear approach is a straightforward and powerful first approximation to most of the other possible forms.
The spousal correlation of .34 for IQ accounted for 12% of the variance, of which 60%, or 7% in total, could be considered genetic. The spousal correlation of .57 for educational attainment accounted for 32% of the variance, of which 35%, or 18% in total, could be considered genetic. In round figures and because earlier measured IQ contributes to education, this averages to about 10% additional genetic variance beyond the 50% usually assumed in quantitative genetic models for DZ twins. We implemented the 60% directly in the model.
References
- Akaike H. Information measures and model selection. Bulletin of the International Statistical Institute. 1983;50:277–290. [Google Scholar]
- Baltes P, Reinert G. Cohort effects in cognitive development in children as revealed by cross-sectional sequences. Developmental Psychology. 1969;1:169–177. [Google Scholar]
- Bartels M, Rietveld MJH, Van Baal GCM, Boomsma DI. Heritability of educational achievement in 12-year-olds and the overlap with cognitive ability. Twin Research. 2002;5:544–553. doi: 10.1375/136905202762342017. [DOI] [PubMed] [Google Scholar]
- Behrman JR, Pollak RA, Taubman P. Parental preferences and provision for progeny. In: Behrman JR, Pollak Ra, Taubman P, editors. From parent to child: Intrahousehold allocations and intergenerational relations in the United States. Chicago: University of Chicago Press; 1995. pp. 23–42. [Google Scholar]
- Bouchard TJ., Jr . Twins reared together: What they tell us about human diversity. In: Fox SF, editor. Individuality and Determinism. New York: Plenum Publishing Corp; 1984. [Google Scholar]
- Bouchard TJ, Jr, McGue M. Familial studies of intelligence: A review. Science. 1981;212:1055–1059. doi: 10.1126/science.7195071. [DOI] [PubMed] [Google Scholar]
- Bouchard TJ, Jr, McGue M. Genetic and environmental influences on human psychological differences. Journal of Neurobiology. 2003;54:4–45. doi: 10.1002/neu.10160. [DOI] [PubMed] [Google Scholar]
- Burton PR, Bowden JM, Tobin MD. Epidemiology and genetic epidemiology. In: Balding DJ, Balding MB, Cannings C, editors. Handbook of Statistical Genetics. 3. Chichester, England: Jhn Wiley & Sons, Ltd; 2007. [Google Scholar]
- Carey G, DiLalla DL. Personality and psychopathology: genetic perspectives. Journal of Abnormal Psychology. 1994;103:32–43. doi: 10.1037//0021-843x.103.1.32. [DOI] [PubMed] [Google Scholar]
- Census, Bureau of. Current Population Survey (10/00) Washington, DC: United States Bureau of Labor Statistics; 2000. [Google Scholar]
- Deary IJ, Spinath F, Bates TC. Genetics of intelligence. European Journal of Human Genetics. 2006;14:690–700. doi: 10.1038/sj.ejhg.5201588. [DOI] [PubMed] [Google Scholar]
- Deary IJ, Strand S, Smith P, Fernandes C. Intelligence and educational achievement. Intelligence. 2007;35:13–21. [Google Scholar]
- Deary IJ, Whiteman MC, Starr JM, Whalley LJ, Fox HC. The impact of childhood intelligence on later life: following up the Scottish Mental surveys of 1932 and 1947. Journal of Personality and Social Psychology. 2004;86:130–147. doi: 10.1037/0022-3514.86.1.130. [DOI] [PubMed] [Google Scholar]
- Falconer DS, Mackay TFC. Introduction to Quantitative Genetics. 4. Harlow, England: Prentice-Hall; 1996. [Google Scholar]
- Hollingshead AB. Two factor index of social position. New Haven, CN: August B Hollingshead; 1957. [Google Scholar]
- Iacono WG, Carlson SG, Taylor J, Elkins IJ, Mcgue M. Behavioral disinhibition and the development of substance use disorders. Development and Psychopathology. 1999;11:869–900. doi: 10.1017/s0954579499002369. [DOI] [PubMed] [Google Scholar]
- Jencks C. Who gets ahead?: The determinants of economic success in America. New York, NY: Basic Books; 1979. [Google Scholar]
- Johnson W. Genetic and environmental influences on behavior: capturing all the interplay. Psychological Review. 2007;114:423–440. doi: 10.1037/0033-295X.114.2.423. [DOI] [PubMed] [Google Scholar]
- Johnson W. Beyond conscientiousness: A personality perspective on the widening sex difference in school performance. European Journal of Personality. 2008;122:163–166. [Google Scholar]
- Johnson W, McGue M, Iacono WG. Disruptive behavior and school grades: genetic and environmental relations in 11-year-olds. Journal of Educational Psychology. 2005;97:391–405. [Google Scholar]
- Johnson W, McGue M, Iacono WG. Genetic and environmental influences on academic achievement trajectories during adolescence. Developmental Psychology. 2006;42:514–532. doi: 10.1037/0012-1649.42.3.514. [DOI] [PubMed] [Google Scholar]
- Kemp L. Environmental and other characteristics determining attainments in primary schools. British Journal of Educational Psychology. 1955;25:67–77. [Google Scholar]
- Little RJA, Rubin DB. Statistical Analysis with Missing Data. New York: Wiley; 1987. [Google Scholar]
- Neale MC, Boker S, Xie G, Maes HH. Mx: Statistical Modeling. Richmond VA: Medical College of Virginia, Department of Psychiatry; 1999. [Google Scholar]
- Plomin R, Spinath F. Intelligence: genetics, genes, and genomics. Journal of Personality and Social Psychology. 2004;86:112–129. doi: 10.1037/0022-3514.86.1.112. [DOI] [PubMed] [Google Scholar]
- Purcell S. Variance component models for gene-environment interaction in twin analysis. Twin Research. 2002;5(6):554–571. doi: 10.1375/136905202762342026. [DOI] [PubMed] [Google Scholar]
- Rowe DC. Assessing genotype-environmental interactions and correlations in the post-genomic era. In: Plomin R, DeFries JC, Craig IW, editors. Behavioral Genetics in the Post-Genomic Era. Washington, DC: American Psychological Association; 2003. pp. 71–99. [Google Scholar]
- Schmidt WHO. Socio-economic status, schooling, intelligence, and scholastic progress in a community in which education is not yet compulsory. Paedogogica Europa. 1967;2:275–286. [Google Scholar]
- Sherman M, Key CB. The intelligence of isolated mountain children. Child Development. 1932;3:279–290. [Google Scholar]
- Turkheimer E, Haley A, Waldron M, D’Onofrio B, Gottesman II. Socioeconomic status modifies heritability of IQ in young children. Psychological Science. 2003;14:623–628. doi: 10.1046/j.0956-7976.2003.psci_1475.x. [DOI] [PubMed] [Google Scholar]
- Vandenberg SG. Assortative mating, or who marries whom. Behavior Genetics. 1972;2:127–157. doi: 10.1007/BF01065686. [DOI] [PubMed] [Google Scholar]
- Wechsler D. Manual for the Wechsler Instelligence Scale for Children - Revised. New York: Psychological Corporation; 1974. [Google Scholar]
- Wechsler D. Manual for the Wechsler Adult Intelligence Scale - Revised. San Antonio, TX: Psychological Corporation; 1981. [Google Scholar]
- Wiseman S. Environmental and innate factors and educational attainment. In: Meade J, Parks AS, editors. Genetic and Environmental Factors in Human Ability. London: Oliver and Boyd; 1966. pp. 64–79. [Google Scholar]