Abstract
Context: Primary hyperparathyroidism, which occurs most commonly in patients with adenomatous disease of a single parathyroid gland, arises as a result of impaired extracellular Ca2+ (Ca2+o)-dependent feedback on PTH secretion, a process mediated by the calcium-sensing receptor (CaR).
Objective: Because the Ca2+o sensitivity of the CaR is positively modulated by l-amino acids, we decided to investigate whether the impaired feedback of PTH secretion in adenomatous parathyroid cells might arise from decreased sensitivity to l-amino acids.
Design: Samples of normal and adenomatous human parathyroid cells were prepared by collagenase treatment and then exposed in vitro to various concentrations of Ca2+o or the CaR-active amino acid, l-phenylalanine (l-Phe).
Setting and Patients: Excess normal parathyroid tissue was obtained from parathyroid autotransplants at the time of thyroid surgery. Samples of adenomatous tissue were obtained from histologically confirmed parathyroid adenomas.
Main Outcome Measures: The primary measure was sensitivity of Ca2+o-dependent PTH secretion to the amino acid l-Phe. The secondary measure was sensitivity of Ca2+o-dependent intracellular Ca2+ mobilization to l-Phe.
Results: Parathyroid adenomas exhibited reduced sensitivity to the CaR-active amino acid l-Phe, which affected both Ca2+o-dependent PTH secretion and Ca2+o-dependent intracellular Ca2+ mobilization as a measure of CaR-dependent signaling in parathyroid cells.
Conclusions: Impaired l-amino acid sensing by calcium-sensing receptors in adenomatous parathyroid cells contributes to the loss of feedback control of PTH secretion in primary hyperparathyroidism. The CaR’s amino acid binding site may be exploited as a target in the medical treatment of primary and perhaps other forms of hyperparathyroidism.
Impaired l-amino acid sensing by calcium-sensing receptors in adenomatous parathyroid cells contributes to the loss of feedback control of PTH secretion in primary hyperparathyroidism.
Feedback control of PTH secretion by extracellular Ca2+ (Ca2+o) is mediated by expression of the extracellular Ca2+-sensing receptor (CaR), a class C G-protein coupled receptor, in parathyroid chief cells (for review, see Ref. 1). Elevations in Ca2+o activate the receptor, thereby engaging an intracellular signaling mechanism that suppresses PTH secretion.
In addition to Ca2+o, the CaR is activated by various other biochemical species, including the multivalent cations, Mg2+, and spermine, which like Ca2+, are receptor agonists. We previously demonstrated that the CaR is also activated by various l-amino acids (2). Amino acids enhance the Ca2+o sensitivity of intracellular Ca2+mobilization and inhibitory control of PTH secretion (3). These results indicate that physiological levels of amino acids may be required for the normal function of the CaR and that elevated serum amino acid levels, e.g. following a protein-rich meal, may further tighten CaR-dependent control of PTH secretion (for review, see Ref. 4) and potentially promote the effects of CaRs on other physiological responses in the gut (for review, see Ref. 5) and kidney.
Primary hyperparathyroidism arises from impaired Ca2+o-dependent feedback control of PTH secretion, and reduced CaR expression in adenomatous parathyroid cells is a recognized feature of the disorder (6). Given the significance of amino acids for modulating the sensitivity of the CaR to Ca2+o, we hypothesized that amino acid-dependent regulation of CaR signaling and PTH secretion might be impaired in adenomatous human parathyroid cells. In the current work, we have investigated the Ca2+o and amino acid sensitivities of cells prepared from samples of normal and adenomatous human parathyroid tissue. The data indicate that both Ca2+o and amino acid sensitivities are impaired in adenomatous cells and suggest that reduced amino acid sensitivity contributes to the dysregulation of the feedback-dependent control of PTH secretion by Ca2+o in primary hyperparathyroidism.
Materials and Methods
Parathyroid tissue samples
Samples from normal parathyroid cell transplants and excised parathyroid adenomas were obtained at neck surgery at the Royal North Shore Hospital and North Shore Private Hospital, St. Leonards, New South Wales, and the Mater Misericordiae Hospital, North Sydney, New South Wales, Australia. Excess normal parathyroid tissue (around 5% of the total), typically taking the form of single 1- to 1.5-mm diameter “chips,” was obtained from parathyroid autotransplants during thyroid surgery as described previously (3). Adenomatous tissue was obtained from histologically confirmed parathyroid adenomas removed from patients with primary hyperparathyroidism. All procedures were performed under guidelines established by the relevant institutional ethics committees, and all patients provided written informed consent for the use of the tissue for experimental purposes. A total of 23 normal parathyroid samples obtained from 23 thyroid patients and a total of 31 adenomatous samples obtained from 31 patients with primary hyperparathyroidism were studied in the current experiments. Due to limited tissue sample size, only subsets (n = 4 to 8) of the total number of tissue samples collected could be studied in each of the experiments described below. In all cases, individual experiments were performed on independent tissue samples, and the data were combined as required for curve-fitting and statistical analysis.
Preparation of human parathyroid cells
The parathyroid tissue was transported to the laboratory in MEM that contained CaCl2 1.25 mm. It was either used immediately or, more typically, stored overnight at 4 C. For digestion, it was transferred to MEM that contained 1 mg/ml collagenase (Worthington type-I) and 0.1 mg/ml DNase I (Sigma type IV). The suspension was briefly oxygenated and then incubated at 37 C. After 20 min, the enzyme solution was decanted, and the parathyroid tissue was transferred into 5 ml of MEM that contained 1 mg/ml of BSA. The tissue was then triturated by repeated passage (10–15 times) through the tip of a disposable 5-ml syringe (no needle attached). The cloudy suspension containing clumps of parathyroid cells was passed through a 200-μm pore-size nylon filter and then sedimented (70 g, 2.5 min). The cell pellet was gently resuspended and washed twice with 5 ml of BSA-containing MEM. It was finally resuspended in 2 ml BSA-containing MEM. The remaining pieces of undigested parathyroid tissue were returned to medium containing collagenase and DNase I and incubated for a further 20 min at 37 C. The enzyme solution was then decanted, and the parathyroid tissue was subjected to trituration and centrifugal isolation as above.
Determination of PTH secretion from perifused human parathyroid cells
Perifusion of normal and adenomatous parathyroid cells was undertaken in low molecular mass (4–5 kDa) cutoff gel filtration micro beads so that intact PTH (∼9.5 kDa) would appear in the void volume. Gel filtration media were preequilibrated with physiological saline: 125 mm NaCl, 4.0 mm KCl, 1.25 mm CaCl2, 1.0 mm MgCl2, 0.8 mm NaH2PO4, 20 mm HEPES (NaOH), 0.1% d-glucose (pH 7.4) that contained 1X basal amino acid mixture (see Amino acid solutions), and 1 mg/ml BSA. Then 40,000–100,000 cells were loaded onto the surface of a 0.4-ml bed volume of Bio-gel P-4 (nominal exclusion limit, 4 kDa) and gently covered with a 0.4-ml bead volume of Sephadex G-25 (nominal exclusion limit, 5 kDa) in a small perifusion column. After tubing connections were established downstream to a peristaltic pump and up-stream to a reservoir, the column was suspended in a water bath (37 C) and perifused at 1.5 ml/min with 37 C equilibrated control physiological saline that contained the 1-fold l-amino acid mixture (total concentration 2.8 mm; see below) and 1 mg/ml BSA (3). Routinely, 2-min (i.e. 3 ml) samples were collected into tubes immersed in an ice bath, and the tubes were transferred to dry ice upon completion of each collection period. As required, solutions were changed to permit variations in Ca2+o and amino acid concentration. All samples were stored at −80 C until analysis of intact human PTH (1–84) by a third generation, two-site chemiluminescence assay on an Immulite 2000 autoanalyzer. For estimates of steady-state levels of PTH secretion used in the Ca2+o concentration-PTH secretion analysis, the sample from the first 2 min of each treatment period, during which the cells were reequilibrating to a change in either Ca2+o or l-phenylalanine (l-Phe) concentration, was routinely ignored so that the means of the second and third samples were used for plotting the concentration-response data and performing curve-fit analysis.
Amino acid solutions
Stock amino acid-containing solutions were routinely made up in physiological saline at 50 or 100 mm and stored at −20 C. They were thawed and diluted in amino acid-free physiological saline as required. The composition of the 1X basal l-amino acid solution that emulated fasting human plasma was as follows (in μm): 50 Phe, 50 Trp, 80 His, 60 Tyr, 30 Cys, 300 Ala, 200 Thr, 50 Asn, 600 Gln, 125 Ser, 30 Glu, 250 Gly, 180 Pro, 250 Val, 30 Met, 10 Asp, 200 Lys, 100 Arg, 75 Ile, and 150 Leu, as described previously (2).
Microfluorimetry for determining cytoplasmic Ca2+ concentrations
Normal and adenomatous parathyroid cells were loaded with 1 μm fura-2 AM for 20 min at 37 C in MEM containing BSA 1 mg/ml. The cells were then sedimented (70 g, 2.5 min) and resuspended in albumin-free physiological saline solution (see above). Fura-2-loaded cells were transferred into a superfusion chamber, placed in the light path of a Zeiss Axiovert fluorescence microscope (Carl Zeiss, North Ryde, NSW, Australia), and perifused with inorganic phosphate-free physiological saline solutions that were modified to contain various concentrations of Ca2+o and l-Phe. The control physiological saline used in all microfluorimetry experiments had the following composition: 125 mm NaCl, 4.0 mm KCl, 0.2 mm CaCl2, 1.0 mm MgCl2, 20 mm HEPES (NaOH), and 0.1% d-glucose (pH 7.4).
A Lambda DG-4 Xenon light source (Sutter Instrument Co., Novato, CA) was programmed to alternate between two excitation wavelengths (340 and 380 nm) at a frequency of 1 s−1. Areas of interest were selected and then digital images were captured and downloaded using a high resolution AxioCam camera (Carl Zeiss) controlled by Stallion SB.4.1.0 PC software (Carl Zeiss). Fura-2-loaded cells were imaged at 510 nm. Estimates of cytoplasmic free Ca2+ concentration were obtained using a calibration procedure as described previously (7).
Statistical analysis and curve fitting
The Ca2+ mobilization data were expressed as concentration-response curves and fitted to the following form of the Hill equation: R = b + (a − b) Cn/(en+Cn), where R = response, a = maximum response, b = basal response, C = Ca2+o concentration (in mm), e = EC50 (the Ca2+o concentration that induced a half-maximal response), and n = Hill coefficient. The PTH secretion data were fitted to the following equation: S = a − (a − b) Cn/(in+Cn), where S = secretory response, a = maximum secretory response, b = basal secretory response, C = Ca2+o concentration (in mm), i = IC50 (the Ca2+o concentration that yielded half-maximal inhibition), and n = Hill coefficient.
The data have been expressed routinely as means ± sem (number of independent experiments). As described above, the first of three data points, corresponding to a short equilibration period, was routinely ignored when calculating the mean PTH secretion rate for any given treatment. Samples of parathyroid tissue were tested no more than once in each series of experiments. In consequence, the number of patient samples tested and the number of experiments was the same throughout the study. Statistical comparisons between treatments within PTH secretion data-sets were performed using Student’s paired t test (two-tailed) in SPPS Statistics 17 for Macintosh (SPSS Inc., Chicago, IL). The statistical significance of the differences in curve-fitting parameters was determined using the F-test as described in (8). Statistically significant comparisons were accepted at P < 0.05.
Results
Characteristics of PTH secretion from perifused normal and adenomatous parathyroid cells
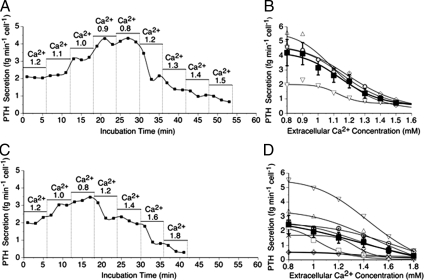
After preparation using collagenase as described in Materials and Methods, normal and adenomatous parathyroid cells were perifused with physiological saline solution that contained 1 mg/ml BSA and various Ca2+o concentrations. The initial Ca2+o concentration was 1.2 mm in all experiments. PTH was released in a Ca2+o-sensitive manner (Fig. 1). Lowering the ionized Ca2+ concentration from 1.2 to 0.8 mm in two or more steps resulted in progressive increases in PTH secretion in both normal and adenomatous parathyroid cells that promptly returned to control rates upon return to the control Ca2+o concentration, 1.2 mm (Fig. 1, A and C). Subsequently, raising the Ca2+o concentration from 1.2 to 1.5 or 1.8 in normal and adenomatous cells, respectively, resulted in a progressive suppression of PTH secretion.
Figure 1.
Impact of Ca2+o on intact PTH secretion from normal and adenomatous parathyroid cells. Representative time-courses demonstrate the impact of progressive decreases and then increases in Ca2+o concentration (in mM) on PTH secretion from normal (A) and adenomatous (C) parathyroid cells. The Ca2+o concentration dependence of PTH secretion is shown for individual experiments for normal (B) and adenomatous (D) parathyroid cells obtained from four patients who underwent thyroid surgery and eight patients with adenomatous disease, respectively, is also shown. The filled symbols and error bars represent means ± sem for pooled data.
In normal parathyroid cells, the maximum PTH secretion rate estimated by curve-fitting analysis was 4.2 ± 0.2 fg · min−1 · cell−1, the minimum PTH secretion rate was 0.9 ± 0.2 fg · min−1 · cell−1 and the IC50 for Ca2+o was 1.12 ± 0.04 mm (n = 4; Fig. 1B). In adenomatous cells, however, the maximum PTH secretion rate estimated by curve-fitting analysis was 2.3 ± 0.2 fg · min−1 · cell−1 (n = 8; Fig. 1D) and the minimum PTH secretion rate was 0.5 ± 0.3 fg · min−1 · cell−1. Both of these results for adenomatous cells were significantly different from normal cells (F(1, 180) = 142; P < 0.0001; F(1, 180) = 4.3; P = 0.04, respectively). In addition, the IC50 for Ca2+o was 1.3 ± 0.1 mm in adenomatous cells, which was significantly elevated when compared with normal (F(1, 180) = 18.2; P < 0.0001), consistent with the concept that adenomatous cells have reduced Ca2+o sensitivity.
Impact of l-Phe on PTH secretion from normal and adenomatous parathyroid cells
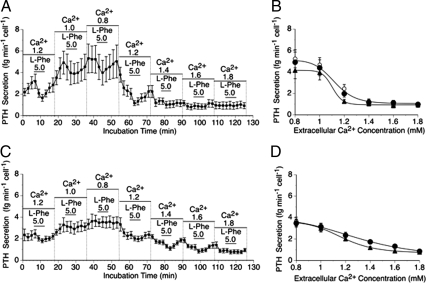
Normal and adenomatous parathyroid cells were then exposed to Ca2+o concentrations between 0.8 and 1.8 mm to further characterize the differences in Ca2+o sensitivity and to determine whether there might be differences in sensitivity to the CaR-active amino acid, l-Phe (Fig. 2). In five independent experiments on normal cells, exposure to 5 mm l-Phe resulted in an acute and reversible suppression of PTH secretion in the Ca2+o concentration range 0.8–1.4 mm (Fig. 2A) as observed previously (3), and statistical testing using the paired t test demonstrated that the differences were significant in all cases (P = 0.003 to 0.046). However, there was no effect at Ca2+o concentrations of 1.6 or 1.8 mm (P = 0.66 and 0.92, respectively; n = 5). Under control conditions, the IC50 for Ca2+o was 1.16 ± 0.03 mm in normal cells, and in the presence of 5 mm l-Phe it fell to 1.10 ± 0.04 mm (Fig. 2B; F(1, 136) = 4.03; P = 0.047). Upon return to the control solution, the IC50 for Ca2+o rose to 1.18 ± 0.04 mm (Fig. 2B; F(1, 136) = 6.53; P = 0.012).
Figure 2.
The impact of l-Phe on Ca2+o-regulated intact PTH secretion from normal and adenomatous parathyroid cells. The time-course profiles demonstrate the acute impact of 5 mm l-Phe on PTH secretion in the presence of various Ca2+o concentrations (in mM) from normal (A) and adenomatous (C) parathyroid cells. These data were used to express PTH secretion as a function of Ca2+o concentration in the absence and presence of 5 mm l-Phe from normal (B) and adenomatous (D) parathyroid cells as described in Materials and Methods. The experiments were performed on independent parathyroid cell preparations from five patients who underwent thyroid surgery and six patients with adenomatous disease, respectively. In B and D, the symbols are: ○, pre-Phe controls; •, post-Phe controls; ▴, 5 mm l-Phe. In some cases (especially in panel D), the pre- and post-control symbols are entirely overlapping. Due to the close similarity between the pre-Phe and post-Phe control data-sets, single curves were fitted to the combined data for these data-sets in panels B and D.
Interestingly, unlike normal cells, there was little or no sensitivity of adenomatous cells to l-Phe at Ca2+o concentrations of 0.8 and 1.0 mm (P = 0.37 and 0.58, respectively) in six independent experiments. However, acute and reversible suppressions of PTH secretion were observed at higher Ca2+o concentrations between 1.2 and 1.6 mm (paired t test; P = 0.0001 to 0.046; n = 6; Fig. 2C). Under control conditions, the IC50 for Ca2+o was 1.27 ± 0.04 mm in adenomatous cells, and in the presence of 5 mm l-Phe it fell to 1.18 ± 0.03 mm (Fig. 2D; F(1, 164) = 13.1; P = 0.0004). Upon return to the control solution, the IC50 for Ca2+o rose to 1.27 ± 0.03 mm (Fig. 2D; F(1, 164) = 12.2; P = 0.001).
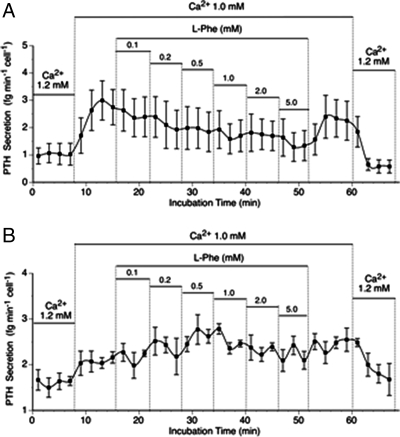
The concentration dependence of l-Phe-induced suppression of PTH secretion was investigated in the presence of 1.0 mm Ca2+o in both normal and adenomatous parathyroid cells (Fig. 3). Normal cells exhibited marked concentration-dependent inhibition of PTH secretion at a Ca2+o concentration of 1.0 mm (Fig. 3A). Under these conditions, the IC50 for l-Phe was 0.25 ± 0.09 mm (n = 4), and the maximum level of inhibition was around 40% (data not shown). As noted above, however, adenomatous cells exhibited no sensitivity to l-Phe under these conditions (n = 4; Fig. 3B).
Figure 3.
The impact of l-Phe on intact PTH secretion from normal and adenomatous parathyroid cells. The panels demonstrate the effects of step-wise increases in l-Phe concentration for normal (A) and adenomatous (B) parathyroid cells at a Ca2+o concentration of 1.0 mm. The data (means ± sem) were obtained from four patients who underwent thyroid surgery and four patients with primary hyperparathyroidism due to adenomatous disease, respectively.
The impact of l-Phe on Ca2+o-induced mobilization of intracellular Ca2+ in normal and adenomatous parathyroid cells
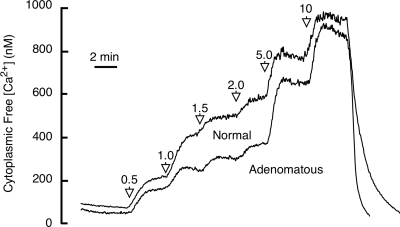
To further characterize the relative sensitivities of normal and adenomatous parathyroid cells to amino acids, we investigated the impact of l-Phe on CaR-dependent signaling as determined by Ca2+o-dependent intracellular Ca2+ mobilization. First, we compared the Ca2+o-sensitivity of intracellular Ca2+ mobilization in fura-2 loaded normal and adenomatous parathyroid cells. Although the maximum responses were similar, we noted that there was decreased sensitivity to Ca2+o in the concentration range 1.0–5.0 mm in adenomatous cells. At a Ca2+o concentration of 1.5 mm, for example, the cytoplasmic free Ca2+ concentration was 511 ± 156 nm (n = 4) in normal cells and 315 ± 77 nm (n = 5) in adenomatous cells (Fig. 4).
Figure 4.
Effects of stepwise increases in Ca2+o concentration on cytoplasmic free Ca2+ concentration from normal and adenomatous parathyroid cells in the absence of amino acids. Collagenase digested cells were loaded with fura-2 and perifused with physiological saline solutions containing various Ca2+o concentrations (in mM), and calibrated microfluorimetry data were collected for single cells as described in Materials and Methods. The data are presented as time-averaged traces for 40 normal parathyroid cells obtained in four experiments (four subjects who underwent thyroid surgery) and 50 adenomatous parathyroid cells obtained in five experiments (five subjects with primary hyperparathyroidism who underwent parathyroidectomy for adenomatous disease). Ca2+o was 0.2 mM at the start and end of these experiments.
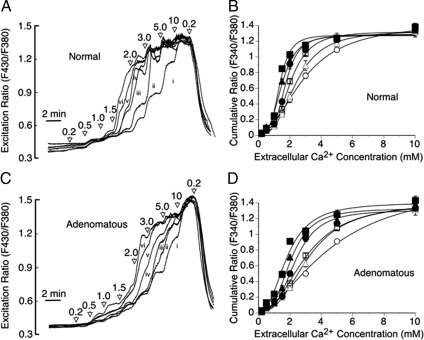
We next investigated the impact of l-Phe on the Ca2+o sensitivities of normal and adenomatous parathyroid cells. l-Phe left-shifted the concentration response curves for Ca2+o-induced intracellular Ca2+ mobilization in normal parathyroid cells as described previously (3). In the absence of amino acids, the EC50 for Ca2+o was 2.9 ± 0.2 mm (n = 6). In the presence of 0.1–10 mm l-Phe, however, the EC50 values for Ca2+o fell progressively to 2.4 ± 0.1 mm at 0.1 mm, 1.8 ± 0.1 mm at 1.0 mm, and 1.3 ± 0.1 mm at 10 mm l-Phe (n = 6; Fig. 5, A and B).
Figure 5.
Effect of l-Phe on Ca2+-dependent intracellular Ca2+ mobilization from normal and adenomatous parathyroid cells. The effect of stepwise increments in Ca2+o (from 0.2 to 10 mm) in the absence (i) or presence of 0.1 (ii), 0.3 (iii), 1.0 (iv), 3.0 (v) and 10 mm (vi) l-Phe are shown for fura-2 loaded normal (A) and adenomatous (C) parathyroid cells together with the impact of variations in l-Phe concentration on the Ca2+o concentration dependence of intracellular Ca2+ mobilization from normal (B) and adenomatous (D) parathyroid cells. The data have been corrected for baseline. The symbols are: ○, control; ▵, 0.1 mm l-Phe; □, 0.3 mm l-Phe; •, 1.0 mm l-Phe; ▴, 3.0 mm l-Phe; and ▪, 10 mm l-Phe. The results were obtained from experiments performed on six normal and eight adenomatous preparations, respectively. The traces in panels A and C represent means derived from 60 and 80 single cells per concentration of l-Phe tested, respectively.
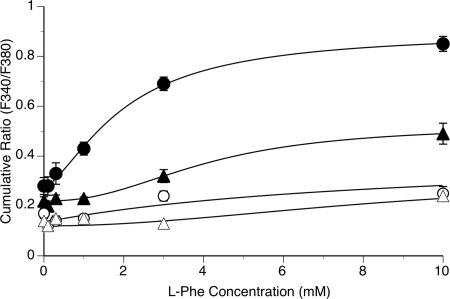
In the absence or presence of amino acids, adenomatous cells were clearly less sensitive to Ca2+o-induced intracellular Ca2+ mobilization than normal cells (Fig. 5, A–D; n = 6 for normal cell preparations and n = 8 for adenomatous cell preparations). Thus, in the absence of l-Phe, the EC50 for Ca2+o in adenomatous cells was 4.5 ± 0.2 mm (n = 8; F(1, 108) = 21; P < 0.001 for comparison to normal cells) and in the presence of 0.1–10 mm l-Phe, the EC50 values for Ca2+o fell progressively to 3.2 ± 0.1 mm at 0.1 mm (with respect to normal cells: F(1, 108) = 20.1; P < 0.001), 2.4 ± 0.1 mm at 1.0 mm (with respect to normal cells: F (1, 108) = 15.1; P < 0.001) and 1.9 ± 0.1 mm at 10 mm l-Phe (with respect to normal cells: F(1, 108) = 20.7; P < 0.001). The reduced impact of l-Phe was particularly noticeable in the physiologically relevant Ca2+o concentration range from 1.0–1.5 mm (Fig. 6), and at a Ca2+o concentration of 1.5 mm, which is commonly attained in patients with primary hyperparathyroidism, there was a marked reduction in l-Phe sensitivity in adenomatous cells (Fig. 6). The data are consistent with the idea that extracellular amino acids make an important contribution to the Ca2+o sensitivity of CaR-dependent signaling in normal parathyroid cells but have a substantially reduced impact on CaR function in adenomatous parathyroid cells, and that loss of amino acid sensitivity may explain, at least in part, the loss of Ca2+o sensitivity and increase in the set-point concentration for Ca2+o that is characteristic of primary hyperparathyroidism.
Figure 6.
Effects of l-Phe concentration on intracellular Ca2+ mobilization in normal and adenomatous parathyroid cells at Ca2+o concentrations of 1.0 and 1.5 mm. Normal and adenomatous parathyroid cells were prepared and loaded with fura-2 as described in Materials and Methods. The cells were then exposed to stepwise increments in Ca2+o concentration in the absence or presence of various concentrations of l-Phe (0.1–10 mm) as shown in Fig. 5. The symbols are: ○, Ca2+ 1.0 mm, normal; ▵, Ca2+ 1.0 mm, adenomatous; •, Ca2+ 1.5 mm, normal; and ▴, Ca2+ 1.5 mm, adenomatous. The data were obtained from cells prepared from parathyroid tissue samples from six patients who underwent thyroid surgery (normals) and eight patients with parathyroid adenomatous disease and primary hyperparathyroidism.
Discussion
Primary hyperparathyroidism is typified by hypercalcemia and associated elevations in the serum PTH level. Because the CaR mediates Ca2+o-dependent feedback inhibition of PTH secretion, this combination of serum biochemical abnormalities is consistent with impaired CaR expression and/or function (for review, see Ref. 1). In the most common form of primary hyperparathyroidism, arising from adenomatous transformation of a single gland, and occasionally two glands, Ca2+o-sensitivity is impaired, consistent with a rightward shift in the set-point for plasma Ca2+o concentration (9,10). In addition, although the CaR sequence is typically normal in parathyroid adenomas, unlike parathyroid tissue from patients with familial hypocalciuric hypercalcemia, in which inactivating mutations are frequently identified (for review, see Ref. 1), CaR expression is impaired in adenomatous disease (6,11).
Previously, we demonstrated that the Ca2+o sensitivity of the CaR is enhanced by l-amino acids in physiologically relevant concentrations in both CaR-expressing HEK293 cells (2) and normal human parathyroid cells (3). Plasma-like amino acid mixtures and individual amino acids from several subclasses are effective, including aromatics such as l-Phe and l-Trp and aliphatic and polar amino acids such as l-Ala and l-Thr (2,3). Molecular pharmacological analysis indicates that amino acids act at an allosteric site in the N-terminal Venus fly trap domain (12) that is clearly distinct from the type-II calcimimetic (cinacalcet) site in the seven-transmembrane domain region (13,14).
These findings raise the possibility that impaired Ca2+o-dependent feedback of PTH secretion may arise, at least in part, from impaired amino acid-dependent activation of the CaR and a secondary impairment of Ca2+o sensitivity. The results of the current study support this conclusion. In particular, in the presence of a fasting complement of amino acids, the CaR-active amino acid, l-Phe, at a near-maximal concentration of 5 mm, enhanced the Ca2+o sensitivity of PTH release so that the IC50 for Ca2+o fell from around 1.15 mm to around 1.10 mm in normal parathyroid cells, as observed previously (3). l-Phe also enhanced the Ca2+o sensitivity of PTH release from adenomatous parathyroid cells so that the IC50 for Ca2+o fell maximally from around 1.3 to 1.2 mm, suggesting that a positive allosteric modulator acting on the CaR’s amino acid binding site, or possibly dietary-dependent modulation of amino acid levels, might be used to control inappropriately high PTH secretion in vivo. Furthermore, l-Phe was ineffective in adenomatous cells at Ca2+o concentrations less than 1.2 mm (Figs. 2 and 3), implying an increase in the threshold Ca2+o concentration for the effect of amino acids from around 0.8 mm or lower in normal cells to around 1.2 mm in adenomatous cells. The difference in sensitivity at a Ca2+o concentration of 1.0 mm was striking: in normal cells, l-Phe induced a concentration-dependent fall in PTH secretion; in adenomatous cells, however, l-Phe had no effect at concentrations up to and including 5 mm, at or above the maximal total plasma amino acid concentration achieved after dietary protein ingestion (for review, see Ref. 15) (Fig. 3).
We further explored the nature of the impaired Ca2+o sensitivity in adenomatous parathyroid cells by comparing the Ca2+o sensitivity of intracellular Ca2+ mobilization in fura-2 loaded normal and adenomatous parathyroid cells in the absence and presence of various l-Phe concentrations (0.1 to 10 mm). In the absence of amino acids, adenomatous cells exhibited a similar maximum response to elevated Ca2+o, but a loss of sensitivity to Ca2+o in the concentration range 1.0–5.0 mm, when compared with normal cells (Fig. 4). The reduction in Ca2+o sensitivity in adenomatous cells when compared with normal parathyroid cells was even more marked in the presence of l-Phe, particularly in the Ca2+o concentration range 1.0–1.5 mm (i.e. flanking the normal range for plasma ionized Ca2+ concentration, 1.1–1.3 mm; Figs. 5 and 6). These findings demonstrate that the resistance to l-Phe observed with PTH secretion in the perifusion experiments is also observed in a proximal signaling event linked to CaR activation and thus strengthens the conclusion that adenomatous parathyroid cells exhibit impaired amino acid-dependent signaling by the CaR.
Because amino acids are allosteric potentiators rather than agonists of the CaR, it is difficult to discriminate between a primary impairment of amino acid sensitivity or combined impairments of both Ca2+o and amino acid sensitivity on PTH secretion. The problem is exacerbated by the need for a basal level of amino acids for ongoing cellular PTH synthesis. In the current study, the experiments on intracellular Ca2+ mobilization provided an opportunity to investigate the impact of withdrawing amino acids on Ca2+o-dependent intracellular Ca2+ mobilization as a measure of proximal receptor function. Thus, in the absence of amino acids, a mild impairment of Ca2+o-induced intracellular Ca2+ mobilization was observed in adenomatous cells that applied across a broad Ca2+o-concentration range (0.5–5 mm; Figs. 4 and 5). In the presence of amino acids, however, Ca2+o-dependent intracellular Ca2+ mobilization was noticeably sharpened in normal cells and correspondingly impaired in adenomatous cells in the narrow, physiologically relevant, concentration range from 1.0–1.5 mm (Figs. 5 and 6). These results suggest that impaired amino acid sensitivity is a key functional determinant of dysregulated PTH secretion in adenomatous cells.
The origins of impaired amino acid sensitivity are uncertain. The observation that CaR expression is reduced in adenomatous parathyroid cells (6) raises the possibility that reductions in surface expression result in impaired activation of the intracellular signaling mechanisms that couple receptor activation to the suppression of PTH release. It is striking that the Ca2+o threshold concentration required for the activation of the CaR by amino acids increased from 0.8 mm or less in normal cells to around 1.2 mm in adenomatous cells (Figs. 2 and 5). Thus, the loss of amino acid sensitivity in adenomatous cells could be overcome by increases in the Ca2+o concentration, implying perhaps, for any particular adenoma, that there is a characteristic Ca2+o concentration above which amino acids recruited to the Venus fly trap domain binding site act to enhance receptor activation in response to further increases in Ca2+o. These events induce receptor activation and switch off PTH secretion.
Consistent with the foregoing arguments, in adenomatous cells amino acid-dependent activation of the CaR and suppression of PTH secretion was observed at ionized Ca2+o concentrations comparable to those found in the plasma of patients with primary hyperparathyroidism (around 1.3–1.6 mm). These findings support the idea that the Ca2+o set-point (i.e. the Ca2+o concentration that half-maximally suppresses PTH secretion) is dependent upon the receptor’s ability to respond to amino acids. The findings also raise the possibility that dietary manipulation based on the use of moderate to high protein diets or a pharmacological activator of the CaR that targeted the receptor’s amino acid binding site may be of value in the medical treatment of primary hyperparathyroidism. Furthermore, the demonstration of positive interactions between l-amino acid activators of the CaR and type-II calcimimetics of the phenylalkylamine class (16) raises the possibility that markedly enhanced control of PTH secretion could be achieved by combining cinacalcet with an agent that targets the CaR’s amino acid binding site.
l-Phe is one of the most potent amino acid activators of the CaR and was used in the current study as a convenient pharmacological tool. Our previous studies on the CaR stably expressed in HEK293 cells (2) or normal human parathyroid cells (3) demonstrated, however, that various aromatic and aliphatic l-amino acids are stereoselective, approximately equipotent activators of the CaR when their EC50 values for CaR activation are compared with their fasting serum levels (for review, see Ref. 15). The fasting total serum amino acid level of around 2.8 mmol · liter−1 rises to 5 mmol · liter−1 after the digestion and absorption of amino acids from a protein-rich meal (for reviews, see references 4 and 5). The effective concentration range for l-Phe in the current study (around 0.1–5 mm at a Ca2+o concentration of 1–1.5 mm) suggests that the integrated l-amino acid concentration contributes to the control of Ca2+o sensitivity, even under fasting conditions and may further promote Ca2+ sensitivity as the total serum l-amino acid level rises after a protein-rich meal.
When corrected for cell number, maximum and minimum PTH secretion rates were lower in adenomatous parathyroid cells in the current study, consistent with previous findings (10). These results suggest that the disturbance of cellular differentiation in adenomatous disease has a negative impact not only on Ca2+o-dependent feedback but also on the cellular production and/or release of PTH. Thus, PTH hypersecretion also depends on the marked expansion in the cell population associated with adenoma formation.
In conclusion, the current study demonstrates that there is impaired amino acid sensitivity in adenomatous compared with normal parathyroid cells. The effect takes the form of reduced sensitivity of Ca2+o-dependent suppression of PTH secretion and reduced amino acid-dependent activation of CaR-dependent intracellular signaling. Interestingly, amino acid-dependent receptor activation in adenomatous parathyroid cells was observed at Ca2+o concentrations around its normal physiological level of 1.2 mm, raising the possibility that the CaR’s amino acid binding site may be exploited as a target in the medical treatment of primary and perhaps other forms of hyperparathyroidism.
Footnotes
Disclosure Summary: The authors have nothing to declare.
First Published Online June 30, 2009
Abbreviations: Ca2+o, Extracellular Ca2+; CaR, Ca2+-sensing receptor; l-Phe, l-phenylalanine.
References
- Brown EM, MacLeod RJ 2001 Extracellular calcium sensing and extracellular calcium signaling. Physiol Rev 81:239–297 [DOI] [PubMed] [Google Scholar]
- Conigrave AD, Quinn SJ, Brown EM 2000 L-amino acid sensing by the extracellular Ca2+-sensing receptor. Proc Natl Acad Sci USA 97:4814–4819 [DOI] [PMC free article] [PubMed] [Google Scholar]
- Conigrave AD, Mun HC, Delbridge L, Quinn SJ, Wilkinson M, Brown EM 2004 L-amino acids regulate parathyroid hormone secretion. J Biol Chem 279:38151–38159 [DOI] [PubMed] [Google Scholar]
- Conigrave AD, Franks AH, Brown EM, Quinn SJ 2002 L-Amino acid sensing by the calcium-sensing receptor: a general mechanism for coupling protein and calcium metabolism? Eur J Clin Nutr 56:1072–1080 [DOI] [PubMed] [Google Scholar]
- Conigrave AD, Brown EM 2006 Taste receptors in the gastrointestinal tract. II. L-amino acid-sensing by calcium-sensing receptors: implications for GI physiology. Am J Physiol Gastrointest Liver Physiol 291:G753–G761 [DOI] [PubMed] [Google Scholar]
- Cetani F, Picone A, Cerrai P, Vignali E, Borsari S, Pardi E, Viacava P, Naccarato AG, Miccoli P, Kifor O, Brown EM, Pinchera A, Marcocci C 2000 Parathyroid expression of calcium-sensing receptor protein and in vivo parathyroid hormone-Ca2+ set-point in patients with primary hyperparathyroidism. J Clin Endocrinol Metab 85:4789–4794 [DOI] [PubMed] [Google Scholar]
- Bradbury RA, McCall MN, Brown MJ, Conigrave AD 1996 Functional heterogeneity of human term cytotrophoblasts revealed by differential sensitivity to extracellular Ca2+ and nucleotides. J Endocrinol 149:135–144 [DOI] [PubMed] [Google Scholar]
- Meddings JB, Scott RB, Fick GH 1989 Analysis and comparison of sigmoidal curves: application to dose-response data. Am J Physiol 257:G982–G989 [DOI] [PubMed] [Google Scholar]
- Brown EM, Brennan MF, Hurwitz S, Windeck R, Marx SJ, Spiegel AM, Koehler JO, Gardner DG, Aurbach GD 1978 Dispersed cells prepared from human parathyroid glands: distinct calcium sensitivity of adenomas vs. primary hyperplasia. J Clin Endocrinol Metab 46:267–275 [DOI] [PubMed] [Google Scholar]
- Mun HC, Conigrave A, Wilkinson M, Delbridge L 2005 Surgery for hyperparathyroidism: does morphology or function matter most? Surgery 138:1111–1120 [DOI] [PubMed] [Google Scholar]
- Farnebo F, Höög A, Sandelin K, Larsson C, Farnebo LO 1998 Decreased expression of calcium-sensing receptor messenger ribonucleic acids in parathyroid adenomas. Surgery 124:1094–1098; discussion 1098–1099 [DOI] [PubMed] [Google Scholar]
- Mun HC, Franks AH, Culverston EL, Krapcho K, Nemeth EF, Conigrave AD 2004 The Venus fly trap domain of the extracellular Ca2+-sensing receptor is required for L-amino acid sensing. J Biol Chem 279:51739–51744 [DOI] [PubMed] [Google Scholar]
- Hauache OM, Hu J, Ray K, Xie R, Jacobson KA, Spiegel AM 2000 Effects of a calcimimetic compound and naturally activating mutations on the human Ca2+ receptor and on Ca2+ receptor/metabotropic glutamate chimeric receptors. Endocrinology 141:4156–4163 [DOI] [PMC free article] [PubMed] [Google Scholar]
- Ray K, Northup J 2002 Evidence for distinct cation and calcimimetic compound (NPS 568) recognition domains in the transmembrane regions of the human Ca2+ receptor. J Biol Chem 277:18908–18913 [DOI] [PubMed] [Google Scholar]
- Conigrave AD, Hampson DR 2006 Broad-spectrum amino acid sensing by class 3 G-protein coupled receptors. Trends Endocrinol Metab 17:398–407 [DOI] [PubMed] [Google Scholar]
- Zhang Z, Jiang Y, Quinn SJ, Krapcho K, Nemeth EF, Bai M 2002 L-Phenylalanine and NPS R-467 synergistically potentiate the function of the extracellular calcium-sensing receptor through distinct sites. J Biol Chem 277:33736–33741 [DOI] [PubMed] [Google Scholar]


