Abstract
We have developed a false positive (FP) reduction method based on analysis of bilateral mammograms for computerized mass detection systems. The mass candidates on each view were first detected by our unilateral computer-aided detection (CAD) system. For each detected object, a regional registration technique was used to define a region of interest (ROI) that is “symmetrical” to the object location on the contralateral mammogram. Texture features derived from the spatial gray level dependence matrices and morphological features were extracted from the ROI containing the detected object on a mammogram and its corresponding ROI on the contralateral mammogram. Bilateral features were then generated from corresponding pairs of unilateral features for each object. Two linear discriminant analysis (LDA) classifiers were trained from the unilateral and the bilateral feature spaces, respectively. Finally, the scores from the unilateral LDA classifier and the bilateral LDA asymmetry classifier were fused with a third LDA whose output score was used to distinguish true mass from FPs. A data set of 341 cases of bilateral two-view mammograms was used in this study, of which 276 cases with 552 bilateral pairs contained 110 malignant and 166 benign biopsy-proven masses and 65 cases with 130 bilateral pairs were normal. The mass data set was divided into two subsets for twofold cross-validation training and testing. The normal data set was used for estimation of FP rates. It was found that our bilateral CAD system achieved a case-based sensitivity of 70%, 80%, and 85% at average FP rates of 0.35, 0.75, and 0.95 FPs/image, respectively, on the test data sets with malignant masses. In comparison to the average FP rates for the unilateral CAD system of 0.58, 1.33, and 1.63, respectively, at the corresponding sensitivities, the FP rates were reduced by 40%, 44%, and 42% with the bilateral symmetry information. The improvement was statistically significance (p<0.05) as estimated by JAFROC analysis.
Keywords: computer-aided detection (CAD), bilateral analysis, mass detection, false positive reduction
I. INTRODUCTION
Breast cancer is one of the leading causes of death among American women between 40 to 55 years of age.1 It has been reported that early diagnosis and treatment can significantly improve the chance of survival for patients with breast cancer.2–4 Although mammography is a powerful screening tool for detecting breast cancer,5,6 studies indicate that a substantial fraction of breast cancers that are visible upon retrospective analyses of the images are not detected initially.7–9 It has been shown that computer-aided detection (CAD) can increase the cancer detection rate by radiologists both in the laboratory and in clinical practice.10–15
In screening mammography, two mammographic views, cranio-caudal (CC) and mediolateral oblique (MLO) views are generally taken of each breast. During mammographic interpretation, the radiologist combines complex information including morphology, texture, and geometric location of any suspicious structures of the imaged breast from different views, asymmetric density patterns between bilateral mammograms of the same view, and changes between the current and the prior mammograms if available. Radiologists have found that these techniques are effective in improving the accuracy of detecting subtle lesions and reducing false positives (FPs).
Investigators have attempted to implement the multiple image techniques in CAD systems to improve the detection accuracy of abnormalities and the classification accuracy of differentiating malignant and benign lesions. Hadjiiski et al.16 developed an interval change analysis of masses on current and prior mammograms and found that the classification accuracy of masses can be improved significantly in comparison to single image classification. Paquerault et al.17 developed a two-view (CC and MLO views) fusion technique to reduce FPs in mass detection and obtained significant improvement by comparing to their one-view detection system. van Engeland et al.18 recently presented a two-view CAD system by using the features including the difference in the radial distance from the candidate regions to the nipple, the gray scale correlation between both regions, and the mass likelihood of the regions determined by the single view CAD scheme. Yin et al.19 used bilateral subtraction in a prescreening step of a mass detection program to locate mass candidates, but the subsequent image analysis was performed based only on a single view. Mendez et al.20 developed a bilateral CAD system based on a bilateral subtraction approach and used size and eccentricity tests and texture features to eliminate FPs. Again, the bilateral information is only used to find the suspicious objects and the subsequent analysis is based on a single view.
The detection of masses on mammograms is a challenging task. The normal fibroglandular tissue in the breast causes FPs by mimicking masses and causes false negatives (FNs) due to overlapping with lesions. In order to improve the performance of our mass detection system, we are investigating computer-vision methods by incorporating information from two-view mammograms17 and bilateral mammograms,21 emulating radiologists’ mammographic interpretation techniques. In this study, we will discuss our approach to FP reduction by analyzing the symmetry or asymmetry of density patterns between bilateral mammograms.
II. MATERIALS AND METHODS
A. Data sets
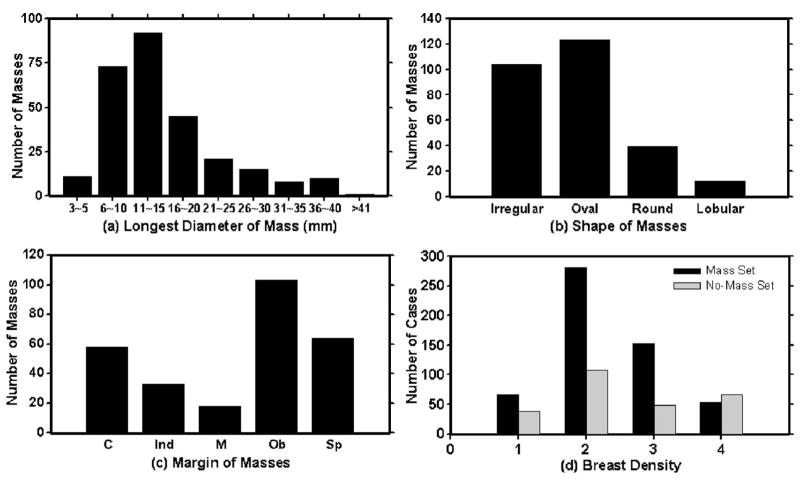
A database of mammograms was collected from patient files at the Department of Radiology with Institutional Review Board approval. The mammograms were digitized by a Lumiscan laser scanner with a pixel size of 50 μm × 50 μm and 12 bits per pixel. The pixel size was increased to 100 μm × 100 μm by averaging every 2 × 2 adjacent pixels before being input to the CAD system. In this study, two data sets are used: a mass data set containing bilateral digitized mammograms with malignant or benign masses and a no-mass data set containing bilateral digitized mammograms without masses, verified by an experienced radiologist. All cases had four mammographic views, the CC view and the MLO view mammogram for both breasts. The mass set and the no-mass data set contained 276 cases (552 bilateral pairs) and 65 cases (130 bilateral pairs), respectively, yielding a total of 1364 mammograms. The mass data set was used to estimate the detection sensitivity and the no-mass data set was used for estimating the FP rate (number of FPs per image). In the mass data set, each patient had a biopsy-proven mass in one of the breasts, resulting in a total of 276 masses, 166 of which were benign and 110 malignant. A Mammography Quality Standard Act (MQSA) radiologist identified the location of the masses based on all available diagnostic and clinical information of the case, measured the mass sizes as the longest dimension seen on the two-view mammograms, provided descriptors of the mass shapes and mass margins, and also provided an estimate of the breast density in term of Breast Imaging Reporting and Database System (BI-RADS) category. Figure 1 shows the information of our data set which includes the distributions of mass sizes, mass shapes, mass margins, and breast density.
Fig. 1.
The characteristics of our mass data set: (a) distribution of mass sizes, (b) distribution of mass shapes, (c) distribution of mass margins, C: circumscribed, Ind: indistinct, M: microlobulated, Ob: obscured, Sp: spiculated, and (d) distribution of the breast density in terms of BI-RADS category estimated by a MQSA radiologist.
For training and evaluation of the performances of the CAD systems, the cases in our mass data set were divided into two independent data subsets containing 136 and 140 cases, respectively, for twofold cross-validation training and testing. Of the 136 cases in subset 1, 52 were malignant and 84 were benign. Of the 140 cases in subset 2, 58 were malignant and 82 were benign. The no-mass data set was not used during training. All 260 mammograms were kept as independent test samples to be used with both test subsets.
B. Methods
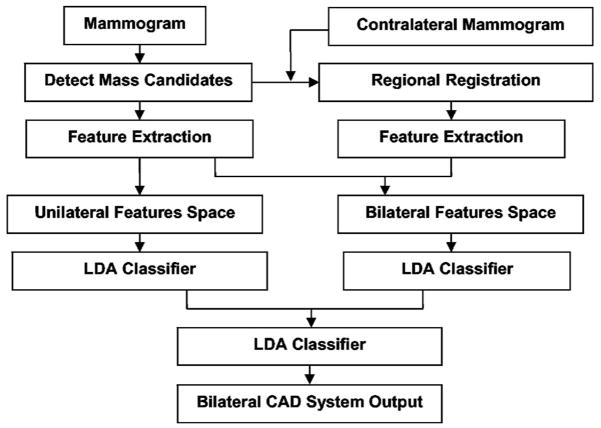
Our bilateral CAD system combines unilateral features with bilateral features to reduce FPs. Similar structures that appear in both right and left mammograms at corresponding locations are more likely to be normal tissue than masses, whereas asymmetric density may indicate a developing lesion. The key of this system is therefore the design of a classifier that can differentiate symmetry and asymmetry of paired regions of interest (ROIs) in corresponding regions on bilateral mammograms of the same view. The system consists of four steps: (1) mass candidate (MC) localization, (2) corresponding ROIs (CR) registration, (3) feature extraction and analysis, and (4) bilateral information fusion. Figure 2 shows the block diagram for our bilateral CAD system. The detailed description for each step is presented below.
Fig. 2.
Block diagram of the bilateral CAD system for mass detection on mammograms.
1. Mass candidate localization
Identification of mass candidates is performed by the following two steps: breast segmentation and mass candidate detection. The breast image is first segmented from the surrounding image background by boundary detection.
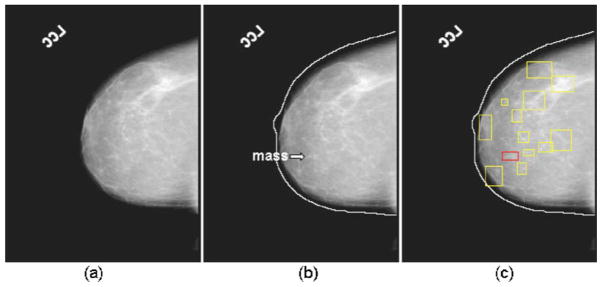
The algorithm developed by Zhou et al.22 in our laboratory is used to track the breast boundary and segment the breast from the background. Mass detection is performed only in the breast region. We have previously developed a mass detection system for unilateral mammograms.23–25 The system is used for mass candidate detection in the current study. The system performs mass detection in two steps. In the first step, a gradient field analysis method is used to determine the seeds of mass candidates followed by a region growing24 method to segment the mass candidates starting from those seeds. In the second step, the gradient convergence is calculated using the gray levels and the shape of the segmented mass region as a priori information. The mass candidates that pass the gradient convergence criterion are retained for further analysis in the bilateral system. Figure 3 shows an example of mass candidates detected on a mammogram. Figures 3(a)–3(c) show the original image, detected breast boundary, and the detected mass candidates, respectively.
Fig. 3.
An example of performing the mass candidate identification: (a) an original mammogram, (b) the detected breast boundary of (a), a mass is marked by the arrow, and (c) the detected mass candidates of (a).
2. Corresponding ROI registration
For each mass candidate, its corresponding ROI on the contralateral mammogram is identified by the regional registration technique developed previously in our laboratory16 with a modification to handle the special case when the distance between the nipple location and the center of a ROI is too small to obtain the intersection points on the breast boundary. The nipple location on each image was manually identified so that the effectiveness of the bilateral analysis method could be evaluated independent of nipple detection errors.
The original region registration technique included the following steps. The registration is performed in a polar coordinate system where the origin is located at the nipple location of a breast image. Figure 4 shows an example of locating the corresponding ROI of a mass candidate on the contralateral mammogram. Using the distance r from the nipple o to the center of the mass as the radius, an arc centered at the origin (nipple) is drawn. The arc will intersect the mass candidate and the breast boundary at two points, p and q. The angle between om and op is defined as θ, the angle between op and oq is defined as α. On the contralateral mammogram, the corresponding ROI m′ is localized with a similar procedure. An arc of radius r centered at the nipple o′ of the contralateral mammogram is drawn. The intersections of the arc with the breast boundary are p′ and q′. The angle between o′p′ and o′q′ is defined as α′. The location of the corresponding ROI as determined by the angle θ′ between o′p′ and the radius o′m′ is estimated as θα′/α. The coordinate of the center of the corresponding ROI is therefore given by (r, θ′).
Fig. 4.
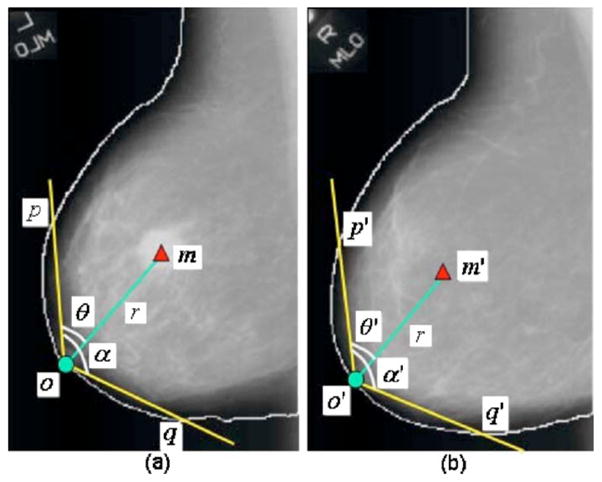
An example of obtaining the corresponding ROI of a mass candidate on the contralateral mammogram: (a) mass candidate on the left MLO view at m and (b) corresponding ROI on the right MLO view at m′.
For some special cases that the nipple is located within the breast, not on the breast boundary (referred to as an inward nipple), our original regional registration method may fail since the distance from the nipple to the mass candidate can be too short to obtain two intersection points on the breast boundary. In order to handle those special cases, the new origin will be derived by horizontally shifting the origin of the polar coordinate system toward the breast boundary until the intersection on the breast boundary is reached. In this way, the radius can be roughly determined such that the corresponding ROI location can be estimated. Figure 5 shows an example of the modified regional registration. Figure 5(a) shows an example that the distance om between the nipple and a mass candidate is too small to obtain two intersection points at the breast boundary. After horizontally shifting the origin from o to n in Fig. 5(a) and the origin from o′ to n′ in Fig. 5(b), the location of the corresponding ROI m′ is estimated based on the new origins using the regional registration technique as described above.
Fig. 5.
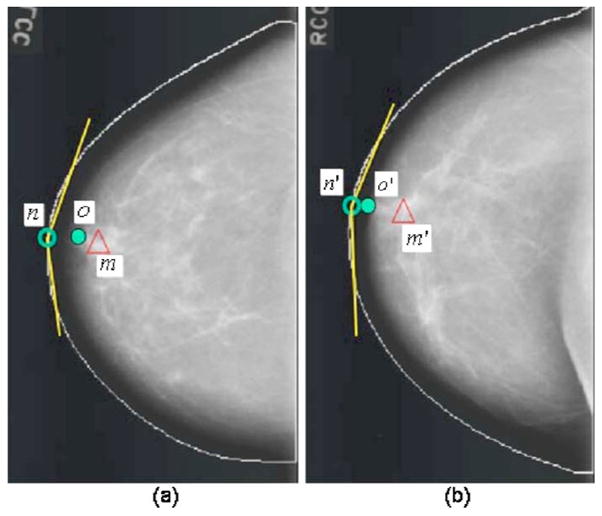
An example of obtaining the corresponding ROI based on the modified regional registration technique: (a) the nipple location (o), the shifted origin (n), and the mass candidate (m), and (b) corresponding ROI on the contralateral mammogram.
3. Feature extraction and analysis
a. Feature extraction
For the features analysis, two types of features, spatial gray-level dependence (SGLD) texture features and morphological features are extracted from both the ROI containing the detected mass candidate and its contralateral ROI.
For the SGLD features, 13 texture measures24–26 are extracted from the entire ROI (referred to as the global texture features) at 14 distances and two angles with a total of 364 (13×14×2) features. The same 13 texture measures are extracted from the central region containing the detected object and the peripheral regions within each ROI (referred to as the local texture features) at four distances and two angles with a total of 104 (13×2×4) features from the central region and 104 features as the difference of the corresponding features in the central and the peripheral regions.25
Twelve morphological features are extracted from the object segmented within the ROI.24,25 Five of them are based on the normalized radial length (NRL), defined as the Euclidean distance from the object centroid to each of its edge pixels and normalized relative to the maximum radial length for the object.27 In our previous studies, we found that the mean, standard deviation, entropy, area ratio, and zero crossing count features derived from the NRL are useful for discriminating between objects containing masses and normal tissue.24 The other six morphological features are the perimeter, area, perimeter-to-area ratio, circularity, rectangularity, and contrast of the object.24 The last morphological feature is the summary Fourier descriptor measure,28 which is obtained from the Fourier transform of the object boundary sequence. Objects with more irregular contours have more high-frequency components than those with smooth contours.29
b. Unilateral CAD system
The unilateral linear discriminant analysis (LDA) classifier uses only the SGLD texture features as input predictor variables as described previously.25 The stepwise LDA feature selection strategy with simplex optimization16 was used to select the best texture feature subset and reduce the dimensionality of the feature space. Twofold cross validation was used to train and test the CAD systems, as discussed below. For each of the two cross-validation cycles, the algorithm used a leave-one-case-out resampling method and simplex optimization within the training subset to estimate the best threshold values, Fin, Fout, and tolerance, based on the F statistics for stepwise feature selection. The chosen Fin, Fout and tolerance values are then used to select a set of features and the weights for the LDA classifier are estimated from the training subset. The test subset was thus independent of the classifier training in each cross-validation cycle. This procedure has been described in more details previously.23
4. Bilateral information fusion
a. Bilateral LDA classifier
The bilateral LDA classifier incorporates the “symmetry” information on the left and right breasts to differentiate symmetric (likely FPs) and asymmetric (likely masses) structures. Bilateral features are derived from the unilateral SGLD texture features and the morphological features for each pair of ROIs—a detected mass candidate and its corresponding ROI, using the following relationship:
| (1) |
where MC[i, j] and CR[i, j] are the ith feature of the jth mass candidate and the ith feature of the jth corresponding ROI, respectively. The bilateral LDA classifier was trained in a similar way as that for the unilateral LDA classifier, as described above.
b. Bilateral CAD system
In the last stage, the discriminant scores of the unilateral and bilateral classifiers are merged by a third LDA. The weights of this LDA classifier were also trained with the training subset. The output score from the third LDA is used to differentiate true positives (TPs) from FPs in the bilateral CAD system.
5. Evaluation methods
The detected individual objects were compared with the true mass location marked by an experienced radiologist. An object was considered to be a TP if the overlap between the detected object and the true mass was greater than 25%. The 25% threshold was selected as described in our previous study.30
To evaluate the performance of our bilateral LDA classifier, the test discriminant scores were analyzed using receiver operating characteristic (ROC) methodology.31 The accuracy for classification of mass and normal tissue was evaluated as the area under the ROC curve, Az.
The detection performance of the bilateral CAD system was assessed by free response ROC (FROC) analysis. A FROC curve shows the relationship between the detection sensitivity and the FP rate as the decision threshold varies. FROC curves were presented on a per-image and a per-case basis. For image-based FROC analysis, the mass on each mammogram was considered an independent true object. For case-based FROC analysis, the same mass imaged on the two-view mammograms was considered to be one true object and detection of the masses on either view or on both views was considered to be a TP detection.
Two sets of trained parameters were acquired as a result of the twofold cross-validation training. To estimate the FP rate on normal mammograms when the trained CAD system is used in a screening setting, we applied the trained unilateral and bilateral systems to the 260 no-mass mammograms for independent testing. The number of FP marks produced by the algorithm was estimated by counting the detected objects on these normal cases only. The mass sensitivity was determined by counting only the masses on the corresponding test mass subset. The combination of the sensitivity from the test mass subset and the FP rate from the normal data set at the corresponding detection thresholds resulted in a test FROC curve. The training and testing procedure were performed for each cycle of the twofold cross-validation process, thereby generating two test FROC curves. To estimate the overall performance of the CAD system, an average test FROC curve is obtained by averaging the FP rates from the FROC curves of the two mass subsets at the corresponding sensitivities.
Chakraborty et al.32 proposed a JAFROC method and provided software to estimate the statistical significance of the difference between two FROC curves. We employed the JA-FROC analysis to evaluate the difference in the FROC curves obtained from the unilateral CAD system and the bilateral CAD system.
III. RESULTS
A. Bilateral feature analysis
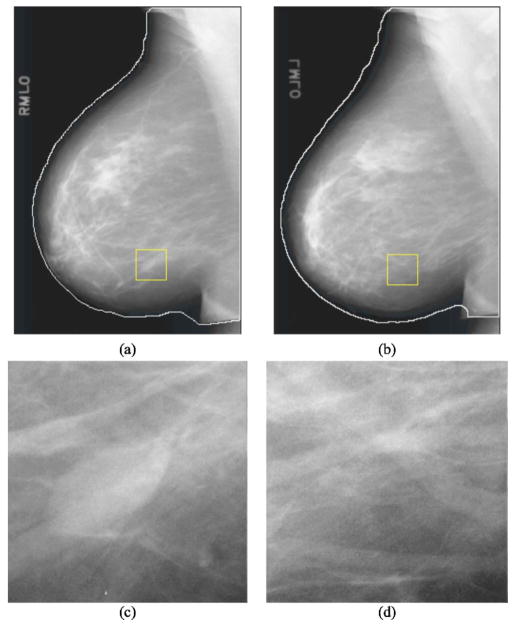
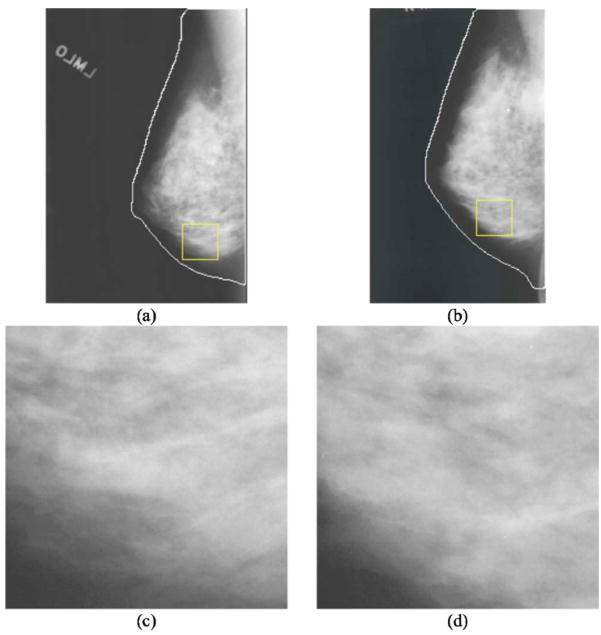
Figures 6 and 7 show examples of detection results obtained from the unilateral system and the bilateral system. Figure 6 shows a mass that was initially detected as a mass candidate but was excluded in the false positive reduction steps and was therefore a FN of the unilateral CAD system. The bilateral analysis increased the likelihood score of this mass. It was therefore not excluded in the false positive reduction steps and became a TP in the bilateral CAD system.
Fig. 6.
(a) Mammogram containing a mass marked by the rectangular box. (b) A contralateral mammogram of (a) and the rectangular box is the corresponding ROI of the mass in (a) estimated by the automated regional registration technique. (c) ROI extracted from (a) containing a mass detected at the prescreening stage but excluded at the final stage of the unilateral CAD system. (d) The corresponding ROI in the contralateral breast. Bilateral analysis of this ROI pair increased the likelihood score of the mass which was then detected as a TP in the bilateral CAD system.
Fig. 7.
(a) Mammogram and the rectangular ROI containing a mass candidate. (b) The contralateral mammogram of (a) and the rectangular box is the corresponding ROI of the mass candidate in (a). (c) ROI extracted from (a) containing normal tissue detected at the prescreening stage and included as a FP at the final stage of the unilateral CAD system. (d) The corresponding ROI in the contralateral breast. Bilateral analysis of this ROI pair reduced the likelihood score of the normal tissue which then became a TN in the bilateral CAD system.
Figure 7 shows an example of an FP detected by the unilateral CAD system. The FP was excluded in the bilateral system because it was found to have high symmetry with the tissue in the contralateral breast, as shown in the ROI in Fig. 7(d), by the bilateral analysis.
B. Performance evaluation
In the prescreening process, we obtained a large number of mass candidates on each mammogram. Each mass candidate was paired with a corresponding ROI in the contralateral breast. A total of 3127 and 3402 mass candidates were extracted for training subsets 1 and 2, respectively, which included 98.5% (134/136) and 99.3% (139/140) of the masses in the two subsets. The mass candidates in the unilateral mammograms and the ROI pairs from bilateral mammograms in the training subset were used to design the unilateral and bilateral classifiers in each of the twofold cross-validation cycles. The most effective subset of features from the available feature pool was selected for each of the training subsets during the training procedure. For the unilateral LDA classifier, 20 (11 global and 9 local) and 19 (12 global and 7 local) texture features were selected from the two independent training subsets, respectively. For the bilateral LDA classifier, 24 (11 global texture, 9 local texture, and 4 morphological) and 23 (12 global, 8 local, and 3 morphological) features were selected from the two independent training subsets, respectively. The validation Az values of the LDA classifier during the leave-one-case-out training were 0.846±0.011 and 0.832±0.009, respectively, for the two training subsets using the unilateral LDA classifier, and were 0.862±0.015 and 0.859±0.012, respectively, using the bilateral LDA classifier. The classifiers achieved Az values of 0.833±0.015 and 0.831±0.011, respectively, for the two test subsets using the unilateral LDA classifier, and 0.853±0.013 and 0.849±0.011, respectively, using the bilateral LDA classifier.
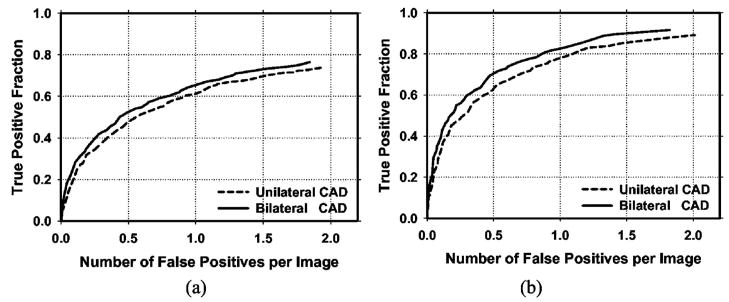
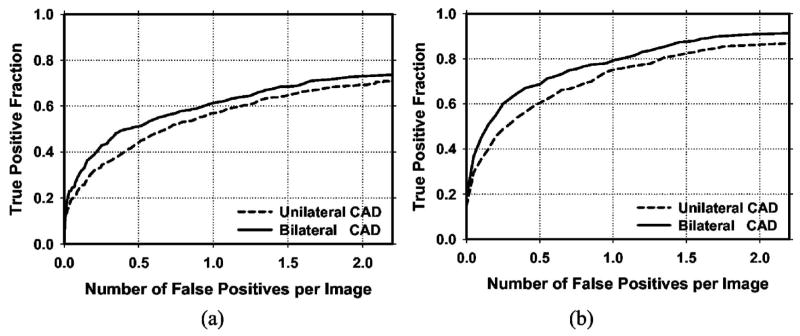
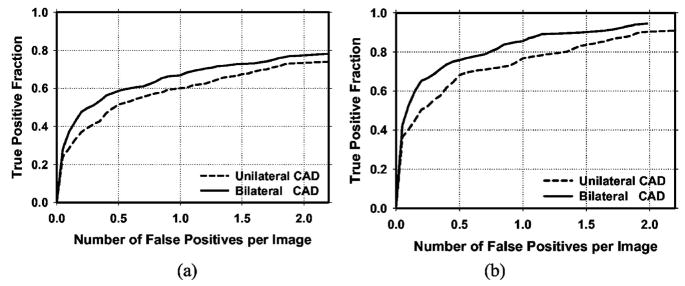
Figure 8 shows the average test FROC curves for the unilateral and bilateral CAD systems after FP reduction with the corresponding trained LDA classifiers when the FP rates were estimated from the test subsets with masses. Figure 9 shows the corresponding results when the FP rates were estimated on the set of no-mass mammograms. Table I summarizes the average FP rates estimated with both the mass and no-mass data sets at several case-based sensitivities.
Fig. 8.
(a) Image-based and (b) case-based average test FROC curves from the unilateral and the bilateral CAD systems. The FP rates were estimated from detection on mammograms in the test subsets with masses.
Fig. 9.
(a) Image-based and (b) case-based average test FROC curves from the unilateral and the bilateral CAD systems. The FP rates were estimated from detection on mammograms in the no-mass data set.
Table I.
The average FP reduction rates at case-based sensitivities of 70%, 80%, and 85% for the test subsets when the FP rates were estimated from the mass and no-mass data sets.
| FP rate estimated from mass data set |
FP rate estimated from no-mass data set |
|||||
|---|---|---|---|---|---|---|
| Unilateral CAD | Bilateral CAD | FP Reduction | Unilateral CAD | Bilateral CAD | FP Reduction | |
| 70% | 0.70 | 0.53 | 24% | 0.86 | 0.53 | 38% |
| 80% | 1.10 | 0.87 | 21% | 1.32 | 1.04 | 21% |
| 85% | 1.46 | 1.15 | 21% | 1.72 | 1.32 | 23% |
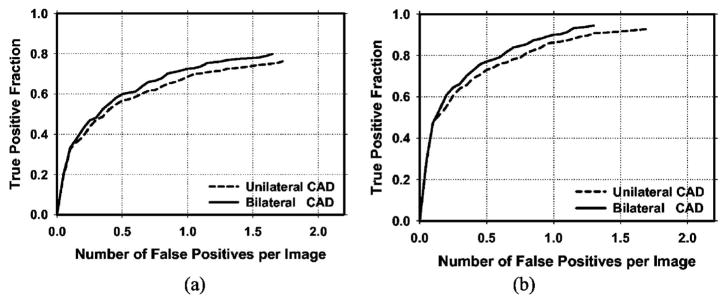
Because the detection performance of CAD systems on cancer cases is of prime importance, we analyzed the performance of our CAD systems for the subset of cases containing malignant masses. Figure 10 compares the average test FROC curves for the unilateral and bilateral CAD systems on malignant cases only. Figure 11 shows the average test FROC curves for the unilateral and bilateral CAD systems with the sensitivities estimated on malignant cases only and the FP rates estimated on the set of no-mass mammograms. The bilateral CAD system achieved a case-based sensitivity of 70%, 80%, and 85% at average FP rates of 0.35, 0.75, and 0.95 FPs/image, respectively, on the test subset of malignant masses. In comparison to the average FP rates for the unilateral CAD system of 0.58, 1.33, and 1.63 FPs/image, respectively, at the corresponding sensitivities, the FP rates were reduced by 40%, 44%, and 42% with the bilateral symmetry information. Table II summarizes the average FP rates estimated with both the mass and no-mass data sets for cases with malignant masses only at several case-based sensitivities.
Fig. 10.
(a) Image-based and (b) case-based average test FROC curves from the unilateral and bilateral CAD systems for detection on cases with malignant masses only. The FP rates were estimated from in the same data set.
Fig. 11.
(a) Image-based and (b) case-based average test FROC curves from the unilateral and bilateral CAD systems for detection on cases with malignant masses only. The FP rates were estimated from the no-mass data set.
Table II.
The average FP reduction rates for cases with malignant masses at case-based sensitivities of 70%, 80%, and 85% for the test subsets when the FP rates were estimated from the mass and no-mass data sets.
| FP rate estimated from mass data set |
FP rate estimated from no-mass data set |
|||||
|---|---|---|---|---|---|---|
| Unilateral CAD | Bilateral CAD | FP Reduction | Unilateral CAD | Bilateral CAD | FP Reduction | |
| 70% | 0.43 | 0.33 | 23% | 0.58 | 0.35 | 40% |
| 80% | 0.78 | 0.62 | 21% | 1.33 | 0.75 | 44% |
| 85% | 0.94 | 0.78 | 17% | 1.63 | 0.95 | 42% |
The figure-of-merit (FOM) from the output of the JA-FROC software is summarized in Table III(a) for all cases and in Table III(b) for malignant cases only. The difference between the FOMs for the unilateral and the bilateral CAD systems was statistically significant (p<0.05) for all comparisons.
Table III.
Estimation of the statistical significance in the difference between the FROC performance of the unilateral and bilateral CAD systems on test subsets 1 and 2. The FP rates of the FROC curves were estimated from the no-mass data set: (a) all cases and (b) malignant cases.
| (a) | FOM (JAFROC) |
||
|---|---|---|---|
| Test subset 1 | Test subset 2 | ||
| Unilateral CAD | 0.52 | 0.48 | |
| Bilateral CAD | 0.58 | 0.51 | |
| p value | <0.001 | 0.008 | |
| (b) | FOM (JAFROC) |
||
| Test subset 1 (malignant only) | Test subset 2 (malignant only) | ||
|
| |||
| Unilateral CAD | 0.56 | 0.53 | |
| Bilateral CAD | 0.61 | 0.56 | |
| p value | 0.009 | 0.003 | |
IV. DISCUSSION
Symmetry between breast structures in bilateral pairs of mammograms is an important feature used by radiologists for mass detection or FP reduction. Similar structures that appear in both right and left mammograms are more likely to be normal tissue than abnormal lesions. Our bilateral analysis translates this radiologists’ knowledge to computer vision techniques so that the CAD system can utilize the symmetry of breast tissue on bilateral mammograms to improve detection accuracy. The results of our study show that the bilateral information is an effective technique for reducing FPs.
The bilateral features are important factors affecting the performance of the bilateral LDA classifier. In this study, the bilateral features were derived from features extracted from each pair of ROIs, i.e., the mass candidate and its corresponding ROI, using the maximum-to-minimum ratio strategy as shown in Eq. (1). We also investigated if other strategies, including BF[i, j] = MC[i, j]/CR[i, j], BF[i, j] = (MC[i, j] − CR[i, j])/MC[i, j], and BF[i, j] =(MC[i, j] − CR[i, j])/[(MC[i, j] +CR[i, j])/2], could improve the performance of the bilateral CAD system. It was found that these strategies are not as effective as the maximum-to-minimum ratio. Specifically, among the Az values of all bilateral features, 72% of those from the latter strategies are lower than those of their corresponding features obtained by Eq. (1). The advantage of using bilateral symmetry measures defined by the maximum-to-minimum ratio can be seen by considering the following example: assuming two ROI pairs that are highly asymmetric, (MC1, CR1) and (MC2, CR2), in which MC1 > CR1 and MC2 < CR2, their bilateral features derived as the maximum-to-minimum ratio will both be greater than 1. However, the bilateral features obtained from BF[i, j] = MC[i, j]/CR[i, j] will be greater than 1 for (MC1, CR1) but smaller than 1 for (MC2, CR2). The bilateral measures obtained from BF[i, j] = (MC[i, j] − CR[i, j])/MC[i, j] or BF[i, j] = (MC[i, j] − CR[i, j])/[(MC[i, j]+CR[i, j])/2] will be positive for (MC1, CR1) but negative for (MC2, CR2). The bilateral feature defined in Eq. (1) therefore describes the asymmetry between the ROI pairs, regardless which ROI has a larger feature value, whereas the other three bilateral features do not consistently provide feature values in the same direction. The maximum-to-minimum ratio approach can thus achieve better performance than the other three strategies.
The corresponding ROI registration is an important procedure in the bilateral analysis. The two breasts of a given patient are not perfectly symmetrical and other factors such as positioning and compression further introduce variability in the symmetry. We investigated the effect of variability in the registered ROI locations on bilateral analysis. For this purpose, the prescreening step of our unilateral CAD system was first applied to the contralateral mammogram to locate the mass candidates. For a given ROI predicted by the registration method on the contralateral mammogram, its location was compared to the ROI locations of these mass candidates by evaluating an overlap ratio, defined as the intersection between the predicted ROI and a mass candidate ROI relative to the area of the smaller ROIs. If the overlap ratio of the predicted ROI with a mass candidate ROI was greater than a chosen threshold, the location of the predicted ROI would be changed to the location of the mass candidate ROI. If the predicted ROI overlapped with more than one mass candidate ROIs, the mass candidate ROI having the largest overlap ratio that exceeded the threshold would be used. We evaluated the effects of this ROI location adjustment for a range of thresholds. It was found that when the overlap ratio threshold was chosen to be about 0.7–0.9, the performance of the bilateral CAD system would have a small but insignificant improvement compared to the bilateral CAD system without the ROI adjustment process. When the overlap ratio threshold was smaller than 0.5, the performance of the bilateral CAD system was degraded. This study indicated that small variability of the predicted ROI location on the contralateral mammogram does not have a strong effect on the performance of the bilateral analysis.
Various registration methods have been attempted for registration of mammograms of the same breast. For example, the warping approach proposed by Sallam et al.33 and the multiple-control-point approach proposed by Vujovic et al.34 Those approaches depended on the identification of corresponding control points. However, there are few, if any, invariant landmarks on mammograms that can be identified automatically because the breast is composed of soft tissue. The projected image of the breast tissue often changes even when the same breast is compressed two different times. It is even more variable between a breast and its contralateral breast. Commonly used rigid or nonrigid registration methods will not be appropriate for this application. We therefore developed the regional registration method for correlation of ROIs on mammograms. Our regional registration method uses the nipple and the distance between the nipple and the ROI center to be the relatively invariant information. The lesion in the target breast is estimated to be located within a band of tissue centered along the arc traced using the nipple-to-lesion distance as the radius and with the origin at the nipple. This method emulates a technique used by many radiologists in identifying corresponding lesions in two-view mammograms or current and prior mammograms. van Engeland et al.35 compared methods for mammogram registration based on breast alignment and linear and nonlinear warping. They concluded that linear warping using mutual information performed better than the other methods. We also performed a study comparing our regional registration method to correlation or mutual information based linear and nonlinear warping methods using a data set of 390 current and prior mammogram pairs.36 Our results showed that the regional registration method outperformed the warping approaches in identifying corresponding lesions on the mammogram pairs. The localization of symmetric ROIs on the bilateral breasts is similar to the problem of registering ROIs on current and prior mammograms. We therefore adapted the regional registration method to the bilateral analysis in this study.
To implement the bilateral analysis in a practical CAD system, the nipple locations have to be detected automatically. We have previously developed a nipple detection algorithm to determine the nipple location on a mammogram. The algorithm could detect the nipple locations within 1 cm of the manually identified locations in about 70% of the images in the data set used in this study. A large deviation of the nipple location from the true location may affect the regional registration technique in locating the symmetric ROI on the contralateral mammogram, which in turn may degrade the performance of the bilateral analysis of tissue symmetry. We therefore used the manually identified nipple locations in this study in order to develop the bilateral classifier without the influence of other confounding factors. Further work is underway to improve the nipple detection algorithm and to investigate the effect of nipple detection accuracy on the performance of the bilateral system.
The inward nipple projection is often a result of positioning and compression problems so that the nipple is not projected in profile. Since there is not enough information from the two-dimensional projected mammograms to correct for the deformation of the breast, we designed a simple, ad hoc correction method to allow the arc drawn using the nipple-to-mass distance as the radius to intersect the breast boundary. In these cases, the breast image on the bilateral mammogram often does not have a similar positioning problem and the difference in the compression of the two breasts may cause large uncertainty in the registration regardless of the correction method. For cases in which both breasts actually have inward nipples and the breast images are similar, our correction method will not cause additional errors because similar correction will be applied to the bilateral mammograms and symmetric ROIs will be identified on the mammograms.
Our motivation of this study is to reduce the FPs of a CAD system for mass detection. A CAD detection system is generally intended for use in screening mammography. At the screening stage, all lesions of concern should be pointed out to radiologists so that the radiologists can judge whether a recall is warranted. If a detection system is trained to mark only the malignant lesions, it may be attempting to play the role of a triage system (alerting radiologists to work up only “malignant” cases) rather than that of a second reader. Furthermore, since computerized lesion detection or characterization on mammograms is not 100% sensitive, it will be confusing to the radiologists whether an unmarked suspicious lesion is missed or it is considered benign by the computer. We believe that computer-aided diagnosis (CADx) may be used in different ways in conjunction with a CAD detection system. For example, the likelihood of malignancy may be estimated by the CADx system and displayed for every detected lesion, and/or a CADx system may be used during diagnostic workup. Either way the CAD system will first alert radiologists to all masses, leaving the assessment of malignancy or benignity to a second stage. We therefore included both malignant and benign masses in the training sets to train the system to detect all masses.
V. CONCLUSIONS
We developed a FP reduction method to improve computerized mass detection on mammograms based on analysis of bilateral information. It was found that the false positives can be reduced by training a new classifier for bilateral features and combining its output score with the unilateral classifier score. The bilateral CAD system achieved a case-based sensitivity of 70%, 80%, and 85% for detection of malignant masses at average FP rates of 0.35, 0.75, and 0.95 FPs/image, respectively, on the test data set. In comparison to the average FP rates for the unilateral CAD system of 0.58, 1.33, and 1.63 FPs/image, respectively, at the corresponding sensitivities, the FP rates were reduced by 40%, 44%, and 42% with the bilateral symmetry information. The improvement in the overall detection accuracy is statistically significant (p<0.05) by JAFROC analysis. Our results demonstrate that the bilateral analysis can differentiate the similarity and dissimilarity between tissues at corresponding locations in the bilateral views and is useful for improving the performance of a unilateral CAD system by further reducing the FPs.
Acknowledgments
This work is supported by USPHS Grant No. CA95153 and U. S. Army Medical Research and Material Command Grant Nos. DAMD17-02-1-0214 and W81XWH-1-04-1-0475. The authors are grateful to Charles E. Metz, Ph.D., for the LABROC program, and to Dev Chakraborty, Ph.D., for the JAFROC program.
References
- 1.American Cancer Society. Statistics for 2004. www.cancer.org.
- 2.Smart CR, Hendrick RE, Rutledge JH, Smith RA. Benefit of mammography screening in women ages 40 to 49 years: current evidence from randomized controlled trials. Cancer. 1995;75:1619–1626. doi: 10.1002/1097-0142(19950401)75:7<1619::aid-cncr2820750711>3.0.co;2-t. [DOI] [PubMed] [Google Scholar]
- 3.Feig SA, D’Orsi CJ, Hendrick RE, Jackson VP, Kopans DB, Monsees B, Sickles EA, Stelling CB, Zinninger M, Wilcox-Buchalla P. American College of Radiology guidelines for breast cancer screening. AJR Am J Roentgenol. 1998;171:29–33. doi: 10.2214/ajr.171.1.9648758. [DOI] [PubMed] [Google Scholar]
- 4.Cady B, Michaelson JS. The life-sparing potential of mammographic screening. Cancer. 2001;91:1699–1703. doi: 10.1002/1097-0142(20010501)91:9<1699::aid-cncr1186>3.0.co;2-w. [DOI] [PubMed] [Google Scholar]
- 5.Tabar L, et al. Reduction in mortality from breast cancer after mass screening with mammography. Lancet. 1985;325:829–832. doi: 10.1016/s0140-6736(85)92204-4. [DOI] [PubMed] [Google Scholar]
- 6.Zuckerman HC. In: Breast Cancer, Diagnosis and Treatment. Ariel IM, Cleary JB, editors. McGraw-Hill; New York: 1987. [Google Scholar]
- 7.Beam CA, Layde PM, Sullivan DC. Variability in the interpretation of screening mammograms by US radiologists—Findings from a national sample. Arch Intern Med. 1996;156:209–213. [PubMed] [Google Scholar]
- 8.Birdwell RL, Ikeda DM, O’Shaughnessy KF, Sickles EA. Mammographic characteristics of 115 missed cancers later detected with screening mammography and the potential utility of computer-aided detection. Radiology. 2001;219:192–202. doi: 10.1148/radiology.219.1.r01ap16192. [DOI] [PubMed] [Google Scholar]
- 9.Elmore JG, Nakano CY, Koepsell TD, Desnick LM, D’Orsi CJ, Ransohoff DF. International variation in screening mammography interpretations in community-based programs. J Natl Cancer Inst. 2003;95:1384–1393. doi: 10.1093/jnci/djg048. [DOI] [PMC free article] [PubMed] [Google Scholar]
- 10.Warren Burhenne LJ, Wood SA, D’Orsi CJ, Feig SA, Kopans DB, O’Shaughnessy KF, Sickles EA, Tabar L, Vyborny CJ, Castellino RA. Potential contribution of computer-aided detection to the sensitivity of screening mammography. Radiology. 2000;215:554–562. doi: 10.1148/radiology.215.2.r00ma15554. [DOI] [PubMed] [Google Scholar]
- 11.Freer TW, Ulissey MJ. Screening mammography with computer-aided detection: Prospective study of 12,860 patients in a community breast center. Radiology. 2001;220:781–786. doi: 10.1148/radiol.2203001282. [DOI] [PubMed] [Google Scholar]
- 12.Brem RF, Baum JK, Lechner M, Kaplan S, Souders S, Naul LG, Hoffmeister J. Improvement in sensitivity of screening mammography with computer-aided detection: A multi-institutional trial. AJR Am J Roentgenol. 2003;181:687–693. doi: 10.2214/ajr.181.3.1810687. [DOI] [PubMed] [Google Scholar]
- 13.Destounis SV, DiNitto P, Logan-Young W, Bonaccio E, Zuley ML, Willison KM. Can computer-aided detection with double reading of screening mammograms help decrease the false-negative rate? Initial experience. Radiology. 2004;232:578–584. doi: 10.1148/radiol.2322030034. [DOI] [PubMed] [Google Scholar]
- 14.Chan HP, Doi K, Vyborny CJ, Schmidt RA, Metz CE, Lam KL, Ogura T, Wu Y, MacMahon H. Improvement in radiologists’ detection of clustered microcalcifications on mammograms. The potential of computer-aided diagnosis. Invest Radiol. 1990;25:1102–1110. doi: 10.1097/00004424-199010000-00006. [DOI] [PubMed] [Google Scholar]
- 15.Helvie MA, et al. Sensitivity of noncommercial computer-aided detection system for mammographic breast cancer detection—A pilot clinical trial. Radiology. 2004;231:208–214. doi: 10.1148/radiol.2311030429. [DOI] [PMC free article] [PubMed] [Google Scholar]
- 16.Hadjiiski L, Sahiner B, Chan HP, Petrick N, Helvie MA, Gurcan MN. Analysis of temporal change of mammographic features: Computer-aided classification of malignant and benign breast masses. Med Phys. 2001;28:2309–2317. doi: 10.1118/1.1412242. [DOI] [PubMed] [Google Scholar]
- 17.Paquerault S, Petrick N, Chan HP, Sahiner B, Helvie MA. Improvement of computerized mass detection on mammograms: Fusion of two-view information. Med Phys. 2002;29:238–247. doi: 10.1118/1.1446098. [DOI] [PubMed] [Google Scholar]
- 18.van Engeland S, Timp S, Karssemeijer N. Finding corresponding regions of interest in mediolateral oblique and craniocaudal mammographic views. Med Phys. 2006;33:3203–3212. doi: 10.1118/1.2230359. [DOI] [PubMed] [Google Scholar]
- 19.Yin FF, Giger ML, Doi K, Metz CE, Vyborny CJ, Schmidt RA. Computerized detection of masses in digital mammograms: Analysis of bilateral subtraction images. Med Phys. 1991;18:955–963. doi: 10.1118/1.596610. [DOI] [PubMed] [Google Scholar]
- 20.Mendez AJ, Tahoces PG, Lado MJ, Souto M, Vidal JJ. Computer-aided diagnosis: Automatic detection of malignant masses in digitized mammograms. Med Phys. 1998;25:957–964. doi: 10.1118/1.598274. [DOI] [PubMed] [Google Scholar]
- 21.Wu YT, Hadjiiski LM, Wei J, Zhou C, Sahiner B, Chan HP. Computer-aided detection of breast masses on mammograms: Bilateral analysis for false positive reduction. Proc SPIE. 2006;6144:211–217. [Google Scholar]
- 22.Zhou C, Chan HP, Petrick N, Helvie MA, Goodsitt MM, Sahiner B, Hadjiiski LM. Computerized image analysis: Estimation of breast density on mammograms. Med Phys. 2001;28:1056–1069. doi: 10.1118/1.1376640. [DOI] [PubMed] [Google Scholar]
- 23.Wei J, Chan HP, Sahiner B, Hadjiiski LM, Helvie MA, Roubidoux MA, Zhou C, Ge J. Dual system approach to computer-aided detection of breast masses on mammograms. Med Phys. 2006;33:4157–4168. doi: 10.1118/1.2357838. [DOI] [PMC free article] [PubMed] [Google Scholar]
- 24.Petrick N, Chan HP, Sahiner B, Helvie MA. Combined adaptive enhancement and region-growing segmentation of breast masses on digitized mammograms. Med Phys. 1999;26:1642–1654. doi: 10.1118/1.598658. [DOI] [PubMed] [Google Scholar]
- 25.Wei J, Sahiner B, Hadjiiski LM, Chan HP, Petrick N, Helvie MA, Roubidoux MA, Ge J, Zhou C. Computer aided detection of breast masses on full field digital mammograms. Med Phys. 2005;32:2827–2838. doi: 10.1118/1.1997327. [DOI] [PMC free article] [PubMed] [Google Scholar]
- 26.Haralick RM, Shanmugam K, Dinstein I. Texture features for image classification. IEEE Trans Syst Man Cybern SMC-3. 1973:610–621. [Google Scholar]
- 27.Kilday J, Palmieri F, Fox MD. Classifying mammographic lesions using computer-aided image analysis. IEEE Trans Med Imaging. 1993;12:664–669. doi: 10.1109/42.251116. [DOI] [PubMed] [Google Scholar]
- 28.Shen L, Rangayyan RM, Desautels JEL. Application of shape analysis to mammographic calcifications. IEEE Trans Med Imaging. 1994;13:263–274. doi: 10.1109/42.293919. [DOI] [PubMed] [Google Scholar]
- 29.Mori S, Nishida H, Yamada H. Optical Character Recognition. Wiley; New York: 1999. [Google Scholar]
- 30.Petrick N, Chan HP, Sahiner B, Helvie MA, Paquerault S, Hadjiiski LM. Breast cancer detection: Evalution of a mass detection algorithm for computer-aided diagnosis: Experience in 263 patients. Radiology. 2002;224:217–224. doi: 10.1148/radiol.2241011062. [DOI] [PubMed] [Google Scholar]
- 31.Metz CE, Herman BA, Shen JH. Maximum-likelihood estimation of receiver operating characteristic (ROC) curves from continuously-distributed data. Stat Med. 1998;17:1033–1053. doi: 10.1002/(sici)1097-0258(19980515)17:9<1033::aid-sim784>3.0.co;2-z. [DOI] [PubMed] [Google Scholar]
- 32.Chakraborty DP, Berbaum KS. Observer studies involving detection and localization: Modeling, analysis, and validation. Med Phys. 2004;31:2313–2330. doi: 10.1118/1.1769352. [DOI] [PubMed] [Google Scholar]
- 33.Sallam M, Bowyer K. In: Digital Mammography ’96. Doi K, Giger ML, Nishikawa RM, Schmidt RA, editors. Elsevier; Amsterdam: 1996. [Google Scholar]
- 34.Vujovic N, Brzakovic D. Establishing the correspondence between control points in pairs of mammographic images. IEEE Trans Image Process. 1997;6:1388–1399. doi: 10.1109/83.624955. [DOI] [PubMed] [Google Scholar]
- 35.Van Engeland S, Snoeren P, Hendriks J, Karssemeijer N. A comparison of methods for mammogram registration. IEEE Trans Med Imaging. 2003;22:1436–1444. doi: 10.1109/TMI.2003.819273. [DOI] [PubMed] [Google Scholar]
- 36.Hadjiiski LM, Chan HP, Sahiner B, Zhou C, Helvie MA, Roubidoux MA. Computerized regional registration of corresponding masses and microcalcification clusters on temporal pairs of mammograms for interval change analysis. The 89th Scientific Assembly and Annual Meeting of the Radiological Society of North America; Chicago, IL. November 30–December 5, 2003; p. 389. RSNA Program Book 2003 (RSNA, Oak Brook, 2003) [Google Scholar]


