Abstract
In this study, our purpose was to improve the performance of our mass detection system by using a new dual system approach which combines a computer-added detection (CAD) system optimized with “average” masses with another CAD system optimized with “subtle” masses. The two single CAD systems have similar image processing steps, which include prescreening, object segmentation, morphological and texture feature extraction, and false positive (FP) reduction by rule-based and linear discriminant analysis (LDA) classifiers. A feed-forward backpropagation artificial neural network was trained to merge the scores from the LDA classifiers in the two single CAD systems and differentiate true masses from normal tissue. For an unknown test mammogram, the two single CAD systems are applied to the image in parallel to detect suspicious objects. A total of three data sets were used for training and testing the systems. The first data set of 230 current mammograms, referred to as the average mass set, was collected from 115 patients. We also collected 264 mammograms, referred to as the subtle mass set, which were one to two years prior to the current exam from these patients. Both the average and the subtle mass sets were partitioned into two independent data sets in a cross validation training and testing scheme. A third data set containing 65 cases with 260 normal mammograms was used to estimate the FP marker rates during testing. When the single CAD system trained on the average mass set was applied to the test set with average masses, the FP marker rates were 2.2, 1.8, and 1.5 per image at the case-based sensitivities of 90%, 85%, and 80%, respectively. With the dual CAD system, the FP marker rates were reduced to 1.2, 0.9, and 0.7 per image, respectively, at the same case-based sensitivities. Statistically significant (p < 0.05) improvements on the free response receiver operating characteristic curves were observed when the dual system and the single system were compared using the test sets with either average masses or subtle masses.
Keywords: computer-aided detection (CAD), mass detection, mammogram, dual system, artificial neural network (ANN)
I. INTRODUCTION
Breast cancer is one of the leading causes of cancer mortality among women.1 It has been reported that early diagnosis and treatment can significantly improve the chance of survival for patients with breast cancer.2–4 At present, the most successful method for the early detection of breast cancer is screening mammography.5 Various methods are being developed to improve the accuracy of breast cancer detection. Double reading by radiologists can reduce the miss rate of radiographic reading. However, double reading will increase the cost of mammographic screening. An alternative method is to use a trained computer-aided detection (CAD) system as a second reader.6,7 Recent clinical studies have shown that CAD systems are helpful for increasing radiologists’ accuracy in detecting breast cancers.8–13
A large volume of literature has been published in the CAD area. CAD systems for mammography generally consist of two subsystems: one is a mass detection system and the other is a microcalcification detection system. Detection of masses on mammograms is often more challenging than detection of microcalcifications. The mass detection systems to-date have employed a single-system approach using various techniques for prescreening of mass candidates and classification of true and false positives.14–24 Our laboratory incorporated two-view mammographic information for improved differentiation of true masses and false positives and obtained promising preliminary results.22 However, development of new methods to improve the performance of mass detection systems remains an important area of CAD research.
The CAD systems developed so far have mostly used masses seen on current mammograms (i.e., the mammograms on which the masses were detected by radiologists) for training. An important purpose of a CAD system is that it is used as a second reader to alert radiologists to subtle cancers that may be overlooked. To study the ability of a CAD system in detecting subtle cancers that are likely to be missed by radiologists, one way is to evaluate its accuracy in detecting missed cancers on prior mammograms (i.e., the mammograms in previous examinations on which the mass or cancer can be seen retrospectively but was considered negative or benign at the time of the examination). Some researchers have investigated the performance change of CAD systems when using prior mammograms as input. In our study of mass detection on prior mammograms,25 we obtained a case-based sensitivity of 74% (20/27) of the malignant masses with 2.2 false positives (FPs) per image. te Brake et al.26 reported that their CAD system has a case-based sensitivity of 34% (22/65) of the cancers which have the appearance of masses or stellate lesions in the prior examinations with 1 FP per image. A commercial system (R2 ImageChecker) also reported detection of 42% (72/172) of the cancers in the prior years which were considered worthy of call-back in retrospect by expert mammographers with about 2 FP marks/case.27 Zheng et al.23 reported that their CAD system trained with current mammograms could not perform optimally in prior mammograms and vice versa; whereas the same system trained with prior mammograms can perform better on detecting the masses on prior mammograms. Recently, an assessment study28 was conducted to compare the performance of two commercial systems and one research CAD system on current mammograms and prior mammograms. The results showed that the true positive (TP) fraction for CAD systems on prior mammograms of 39 breasts with malignant masses ranged from 15% to 26% with 0.28 to 0.41 FP marks/image. Although the detection performance reported in the different studies vary, probably due to the differences in the data set used, these studies indicate that the sensitivities of current CAD systems in detecting subtle masses on prior mammograms are substantially lower than that obtained from detection on current mammograms. The difficulty in recognizing the subtle and possibly different features of the masses on priors compared to those of the masses on current mammograms may be one of the factors that causes oversight for both radiologists and the CAD systems.
The goal of pattern recognition is to achieve the best possible classification performance in the task at hand. Researchers had shown that, for a class of objects with a wide range of characteristics, the classification performance can be improved by using combination of classifiers whereby objects of certain characteristics are classified by one classifier using a set of features and objects of different characteristics by another classification scheme based on different features.29–35 The advantage of using combination of classifiers is that it may stabilize the training of classifiers even with a relatively small sample size because each classifier does not have to accommodate a wide range of characteristics and features.36,37 These observations motivated our interest in the design of a dual CAD system for mass detection.
Since the missed cancers on prior mammograms represent the difficult cases that are more likely to be missed by radiologists if similar cancers occur on screening mammograms, it is important to improve the sensitivity of the CAD system in detecting these cancers. On the other hand, when a CAD system is applied to a new mammogram in clinical practice, it has to detect breast lesions of all degrees of subtlety effectively. However, it is difficult to train a single CAD system to provide optimal detection for all lesions over the entire spectrum of subtlety because the classifiers have to make compromises to accommodate cancers of a wide range of characteristics. Therefore, we have been exploring a new dual CAD system approach that combines a CAD system trained with retrospectively seen masses on prior mammograms with a CAD system trained with masses detected on current mammograms.38,39 In this paper, we will describe the design of the dual CAD system and report our current results.
II. MATERIALS AND METHOD
A. Data sets
All mammograms in this study were collected from patient files in the Department of Radiology at the University of Michigan with Institutional Review Board (IRB) approval. The mammograms were digitized with a LUMISYS 85 laser film scanner with a pixel size of 50 μm × 50 μm and 4096 gray levels. The scanner was calibrated to have a linear relationship between gray levels and optical densities (O.D.) from 0.1 to greater than 3 O.D. units. The nominal O.D. range of the scanner is 0–4. The full resolution mammograms were first smoothed with a 2 × 2 box filter and subsampled by a factor of 2, resulting in 100 μm × 100 μm images. The images at a pixel size of 100 μm × 100 μm were used for the input of our CAD system.
We collected three data sets. The first data set contained 115 cases with confirmed masses. Each case included the current mammograms that prompted the radiologist to work up the mass. This is referred to as the “average” mass set. All of the cases in the average mass set had two mammographic views: the craniocaudal view and the mediolateral oblique view or the lateral view, thus yielding a total of 230 mammograms. There were 115 masses (67 malignant masses and 48 benign masses) in this data set, of which 105 were biopsy-proven and 10 were determined to be benign by long-term follow-up.
The second data set was composed of the prior mammograms dated one to two years earlier than the mammograms of the same patients in the average mass set. Since the masses on prior mammograms are on average subtler than those on current mammograms, this data set is referred to as the “subtle” mass set. On 5 of the 115 patients, no mass or focal density could be identified on either view of the prior mammograms. Therefore, the subtle mass set was composed of 110 cases (62 malignant and 48 benign). For the purpose of training the subtle mass detection system, the subtle masses do not have to be obtained from the same cases as the average mass set but we used the available prior mammograms for these mass cases in our database. Nineteen of the 110 cases had two prior mammogram examinations. Of the 129 examinations in the subtle mass set, 123 had two mammographic views and 6 had three views, with a total of 264 mammograms. Many of the subtle masses on the prior mammograms could be identified only as a focal density corresponding to the location of the subsequently detected mass on the current mammograms. On 44 of the two-view prior mammograms, the mass location was evident only on one view. Table I summarizes the information for the average and subtle mass subsets.
Table I.
Description of cases in the average and subtle mass data sets and the subsets for training and testing in the cross-validation scheme.
| Mass subset 1 |
Mass subset 2 |
|||
|---|---|---|---|---|
| Average mass subset | Subtle mass subset | Average mass subset | Subtle mass subset | |
| Total No. of cases | 57 | 54 | 58 | 56 |
| Cases with two prior examinations | NA | 10 | NA | 9 |
| Exams with two views | 57 | 58 | 58 | 65 |
| Exams with three views | 0 | 6 | 0 | 0 |
| Total No. of images | 114 | 134 | 116 | 130 |
| No. of negative images | 0 | 25 | 0 | 19 |
| No. of mass images for training | 114 | 109 | 116 | 111 |
| No. of two-view pairs for testing | 57 | 64 | 58 | 65 |
| No. of images for testing | 114 | 128 | 116 | 130 |
| No. of malignant masses | 36 | 33 | 31 | 29 |
| No. of benign masses | 21 | 21 | 27 | 27 |
The third data set was composed of 260 normal bilateral two-view mammograms obtained from 65 patients. No masses were evident on these mammograms upon review by the experienced radiologist.
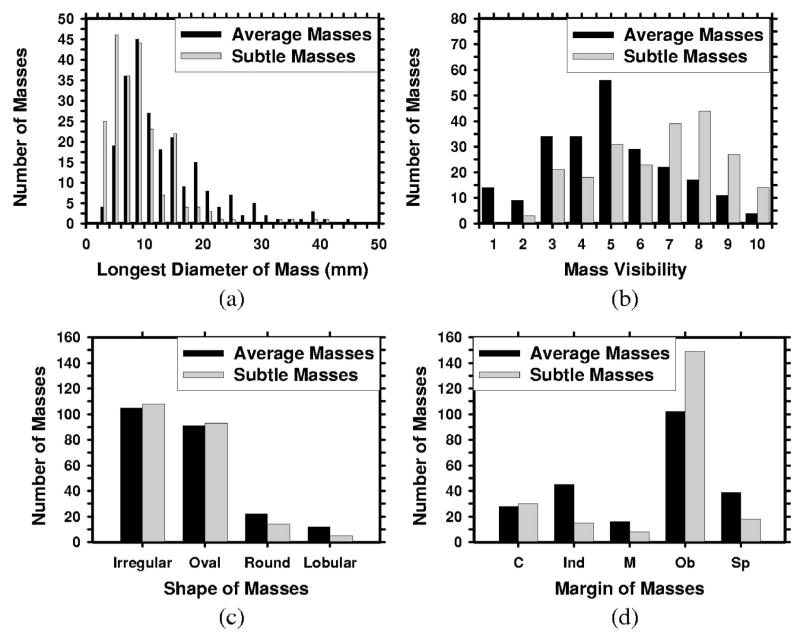
The two mass data sets were used to estimate the detection sensitivity and the normal data set was used for estimating the FP marker rate. For the mass data sets, the true locations of the masses were identified by an experienced MQSA radiologist using all available imaging and clinical information. The radiologist also provided an estimate of the longest diameter of the mass, descriptors of its margin and shape, a visibility rating, and an estimate of the breast density in terms of BI-RADS category. Figure 1 shows the distributions of mass sizes, mass shapes, mass margins, and their visibility on a 10-point rating scale with 1 representing the most visible masses and 10 the most difficult case relative to the cases seen in their clinical practice. The masses had a mean of 13.7 mm and a median of 12 mm in the average data set and a mean of 9.7 mm and a median of 10 mm in the subtle data set. Figure 2 shows the breast density for both the normal data set and the mass data sets. As can be seen from the distributions of the mass characteristics, the average masses on the current mammograms and the subtle masses on the priors had large overlap. Nevertheless, on average, the subtle masses were smaller in size and less conspicuous on the mammograms.
Fig. 1.
The characteristics of the masses in our mass data set: (a) distribution of mass sizes, (b) distribution of mass visibility on a 10-point rating scale with 1 representing the most visible masses and 10 the most subtle masses relative to the cases seen in clinical practice, (c) distribution of mass shapes, (d) distribution of mass margins, C: circumscribed, Ind: indistinct, M: microlobulated, Ob: obscured, Sp: spiculated.
Fig. 2.
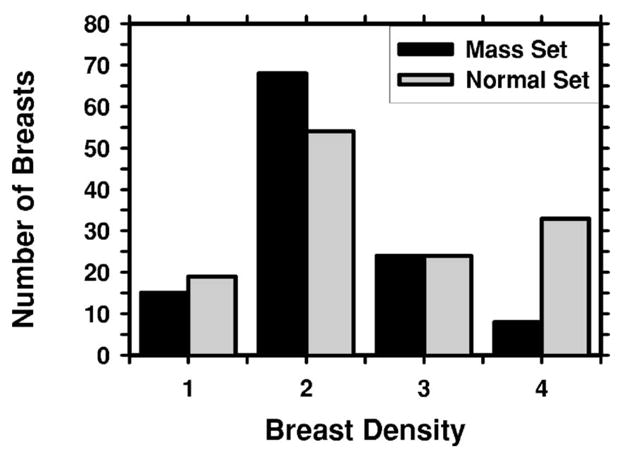
The distribution of breast density in terms of BI-RADS categories estimated by an MQSA radiologist.
B. Methods
In order to improve the sensitivity of detecting breast lesions of all degrees of subtlety, we developed a new dual system approach which combines a system trained with average masses with another system trained with subtle masses. When the trained dual system is applied to an unknown mammogram, the two CAD systems are used in parallel to detect suspicious objects on a single mammogram. No prior mammogram is needed. The additional FPs from the use of the two systems are reduced by an information fusion stage. We will refer to the two systems separately trained with the average masses and the subtle masses as “single” CAD systems in the following discussions.
We randomly separated the mass data sets by case into two independent subsets. Both the average and subtle mass subsets followed the same case grouping so that mammograms from the same case would not be separated into the training subset for one single CAD system and the test subset for the other single CAD system in a cross-validation cycle. Table I shows the subsets of cases in the average and subtle mass data sets. Two-fold cross validation was used for training and testing the algorithms. The training included selecting proper parameters for each single CAD system and for information fusion. Once the training with one mass subset was completed, the parameters were fixed for testing with the other mass subset. The training and test mass subsets were switched and the training and test processes were repeated. The CAD systems were trained with single mammograms. To maximize the number of training images with masses, all images with a visible mass were included regardless of whether they were a part of a two-view or three-view case when the subtle mass subset was used as a training set. However, when the subtle mass subset was used as a test set, only two views were included for each case because we used two-view mammograms to derive the case-based test performance. For cases containing three views, we therefore included only two of the views in testing. We also included cases with the mass visible on only one of the two views. After the two-fold cross validation testing, the overall detection performance was evaluated by combining the performances of the two test subsets. The trained algorithms with the fixed parameters were also applied to the normal set of mammograms, which was not used during training, to estimate the FP rate in screening mammograms.
1. Single CAD system overview
The major steps in the two single mass detection systems are similar but the feature spaces and classifiers for FP reduction in each system were designed separately to suit the characteristics of average and subtle masses, respectively. The two systems are therefore described together in the following but the differences will be pointed out whenever applicable. Each single CAD system consists of four processing steps: (1) prescreening of mass candidates, (2) segmentation of suspicious objects, (3) feature extraction and analysis, and (4) FP reduction by classification of normal tissue structures and masses. The block diagram for the detection scheme is shown in Fig. 3.
Fig. 3.
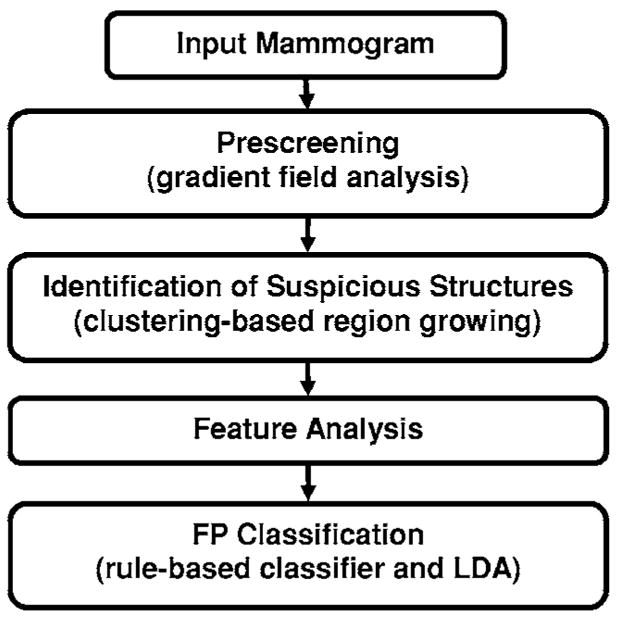
Schematic diagram of our single CAD system for mass detection. The FP classification stage includes rule-based classification, a morphological LDA classifier, and a texture feature LDA classifier for differentiating masses from normal breast tissues.
For the prescreening stage, we have developed a two-stage gradient field analysis method which not only uses the shape information of masses on mammograms but also incorporates the gray level information of the local object segmented by a region growing technique in the second stage to refine the gradient field analysis.24,40 Locations of high radial gradient convergence are labeled as mass candidates. After prescreening, the suspicious objects are identified by using a two-stage segmentation method.41 First, the background-corrected ROI is weighted by a two-dimensional Gaussian function with σ=256 pixels to enhance the central region. Sobel filtering is then applied to the Gaussian-weighted ROI to generate another enhanced image. Second, a k-means clustering using the pixel values from these two images as features is used to segment the object. For each suspicious object, eleven morphological features21 were extracted. Rule-based and linear discriminant classifiers were trained by using the training data set only to remove the detected structures that were substantially different from breast masses. For the system trained with average masses, global and local multiresolution texture analysis42 were performed in each ROI by using the spatial gray level dependence (SGLD) matrices. A total of 364 features were extracted from global texture analysis. Local texture features were extracted from the local region containing the detected object and the peripheral regions within each ROI. A total of 208 features were extracted for local texture analysis. For the system trained with subtle masses, instead of the SGLD texture features, gray level features and run length statistics analysis (RLS) texture features43 were extracted inside and outside of each mass region on the original image and gradient field image. The gray level features included the contrast of the object relative to the surrounding background, the minimum and the maximum gray levels, and the characteristics derived from the gray level histogram in the regions inside and outside of each object including skewness, kurtosis, energy, and entropy. Five RLS texture features were extracted in both the horizontal and vertical directions: short runs emphasis, long runs emphasis, gray level nonuniformity, run length nonuniformity, and run percentage. A total of 66 features were extracted for the system trained with subtle masses.
In order to obtain the best texture feature subset and also reduce the dimensionality of the feature space to design an effective classifier, stepwise feature selection with linear discriminant analysis (LDA) was applied to the training subset. The detailed procedure has been described elsewhere.24,44,45 Briefly, at each step one feature was entered or removed from the feature pool by analyzing its effect on the selection criterion, which was chosen to be the Wilks’ lambda in this study. Since the appropriate values of thresholds for feature entry, feature elimination, and tolerance of correlation for feature selection were unknown, we used an automated simplex optimization method to search for the best combination of thresholds in the parameter space. The simplex algorithm used a leave-one-case-out resampling method within the training subset to select features and estimate the weights for the LDA classifier. To have a figure-of-merit to guide feature selection, the test discriminant scores from the left-out cases were analyzed using receiver operating characteristic (ROC) methodology.46 The accuracy for classification of masses and FPs was evaluated as the area under the ROC curve, Az. In this approach, feature selection was performed without the left-out case so that the test performance would be less optimistically biased.47 However, the selected feature set in each leave-one-case-out cycle could be slightly different because every cycle had one training case different from the other cycles. In order to obtain a single trained classifier to apply to the independent test subset, a final stepwise feature selection was performed with the best combination of thresholds, found in the simplex optimization procedure, on the entire training subset to obtain the final set of features and estimate the weights of the LDA. Note that the entire process of feature selection and classifier weight estimation was performed within the training subset. The LDA classifier with the selected feature set was then fixed and applied to the independent test subset. The training and testing processes were performed independently for the two-fold cross-validation sets.
2. Training and test for dual system
The block diagram for the dual system is shown in Fig. 4. During the training of the dual system, we used the current and prior mammograms from the same patients. The current mammograms that contained the average masses were only used to train the first single CAD system. The prior mammograms that contained the subtle masses were only used to train the second single CAD system. The prescreening and the segmentation steps in the two systems are identical. Since the morphological appearances of average and subtle masses are different, the rules in the morphological rule-based FP classification are trained differently for the two single CAD systems. During testing with an independent mammogram, the dual system keeps all the suspicious objects that satisfy the FP classification rules of either single CAD system and applies the LDA classifiers from both single systems to each object. Each object thus has two LDA scores.
Fig. 4.
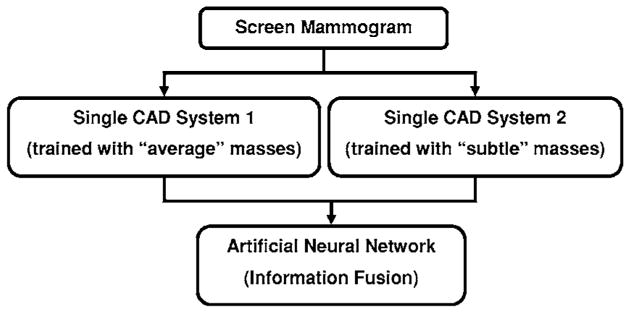
Schematic diagram of proposed dual CAD system for mass detection. BP-ANN is used for information fusion.
To merge the information from the two CAD systems, a fusion scheme was developed for our dual system. In this study, a feed-forward backpropagation artificial neural network (BP-ANN) was trained to classify the masses from normal tissues by combining the output information from the two single CAD systems. The LDA classifiers from the two single CAD systems were applied to each detected object. The two LDA discriminant scores for each object were used as input to the BP-ANN. The BP-ANN had an input layer with two nodes, a hidden layer with N nodes, and an output layer with one node. The nodes were interconnected by weights and information propagated from one layer to the next through a log-sigmoidal activation function. The learning of the ANN was a supervised process in which known training cases were input to the ANN. The performance function for the network was the mean-squared error between the network outputs and the target outputs. The weights of the network were adjusted iteratively by a feedforward back-propagation procedure to minimize the error. Detailed description of the backpropagation neural network can be found in the literature.48,49
To choose the number of hidden nodes (N) in the BP-ANN, we used a three-fold cross-validation method within the training subset. We randomly separated the entire training subset including all detected objects into three independent groups. The objects belonging to the same case were separated into the same group. For a given N, three training cycles were performed, in each of which two of the three groups were used to train the BP-ANN and the left-out group was used to test its performance. The Az value obtained from the ANN output scores for the test group was used as the performance index for that training cycle. The average of the Az values from the three test groups represented the performance of the BP-ANN with N hidden nodes. In our experiment, a BP-ANN with 3 hidden nodes provided the largest average Az value and was therefore chosen. The weights of the chosen BP-ANN were retrained with the entire training subset. The BP-ANN with the trained weights was used to merge the information from the two single CAD systems.
To test the dual system, the two trained single CAD systems, one trained with the average mass set and the other with the subtle mass set, were applied in parallel to each single “unknown” mammogram in the independent test subset. No prior mammogram was needed during testing.
3. Evaluation methods
The detected individual objects were compared with the “truth” ROI marked by the experienced radiologist, as described earlier. A detected object was scored as TP if the overlap between the bounding box of the detected object and the bounding box of the true mass relative to the larger of the two bounding boxes was over 25%. Otherwise, it would be scored as FP. The 25% threshold was selected as described in our previous study.21
The FP marker rate was estimated in two ways: one from detection on the same test subsets with masses, the other from detection on the normal data set of negative mammograms. For the latter, we applied the trained dual CAD system to the normal data set. The number of FP marks produced by the CAD system was determined by counting the detected objects on the normal cases. The mass detection sensitivity was determined by counting the detected masses on the test mass subset. The detection performance of the CAD system was assessed by free response ROC (FROC) analysis. A FROC curve was obtained by plotting the mass detection sensitivity as a function of FP marks per image either obtained from the mass data subset or the normal set at the corresponding decision threshold.
FROC curves were presented on a per-mammogram and a per-case basis. For image-based FROC analysis, the mass on each mammogram was considered an independent true object. For case-based FROC analysis, the same mass imaged on the two-view mammograms was considered to be one true object and detection of either or both masses on the two views was considered to be a TP detection.
Since we used two-fold cross validation method for training and testing, we obtained two test FROC curves, one for each test subset, for each of the conditions (e.g., single CAD system approach or dual system approach). To summarize the results for comparison, an average test FROC curve was derived by averaging the FP rates at the same sensitivity along the FROC curves of the two corresponding test subsets.
In order to compare the performance of the single CAD system and the dual CAD system, we applied the alternative free-response ROC (AFROC) method and the jackknife free-response ROC (JAFROC) method developed by Chakraborty et al.50,51 to the pairs of FROC curves. In the AFROC method, the FROC data are first transformed by counting the number of false-positive images (FPIs) instead of the FPs per image. The confidence rating of a FPI is determined by the highest confidence FP decision on the image regardless of how many lower confidence FP decisions are made on the same image. The ROCKIT curve fitting software and statistical significance tests for ROC analysis developed by Metz et al.46 can then be used to analyze the AFROC data.
III. RESULTS
Figure 5 shows an example of the two-dimensional feature space that was used as the input to the BP-ANN being trained to merge the information from the two single CAD subsystems. The two features are the output scores of the LDA classifiers trained with the average masses and with the subtle masses. The correlation coefficients of the two features are 0.46 and 0.44 for each of the training subsets, respectively. The low correlation indicated that the two single CAD systems extracted relatively independent features from the object. The Az values of the chosen ANN were 0.92±0.01 and 0.87±0.01, respectively, as estimated by validation in the training process. The ANN classifiers achieved Az values of 0.90±0.02 and 0.89±0.01 on the two independent test subsets, respectively. Figure 6 shows the ROC curves for the two test subsets.
Fig. 5.
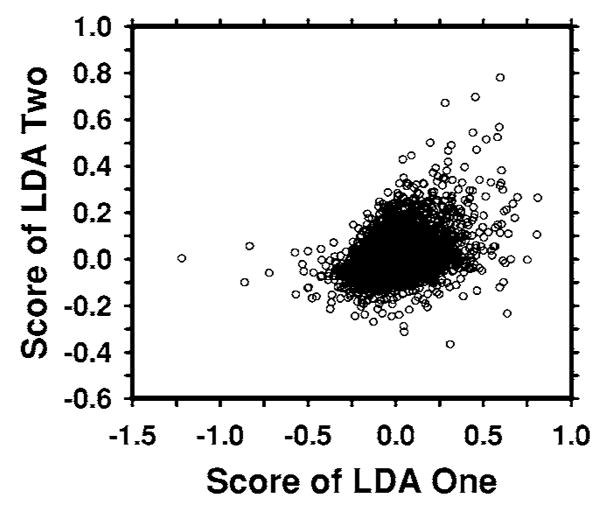
An example of a scatter plot of the LDA scores from the two single CAD systems which are used as input to the BP-ANN. The correlation coefficient between the scores of two LDA classifiers is 0.46, indicating that the two LDA scores are essentially independent features.
Fig. 6.
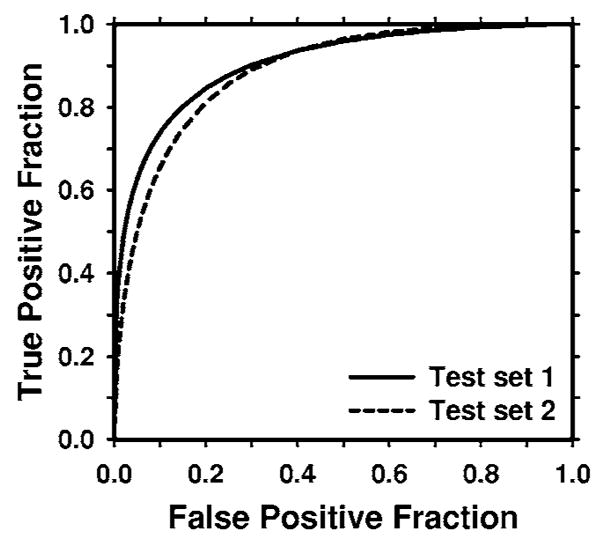
The test ROC curves for the BP-ANN classifiers from the two independent mass subsets. The ANN classifiers achieved an Az value of 0.90±0.02 for test subset 1 and 0.89±0.01 for test subset 2 in the classification of mass and normal breast tissues.
In order to evaluate the effectiveness of our dual system approach, we compared its performance on the test subsets containing average masses with two other single CAD systems: the CAD system trained only on the average mass set and the CAD system trained on both the average and the subtle mass sets. When a single CAD system was trained only with the average masses, the number of selected features was 21 (14 global and 7 local) and 16 (10 global and 6 local) texture features for the two independent training subsets, respectively. When the CAD system was trained with both the average and the subtle masses, the number of selected features was 17 (11 global and 6 local) and 18 (7 global and 11 local) texture features for the two independent training subsets, respectively.
For the dual system, the single system trained with the average masses was the same as that described earlier. For the single system trained with subtle masses, four (2 gray level and 2 RLS texture) and five (3 gray level and 2 RLS texture) features were selected for the two independent training subsets, respectively.
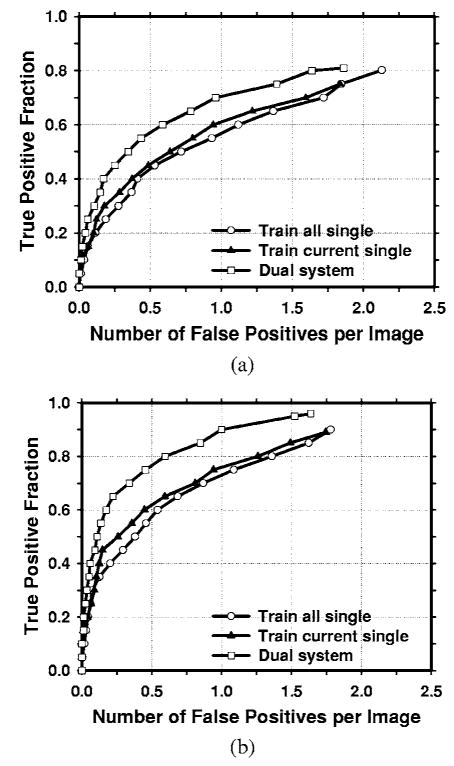
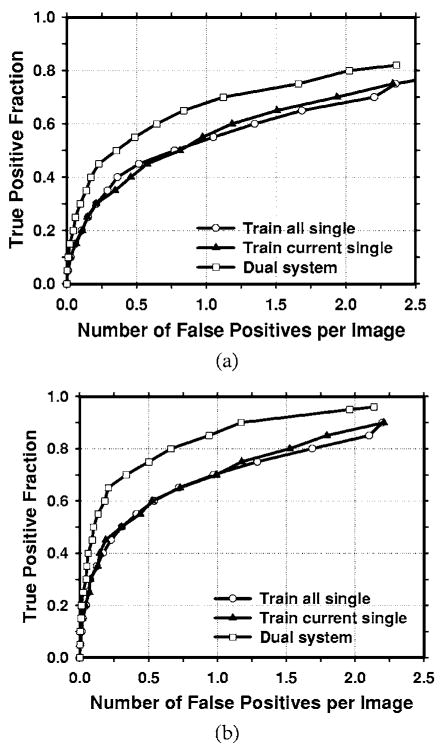
The average test FROC curves of the dual CAD system on the test subsets with average masses were compared to those of the single CAD systems in Fig. 7. The FP rates were estimated from the mass data set. The dual CAD system achieved a case-based sensitivity of 80%, 85%, and 90% at 0.6, 0.8, and 1.0 FPs/image, respectively, compared with 1.3, 1.5, and 1.8 FPs/image on the single CAD system trained with average masses alone. The performance of the single CAD system trained with both the average masses and the subtle masses was comparable to that trained with average masses alone, with FP rates of 1.4, 1.6, and 1.8 FPs/image at the same sensitivities, respectively. Figure 8 shows the comparison of the three average test FROC curves, similar to those shown in Fig. 7, except that the FP rates were estimated from the normal data set. The FP rates at a few selected sensitivities for the dual and single CAD systems were summarized in Table II.
Fig. 7.
Comparison of the average test FROC curves obtained from averaging the FROC curves of the two independent average-mass subsets. Three CAD systems were compared: a single CAD system trained with average masses alone, a single CAD system trained with both the average and the subtle masses, and the dual CAD system. The FP rate was estimated from the mammograms with masses. (a) Image-based FROC curves, (b) case-based FROC curves.
Fig. 8.
Comparison of the average test FROC curves obtained from averaging the FROC curves of the two independent average-mass subsets. Three CAD systems were compared: a single CAD system trained with average masses only, a single CAD system trained with the average and the subtle masses, and the dual CAD system. The FP rate was estimated from the mammograms without masses. (a) Image-based FROC curves, (b) case-based FROC curves.
Table II.
Comparison of case-based detection performance between the dual system and the single CAD system trained with average masses alone. The FP marker rates were estimated from detection on the normal data set. The FROC curves were obtained by averaging the FROC curves of the two test subsets.
| Average mass test set (FP marks/image) |
Subtle mass test set (FP marks/image) |
|||
|---|---|---|---|---|
| TP | Single system | Dual system | Single system | Dual system |
| 90% | 2.2 | 1.2 | ||
| 80% | 1.5 | 0.7 | 2.8 | |
| 70% | 1.0 | 0.3 | 2.4 | 2.3 |
| 60% | 0.5 | 0.2 | 1.8 | 1.5 |
| 50% | 0.3 | 0.1 | 1.4 | 0.7 |
In this study, we have 67 malignant cases in the average mass set. Figure 9 compares the average test FROC curves of the single CAD system and the dual system for detection of malignant masses. The result for the single CAD system trained with average masses was shown and the FP rate was estimated from the mammograms without masses. In this case, the dual CAD system achieved a case-based sensitivity of 80%, 85%, and 90% at 0.6, 0.9, and 1.2 FP marks/image, respectively, compared with 1.1, 1.6, and 2.0 FP marks/image on the single CAD system.
Fig. 9.
Comparison of the average test FROC curves of the single CAD system and the dual CAD system for detection of malignant masses in the average data set. The single system trained with average masses alone was used and the FP rate was estimated from the mammograms without masses. (a) Image-based FROC curves, (b) case-based FROC curves.
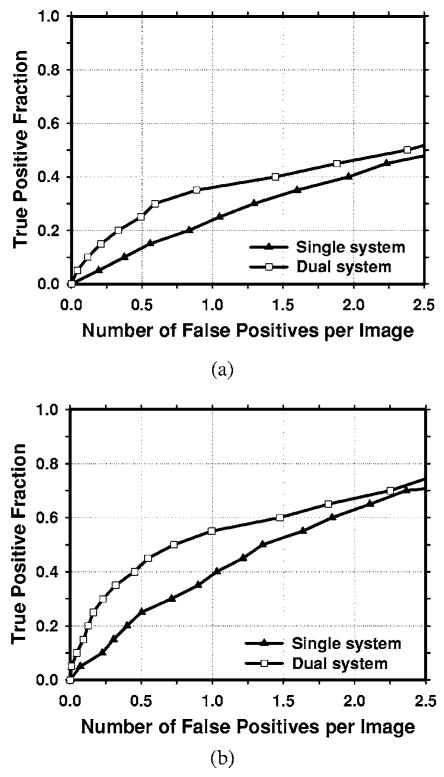
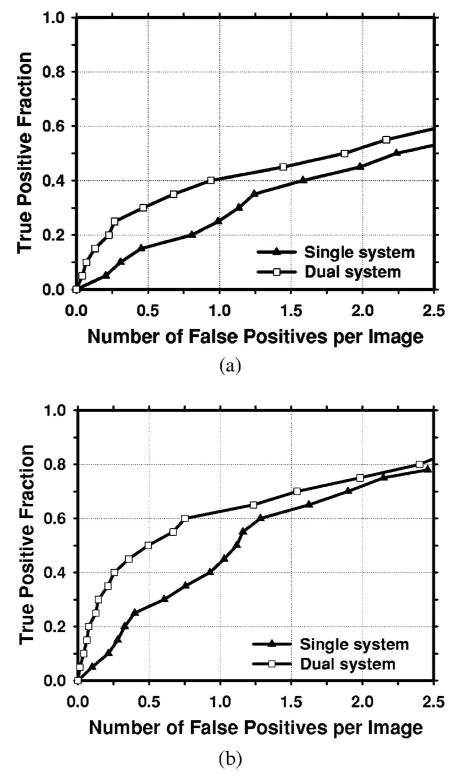
An important purpose of a CAD system is to serve as a second reader to alert radiologists to subtle cancers that may be overlooked. Figures 10 and 11 compare the average FROC curves of the single CAD system and the dual system for detection in the test subsets with subtle masses. The TP rate in Fig. 10 was estimated by including both malignant and benign masses and that in Fig. 11 was estimated from malignant masses only. The single CAD system trained with average masses alone was used. The FP rates for both systems were estimated from the mammograms without masses. The dual CAD system achieved a case-based sensitivity of 50% at 0.7 FP marks/image for all masses and at 0.5 FP marks/image for malignant masses only, compared with 1.4 FP marks/image for all masses and 1.1 FP marks/image for malignant masses only using the single CAD system.
Fig. 10.
Comparison of the average test FROC curves for the single CAD system and the dual CAD system for detection of the subtle masses on the prior mammograms. The single CAD system trained with average masses alone was used and the FP rate was estimated from the mammograms without masses. (a) Image-based FROC curves, (b) case-based FROC curves.
Fig. 11.
Comparison of the average test FROC curves for the single CAD system and the dual CAD system for detection of subtle malignant masses on the prior mammograms. The single CAD system trained with average masses alone was used and the FP rate was estimated from the mammograms without masses. (a) Image-based FROC curves, (b) case-based FROC curves.
Table II summarizes the test results on the average and subtle mass sets for the dual system and the single CAD system trained with average masses at different sensitivity levels. The FP marker rates were estimated from the detection on the normal data set.
The comparison of the FROC curves for the dual CAD system and the single CAD system in terms of the area under the fitted AFROC curve (A1) and the p values for both test subsets with average masses was summarized in Table III. The differences between the A1 values for the two systems were statistically significant (p<0.05). The fitted AFROC curves, however, did not fit very well to the transformed AFROC data, as we discussed previously.24 For the JAFROC method, Chakraborty et al. provided software to estimate the statistical significance of the difference between two FROC curves. The comparison of the figure-of-merit (FOM) and the p values was also summarized in Table III. The differences between the FOM of the dual CAD system and that of the single CAD system for both test subsets were again statistically significant (p<0.05).
Table III.
Estimation of the statistical significance in the difference between the FROC performance of the dual system and the single CAD system trained with average masses alone when the systems were evaluated on the average mass test subsets. The FROC curves with the FP marker rates obtained from the normal data set were compared.
|
A1 (AFROC) |
FOM (JAFROC) |
|||||||
|---|---|---|---|---|---|---|---|---|
| All cases |
Malignant cases |
All cases |
Malignant cases |
|||||
| Test subset 1 | Test subset 2 | Test subset 1 | Test subset 2 | Test subset 1 | Test subset 2 | Test subset 1 | Test subset 2 | |
| Single system | 0.45 | 0.44 | 0.47 | 0.52 | 0.48 | 0.48 | 0.53 | 0.55 |
| Dual system | 0.55 | 0.53 | 0.58 | 0.62 | 0.60 | 0.56 | 0.63 | 0.64 |
| p values | 0.0004 | 0.0156 | 0.0003 | 0.0318 | <0.0001 | 0.007 | 0.0004 | 0.0252 |
The comparison of A1, the FOM, and the p values for the dual system and the single system trained with average masses in detecting subtle masses was summarized in Table IV. It was found that the differences between the results of the dual CAD system and those of the single CAD system on the two test subsets containing subtle masses were statistically significant by both the JAFROC and the AFROC methods.
Table IV.
Estimation of the statistical significance in the difference between the FROC performance of the dual system and the single CAD system trained with average masses alone when the systems were evaluated on the subtle mass test subsets. The FROC curves with the FP marker rates obtained from the normal data set were compared.
|
A1 (AFROC) |
FOM (JAFROC) |
|||||||
|---|---|---|---|---|---|---|---|---|
| All cases |
Malignant cases |
All cases |
Malignant cases |
|||||
| Test subset 1 | Test subset 2 | Test subset 1 | Test subset 2 | Test subset 1 | Test subset 2 | Test subset 1 | Test subset 2 | |
| Single system | 0.17 | 0.20 | 0.24 | 0.25 | 0.21 | 0.23 | 0.24 | 0.26 |
| Dual system | 0.28 | 0.25 | 0.35 | 0.34 | 0.30 | 0.28 | 0.36 | 0.34 |
| p values | <0.0001 | 0.046 | <0.0001 | 0.0067 | 0.0007 | 0.048 | <0.0001 | 0.0035 |
IV. DISCUSSION
The masses on prior mammograms are more subtle and more difficult to detect than the masses on current mammograms. In this study, we developed a dual CAD system, which combines a system trained with masses on prior mammograms and a system trained with masses detected on current mammograms. We have demonstrated that this dual system can increase the accuracy of detecting both average masses and subtle masses. The comparisons of the dual system with that of the single CAD system trained with average masses alone and that of the single CAD system trained with both average and subtle masses (Fig. 7) indicate that the gain in the detection accuracy of the dual system could not be achieved by simply using a larger training set with both average and subtle masses. In fact, it is interesting to note that the performance of the single CAD system trained with both the average and the subtle masses appeared to be degraded slightly, in comparison with the single system trained with average masses alone, when it was applied to the test set of average masses. The decreased performance may reflect the compromise made when the single CAD system was trained to accommodate a wide range of lesion characteristics. Thus, the dual system approach may have improved its performance through other factors, including the flexibility in using different feature spaces and training the parameters for each type of masses and the information fusion combining the two single CAD systems effectively.
For the comparison of the different systems, we analyzed the false negatives (FNs) of the single CAD systems and the dual CAD system when the test subsets with average masses were used. It was found that the FN rates of the single CAD system trained with average masses, the single CAD system trained with subtle masses, and the dual system were 23.9% (55/230), 28.3% (65/230), and 16.5% (38/230), respectively, after FP reduction by the morphological LDA classifier in each system. Twenty-nine masses were missed by both of the single systems. By using the dual system, 53 masses that were FNs for either single system could be detected. However, the masses that were missed by both of the single CAD systems could not be recovered by the dual CAD system.
Our motivation of this study is to improve the performance of a CAD system for mass detection. A CAD detection system is generally intended for use in screening mammography. At the screening stage, all lesions of concern should be pointed out to radiologists so that the radiologists can judge if a recall is warranted. If a detection system is trained to mark only the malignant lesions, it may be attempting to play the role of a triage system (alerting radiologists to work up only “malignant” cases) rather than that of a second reader. Furthermore, since computerized lesion detection or characterization on mammograms is not 100% sensitive, it will be confusing to the radiologists whether an unmarked suspicious lesion is missed or it is considered benign by the computer. We believe that computer-aided diagnosis (CADx) may be used in different ways in conjunction with a CAD detection system, for example, the likelihood of malignancy may be estimated by the CADx system and displayed for every detected lesion, and/or a CADx system may be used during diagnostic workup. Either way the CAD system will first alert radiologists to all masses, leaving the assessment of malignancy or benignity to a second stage and with the radiologist being the primary decision maker. The training set thus included both malignant and benign masses.
For a CAD system, its performance for detecting malignant masses is more important than its performance for detecting all masses. The FROC curves for detection of malignant masses on the average data set and the subtle data set, shown in Figs. 9 and 11, respectively, indicated that the dual system could also achieve an improvement in the detection performance over that of the single system. The differences in the A1 and the FOM for the detection of malignant cases in the average and subtle mass test subsets were statistically significant, as shown in Tables III and IV, respectively.
In screening mammography, the cancer rate is 3–5 per 1000. Most of the mammograms are normal. Therefore, some CAD researchers and users estimate the FP rate using normal mammograms52–54 because it reflects how the CAD system performs in terms of specificity and whether the CAD system may cause extra efforts for radiologists to double check the marked locations or unnecessary recalls in a screening setting. Furthermore, for CAD systems that set a maximum number of detected objects at the output, estimating the number of FPs using images with lesions can potentially lead to an optimistic bias for the FROC curve because one of the detected objects will likely be the true lesion. The FP rate can thus be underestimated by as much as 1 per image. In addition, the JAFROC analysis requires that the FP rates be estimated on normal images. We therefore reported the FP rates of our CAD systems on both mammograms with masses and without masses to facilitate comparison with other CAD systems in case investigators may evaluate their FP rates in either way.
In this study, we evaluated the performance of the trained CAD systems with an independent test set using the two-fold cross validation method. Although the selection of parameters and features was performed using the training set, we had full knowledge of the performance for the test set so that the selections could be optimistically biased. True independent testing will have to be performed with unknown cases that have never been used for testing the CAD system before, such as those in a prospective clinical trial. However, this test step is beyond the scope of our current developmental process. Since we used the same cross-validation method for evaluation of the dual system and the single CAD systems, the comparison of their relative performances is expected to be less biased than their individual performances.
V. CONCLUSION
We have proposed a new dual system approach which combines a system trained with subtle masses on prior mammograms and a system trained with average masses on current mammograms. The dual system achieved higher sensitivities at the corresponding FP rates than a single CAD system trained with average masses alone or trained with both average masses and subtle masses. Alternatively, the dual system had lower FP rates than the single CAD system at corresponding sensitivities. The improvement in the FROC curves by the dual system approach was found to be statistically significant (p<0.05) for both average masses and subtle masses using either the AFROC or the JAFROC method. Our results indicate that the dual system approach is promising for improving the performance of CAD systems for mass detection on mammograms.
Acknowledgments
This work is supported by U. S. Army Medical Research and Materiel Command Grant Nos. W81XWH-1-04-1-0475, DAMD 17-02-1-0214, and USPHS Grant No. CA95153. The content of this paper does not necessarily reflect the position of the government and no official endorsement of any equipment and product of any companies mentioned should be inferred. The authors are grateful to Charles E. Metz, Ph.D., for the LABROC program and to Dev Chakraborty, Ph.D., for the JAFROC program.
References
- 1.American Cancer Society, www.cancer.org, “Statistics for 2005.”
- 2.Smart CR, Hendrick RE, Rutledge JH, Smith RA. Benefit of mammography screening in women ages 40 to 49 years: Current evidence from randomized controlled trials. Cancer. 1995;75:1619–1626. doi: 10.1002/1097-0142(19950401)75:7<1619::aid-cncr2820750711>3.0.co;2-t. [DOI] [PubMed] [Google Scholar]
- 3.Feig SA, D’Orsi CJ, Hendrick RE, Jackson VP, Kopans DB, Monsees B, Sickles EA, Stelling CB, Zinninger M, Wilcox-Buchalla P. American College of Radiology guidelines for breast cancer screening. AJR, Am J Roentgenol. 1998;171:29–33. doi: 10.2214/ajr.171.1.9648758. [DOI] [PubMed] [Google Scholar]
- 4.Cady B, Michaelson JS. The life-sparing potential of mammographic screening. Cancer. 2001;91:1699–1703. doi: 10.1002/1097-0142(20010501)91:9<1699::aid-cncr1186>3.0.co;2-w. [DOI] [PubMed] [Google Scholar]
- 5.Zuckerman HC. The role of mammography in the diagnosis of breast cancer. In: Ariel IM, Cleary JB, editors. Breast Cancer, Diagnosis and Treatment. McGraw-Hill; New York: 1987. [Google Scholar]
- 6.Shtern F, Stelling C, Goldberg B, Hawkins R. Novel technologies in breast imaging: National Cancer Institute perspective; Orlando, FL. [Google Scholar]
- 7.Vyborny CJ. Can computers help radiologists read mammograms? Radiology. 1994;191:315–317. doi: 10.1148/radiology.191.2.8153298. [DOI] [PubMed] [Google Scholar]
- 8.Freer TW, Ulissey MJ. Screening mammography with computer-aided detection: Prospective study of 12,860 patients in a community breast center. Radiology. 2001;220:781–786. doi: 10.1148/radiol.2203001282. [DOI] [PubMed] [Google Scholar]
- 9.Helvie MA, Hadjiiski LM, Makariou E, Chan HP, Petrick N, Sahiner B, Lo SCB, Freedman M, Adler D, Bailey J, et al. Sensitivity of noncommercial computer-aided detection system for mammographic breast cancer detection—A pilot clinical trial. Radiology. 2004;231:208–214. doi: 10.1148/radiol.2311030429. [DOI] [PMC free article] [PubMed] [Google Scholar]
- 10.Birdwell RL, Bandodkar P, Ikeda DM. Computer-aided detection with screening mammography in a university hospital setting. Radiology. 2005;236:451–457. doi: 10.1148/radiol.2362040864. [DOI] [PubMed] [Google Scholar]
- 11.Gur D, Sumkin JH, Rockette HE, Ganott MA, Hakim C, Hardesty LA, Poller WR, Shah R, Wallace L. Changes in breast cancer detection and mammography recall rates after the introduction of a computer-aided detection system. J Natl Cancer Inst. 2004;96:185–190. doi: 10.1093/jnci/djh067. [DOI] [PubMed] [Google Scholar]
- 12.Feig SA, Sickles EA, Evans WP, Linver MN. Re. Changes in breast cancer detection and mammography recall rates after the introduction of a computer-aided detection system. J Natl Cancer Inst. 2004;96:1260–1261. doi: 10.1093/jnci/djh257. [DOI] [PubMed] [Google Scholar]
- 13.Cupples TE. Impact of computer-aided detection (CAD)in a regional screening mammography program. Radiology. 2001;221(P):520. doi: 10.2214/AJR.04.1300. [DOI] [PubMed] [Google Scholar]
- 14.Ng SL, Bischof WF. Automated detection and classification of breast tumors. Comput Biomed Res. 1992;25:218–237. doi: 10.1016/0010-4809(92)90040-h. [DOI] [PubMed] [Google Scholar]
- 15.Petrick N, Chan HP, Wei D, Sahiner B, Helvie MA, Adler DD. Automated detection of breast masses on mammograms using adaptive contrast enhancement and texture classification. Med Phys. 1996;23:1685–1696. doi: 10.1118/1.597756. [DOI] [PubMed] [Google Scholar]
- 16.Zheng B, Chang YH, Gur D. Computerized detection of masses in digitized mammograms using single-image segmentation and a multilayer topographic feature analysis. Acad Radiol. 1995;2:959–966. doi: 10.1016/s1076-6332(05)80696-8. [DOI] [PubMed] [Google Scholar]
- 17.Karssemeijer N, te Brake G. Detection of stellate distortions in mammograms. IEEE Trans Med Imaging. 1996;15:611–619. doi: 10.1109/42.538938. [DOI] [PubMed] [Google Scholar]
- 18.Kobatake H, Yoshinaga Y. Detection of spicules on mammogram based on skeleton analysis. IEEE Trans Med Imaging. 1996;15:235–245. doi: 10.1109/42.500062. [DOI] [PubMed] [Google Scholar]
- 19.Huo ZM, Giger ML, Vyborny CJ, Wolverton DE, Schmidt RA, Doi K. Automated computerized classification of malignant and benign masses on digitized mammograms. Acad Radiol. 1998;5:155–168. doi: 10.1016/s1076-6332(98)80278-x. [DOI] [PubMed] [Google Scholar]
- 20.Qian W, Li LH, Clarke LP. Image feature extraction for mass detection in digital mammography: Influence of wavelet analysis. Med Phys. 1999;26:402–408. [Google Scholar]
- 21.Petrick N, Chan HP, Sahiner B, Helvie MA, Paquerault S, Hadjiiski LM. Breast cancer detection: Evalution of a mass detection algorithm for computer-aided diagnosis: Experience in 263 patients. Radiology. 2002;224:217–224. doi: 10.1148/radiol.2241011062. [DOI] [PubMed] [Google Scholar]
- 22.Paquerault S, Petrick N, Chan HP, Sahiner B, Helvie MA. Improvement of computerized mass detection on mammograms: Fusion of two-view information. Med Phys. 2002;29:238–247. doi: 10.1118/1.1446098. [DOI] [PubMed] [Google Scholar]
- 23.Zheng B, Good WF, Armfield DR, Cohen C, Hertzberg T, Sumkin JH, Gur D. Performance change of mammographic CAD schemes optimized with most-recent and prior image databases. Acad Radiol. 2003;10:283–288. doi: 10.1016/s1076-6332(03)80102-2. [DOI] [PubMed] [Google Scholar]
- 24.Wei J, Sahiner B, Hadjiiski LM, Chan HP, Petrick N, Helvie MA, Roubidoux MA, Ge J, Zhou C. Computer aided detection of breast masses on full field digital mammograms. Med Phys. 2005;32:2827–2838. doi: 10.1118/1.1997327. [DOI] [PMC free article] [PubMed] [Google Scholar]
- 25.Petrick N, Chan HP, Sahiner B, Helvie MA, Paquerault S. Evaluation of an automated computer-aided diagnosis system for the detection of masses on prior mammograms; San Diego. 2000. [Google Scholar]
- 26.Te Brake GM, Karssemeijer N, Hendriks J. Automated detection of breast carcinomas not detected in a screening program. Radiology. 1998;207:465–471. doi: 10.1148/radiology.207.2.9577496. [DOI] [PubMed] [Google Scholar]
- 27.Ikeda DM, Birdwell RL, O’Shaughnessy KF, Sickles EA, Brenner RJ. Computer-aided detection output on 172 subtle findings on normal mammograms previously obtained in women with breast cancer detected at follow-up screening mammography. Radiology. 2004;230:811–819. doi: 10.1148/radiol.2303030254. [DOI] [PubMed] [Google Scholar]
- 28.Gur D, Stalder JS, Hardesty LA, Zheng B, Sumkin JH, Chough DM, Shindel BE, Rockette HE. Computer-aided detection performance in mammographic examination of masses: Assessment. Radiology. 2004;233:418–423. doi: 10.1148/radiol.2332040277. [DOI] [PubMed] [Google Scholar]
- 29.El-Shishini H, Abdel-mottaleb MS, El-Raey M, Shoukry A. A multistage algorithm for fast classification of patterns. Pattern Recogn Lett. 1989;10:211–215. [Google Scholar]
- 30.Zhou JY, Pavlidis T. Discrimination of characters by a multi-stage recognition process. Pattern Recogn. 1994;27:1539–1549. [Google Scholar]
- 31.Hansen LK, Salamon P. Neural network ensembles. IEEE Trans Pattern Anal Mach Intell. 1990;12:993–1001. [Google Scholar]
- 32.Rogova G. Combining the results of several neural network classifiers. Neural Networks. 1994;7:777–781. [Google Scholar]
- 33.Hashem S, Schmeiser B. Improving model accuracy using optimal linear combinations of trained neural networks. IEEE Trans Neural Networks. 1995;6:792–794. doi: 10.1109/72.377990. [DOI] [PubMed] [Google Scholar]
- 34.Ho TK, Hull JJ, Srihari SN. Decision combination in multiple classifier systems. IEEE Trans Pattern Anal Mach Intell. 1994;16:66–75. [Google Scholar]
- 35.Bell DA, Guan JW, Bi Y. On combining classifier mass functions for text categorization. IEEE Trans Knowl Data Eng. 2005;17:1307–1319. [Google Scholar]
- 36.Cao J, Ahmadi M, Shridhar M. Recognition of handwritten numerals with multiple feature and multistage classifier. Pattern Recogn. 1995;28:153–160. [Google Scholar]
- 37.Al-Ani A, Deriche M. A new technique for combining multiple classifiers using the Dempster-Shafer theory of evidence. J Artif Intell Res. 2002;17:333–361. [Google Scholar]
- 38.Wei J, Sahiner B, Hadjiiski LM, Chan HP, Helvie MA, Roubidoux MA. A dual computer-aided detection (CAD)system for improvement of mass detection on mammograms. RSNA Program Book. 2004:491. [Google Scholar]
- 39.Wei J, Sahiner B, Hadjiiski LM, Chan HP, Helvie MA, Roubidoux MA, Petrick N, Zhou C, Ge J. Computer aided detection of breast masses on mammograms: Performance improvement using a dual system. Proc SPIE. 2005;5747:9–15. [Google Scholar]
- 40.Wei J, Sahiner B, Hadjiiski LM, Chan HP, Petrick N, Helvie MA, Zhou C, Ge Z. Computer aided detection of breast masses on full-field digital mammograms: False positive reduction using gradient field analysis. Proc SPIE. 2004;5370:992–998. [Google Scholar]
- 41.Petrick N, Chan HP, Sahiner B, Helvie MA. Combined adaptive enhancement and region-growing segmentation of breast masses on digitized mammograms. Med Phys. 1999;26:1642–1654. doi: 10.1118/1.598658. [DOI] [PubMed] [Google Scholar]
- 42.Wei D, Chan HP, Petrick N, Sahiner B, Helvie MA, Adler DD, Goodsitt MM. False-positive reduction technique for detection of masses on digital mammograms: Global and local multiresolution texture analysis. Med Phys. 1997;24:903–914. doi: 10.1118/1.598011. [DOI] [PubMed] [Google Scholar]
- 43.Galloway MM. Texture classification using gray level run lengths. Comput Graph Image Process. 1975;4:172–179. [Google Scholar]
- 44.Norusis MJ. SPSS for Windows Release 6 Professional Statistics. SPSS; Chicago, IL: 1993. [Google Scholar]
- 45.Hadjiiski LM, Sahiner B, Chan HP, Petrick N, Helvie MA, Gurcan MN. Analysis of temporal change of mammographic features: Computer-aided classification of malignant and benign breast masses. Med Phys. 2001;28:2309–2317. doi: 10.1118/1.1412242. [DOI] [PubMed] [Google Scholar]
- 46.Metz CE, Herman BA, Shen JH. Maximum-likelihood estimation of receiver operating characteristic (ROC)curves from continuously-distributed data. Stat Med. 1998;17:1033–1053. doi: 10.1002/(sici)1097-0258(19980515)17:9<1033::aid-sim784>3.0.co;2-z. [DOI] [PubMed] [Google Scholar]
- 47.Sahiner B, Chan HP, Petrick N, Wagner RF, Hadjiiski LM. Feature selection and classifier performance in computer-aided diagnosis: The effect of finite sample size. Med Phys. 2000;27:1509–1522. doi: 10.1118/1.599017. [DOI] [PMC free article] [PubMed] [Google Scholar]
- 48.Bishop CM. Neural Networks for Pattern Recognition. Clarendon; Oxford: 1995. [Google Scholar]
- 49.Freeman JA, Skapura DM. Neural Networks-Algorithms, Applications, and Programming Techniques. Addison-Wesley; Reading: 1991. [Google Scholar]
- 50.Chakraborty DP, Winter LHL. Free-response methodology: Alternate analysis and a new observer-performance experiment. Radiology. 1990;174:873–881. doi: 10.1148/radiology.174.3.2305073. [DOI] [PubMed] [Google Scholar]
- 51.Chakraborty DP, Berbaum KS. Observer studies involving detection and localization: Modeling, analysis, and validation. Med Phys. 2004;31:2313–2330. doi: 10.1118/1.1769352. [DOI] [PubMed] [Google Scholar]
- 52.O’Shaughnessy KF, Castellino RA, Muller SL, Benali K. Computer-aided detection (CAD) on 90 biopsy-proven breast cancer cases acquired on a full-field digital mammography (FFDM) system. Radiology. 2001;221(P):471. [Google Scholar]
- 53.Warren Burhenne LJ, Wood SA, D’Orsi CJ, Feig SA, Kopans DB, O’Shaughnessy KF, Sickles EA, Tabar L, Vyborny CJ, Castellino RA. Potential contribution of computer-aided detection to the sensitivity of screening mammography. Radiology. 2000;215:554–562. doi: 10.1148/radiology.215.2.r00ma15554. [DOI] [PubMed] [Google Scholar]
- 54.Brem RE, Hoffmeister JW, Rapelyea JA, Zisman G, Mohtashemi K, Jindal G, DiSimio MP, Rogers SK. Impact of breast density on computer-aided detection for breast cancer. AJR, Am J Roentgenol. 2005;184:439–444. doi: 10.2214/ajr.184.2.01840439. [DOI] [PubMed] [Google Scholar]


