

Abstract
We are developing a computer-aided detection (CAD) system for breast masses on full field digital mammographic (FFDM) images. To develop a CAD system that is independent of the FFDM manufacturer’s proprietary preprocessing methods, we used the raw FFDM image as input and developed a multiresolution preprocessing scheme for image enhancement. A two-stage prescreening method that combines gradient field analysis with gray level information was developed to identify mass candidates on the processed images. The suspicious structure in each identified region was extracted by clustering-based region growing. Morphological and spatial gray-level dependence texture features were extracted for each suspicious object. Stepwise linear discriminant analysis (LDA) with simplex optimization was used to select the most useful features. Finally, rule-based and LDA classifiers were designed to differentiate masses from normal tissues. Two data sets were collected: a mass data set containing 110 cases of two-view mammograms with a total of 220 images, and a no-mass data set containing 90 cases of two-view mammograms with a total of 180 images. All cases were acquired with a GE Senographe 2000D FFDM system. The true locations of the masses were identified by an experienced radiologist. Free-response receiver operating characteristic analysis was used to evaluate the performance of the CAD system. It was found that our CAD system achieved a case-based sensitivity of 70%, 80%, and 90% at 0.72, 1.08, and 1.82 false positive (FP) marks/image on the mass data set. The FP rates on the no-mass data set were 0.85, 1.31, and 2.14 FP marks/image, respectively, at the corresponding sensitivities. This study demonstrated the usefulness of our CAD techniques for automated detection of masses on FFDM images.
Keywords: computer-aided detection, full field digital mammogram (FFDM), multiresolution image enhancement, gradient field analysis, stepwise linear discriminant analysis
I. INTRODUCTION
Breast cancer is one of the leading causes of death among American women between 40 and 55 years of age.1 It has been reported that early diagnosis and treatment can significantly improve the chance of survival for patients with breast cancer.2–4 Although mammography is the best available screening tool for detection of breast cancers, studies indicate that a substantial fraction of breast cancers that are visible upon retrospective analyses of the images are not detected initially.5–8 Computer-aided diagnosis (CAD) is considered to be one of the promising approaches that may improve the sensitivity of mammography.9,10 Computer-aided lesion detection can be used during screening to reduce oversight of suspicious lesions that warrant further work-up. Computer-aided lesion characterization can assist in the estimation of the likelihood of malignancy of lesions by using image and/or other information during the diagnostic stage. The majority of studies to date show that CAD can improve radiologists’ lesion detection sensitivity,11–16 although Gur et al.17 found that CAD had no significant effect on the radiologists in their academic setting when they averaged the results from both low-volume and high-volume radiologists. Further analysis of Gur’s data by Feig et al.18 indicated that the 17 low-volume radiologists in Gur’s study achieved similar increase in sensitivity as reported in other studies. The outcome of CAD studies therefore depends on the study design and data analysis.
A number of investigators have reported CAD algorithms for detection of masses on mammograms. Their approaches to prescreening of mass candidates were based primarily on mass characteristics including: (1) asymmetric density between left and right mammograms,19–22 (2) texture,23,24 (3) spiculation,25,26 (4) gray level contrast,27–31 and (5) gradient.32 Some of these approaches were refined with a combination of the mass characteristics. Feature classifiers were then used to further differentiate masses from normal breast tissues.
Most mammographic CAD algorithms developed so far are based on digitized screen-film mammograms (SFMs). In the last few years, full field digital mammographic (FFDM) technology has advanced rapidly because of the potential of digital imaging to improve breast cancer detection. Several manufacturers have obtained clearance from the FDA for clinical use. It is expected that FFDM detectors will provide higher signal-to-noise ratio (SNR) and detective quantum efficiency, wider dynamic range, and higher contrast sensitivity than digitized mammograms. The spatial resolution of digital detectors may also be different from that of digitized SFMs even when their pixel pitches are equal. Li et al. investigated the performance of their CAD system on mass detection that was developed for SFMs and modified for FFDMs.33 Their preliminary results on a small data set showed that it achieved 60% sensitivity at 2.47 false positives (FPs)/image. It is expected that proper adaptation based on the imaging characteristics of FFDMs and re-training of the CAD system with FFDMs would improve the performance. Because of the higher SNR and linear response of digital detectors, there is also a strong potential that more effective feature extraction techniques can be designed to optimally extract signals from the image and improve the accuracy of CAD. Several commercial CAD systems already obtained FDA approval for use with FFDMs. The commercial CAD systems generally reported similar performance on FFDMs and SFMs. However, their study was not reported in peer-reviewed journals so that the data set and algorithm are unknown. Recently, an assessment study34 to compare the performance of two commercial and one research CAD system for SFMs showed that their mass detection sensitivities ranged from 67% to 72% and the FP rates ranged from 1.08 to 1.68 per four-view examinations. The differences in sensitivities were not significant whereas the differences in the FP rates were significant, depending on the examinations and CAD systems used.34
We have developed a CAD system for the detection of masses on SFMs in our previous studies.30,35,36 We are developing a mass detection system for mammograms acquired directly by a FFDM system. In this study, we adapted our mass detection system developed for SFMs to FFDMs by optimizing each stage and retraining. In an effort to develop a CAD system that is less dependent on the FFDM manufacturer’s proprietary preprocessing methods, we used the raw FFDM as input and developed a multiresolution preprocessing scheme for image enhancement. A new technique was also designed for prescreening of mass candidates on the preprocessed images.
II. MATERIALS AND METHOD
A. Data sets
The mammograms were collected from patient files at the Department of Radiology with Institutional Review Board approval. Digital mammograms at the University of Michigan are acquired with a GE Senographe 2000D FFDM system. The GE system has a CsI phosphor/a:Si active matrix flat panel digital detector with a pixel size of 100 μm × 100 μm and 14 bits per pixel. In this study, we used two data sets: a mass set containing FFDMs with malignant or benign masses and a no-mass set containing FFDMs without masses. The no-mass set was obtained from microcalcification cases collected for the development of our microcalcification CAD systems. The cases were included as normal, with respect to masses, only if they were verified to be free of masses by an experienced Mammography Quality Standards Act (MQSA) radiologist. Our mass detection system aims at application to screening mammography so that the mass cases, regardless of malignant or benign, are considered positive. All cases had two mammographic views, the craniocaudal view and the mediolateral oblique view or the lateral (LM or ML) view. The mass set contained 110 cases with a total of 220 images. The no-mass set contained 90 cases with a total of 180 images. The mass data set was used to estimate the detection sensitivity and the no-mass data set was used for estimating the FP rate. There were a total of 110 biopsy-proven masses in the mass data set. Eighty-seven of the masses were benign and 23 of the masses were malignant. A MQSA radiologist identified the locations of the masses, measured the mass sizes as the longest dimension seen on the two-view mammograms, provided descriptors of the mass shapes and mass margins, and also provided an estimate of the breast density in terms of BI-RADS category. Figure 1 shows the information of our data set which includes the distributions of mass sizes, mass shapes, mass margins, and breast density.
Fig. 1.

The information of our mass data set: (a) distribution of mass sizes, (b) distribution of mass shapes, (c) distribution of mass margins, C: circumscribed, Ind: indistinct, M: microlobulated, Ob: obscured, Sp: spiqulated, (d) distribution of the breast density in terms of BI-RADS category estimated by a MQSA radiologist.
B. Methods
Our CAD system consists of five processing steps: (1) preprocessing by using multiscale enhancement, (2) pre-screening of mass candidates, (3) identification of suspicious objects, (4) feature extraction and analysis, and (5) FP reduction by classification of normal tissue structures and masses. The block diagram for the detection scheme is shown in Fig. 2. These steps are described in more detail in the following.
Fig. 2.

Schematic diagram of our CAD system for mass detection on FFDM. The system is developed for screening mammography so that all masses, regardless of malignant or benign, are considered positive. The FP classification stage includes rule-based classification, a morphological LDA classifier, and a texture feature LDA classifier for differentiating masses from normal breast tissues.
We randomly separated the mass data set into two independent, equal sized subsets. Each subset contained 55 cases with 110 images. Cross validation was used for training and testing the algorithms. The training included selecting the preprocessing Laplacian pyramid reconstruction weights, adjusting the filter weights for prescreening and clustering, determining thresholds for rule-based classification, and selecting morphological and texture features and classifier weights. Once the training with one subset was completed, the parameters and all thresholds were fixed for testing with the other subset. The training and test subsets were switched and the training process was repeated. The overall detection performance was evaluated by combining the performances for the two test subsets. The trained algorithms with the fixed parameters were also applied to the no-mass mammograms to estimate the FP rate in screening mammograms.
1. Preprocessing
FFDMs are generally preprocessed with proprietary methods by the manufacturer of the FFDM system before being displayed to readers. The image preprocessing method used depends on the manufacturer of the FFDM system. To develop a CAD system that is less dependent on the FFDM manufacturer”s proprietary preprocessing methods, we use the raw FFDM as input to our CAD system. We developed a multiscale preprocessing scheme for image enhancement.
Multiscale methods have been used for contrast enhancement of medical images. Since a multiscale method uses the information from a large number of frequency channels extracted from the image adaptively, it is more flexible and versatile than the commonly used enhancement methods, such as unsharp masking, which uses a small number of frequency channels. Two types of multiscale methods have been used as the preprocessing methods for the contrast enhancement of mammograms: the wavelet method and the Laplacian pyramid method.37 A previous study has shown that, for the purpose of image enhancement, using a Laplacian pyramid method is advantageous compared to using the fast wavelet transformation which introduces visible artifacts.38 In this project, therefore, we chose the Laplacian pyramid method as our preprocessing method.
A flowchart of our preprocessing method is shown in Fig. 3. In brief, the mammogram is first segmented automatically into the background and the breast region. Second, a logarithmic transform is applied to the breast image. The Laplacian pyramid method is used to decompose the breast image into multiscales. A nonlinear weight function based on the pixel gray level from each of the low-pass components is designed to enhance the high-pass components.
Fig. 3.
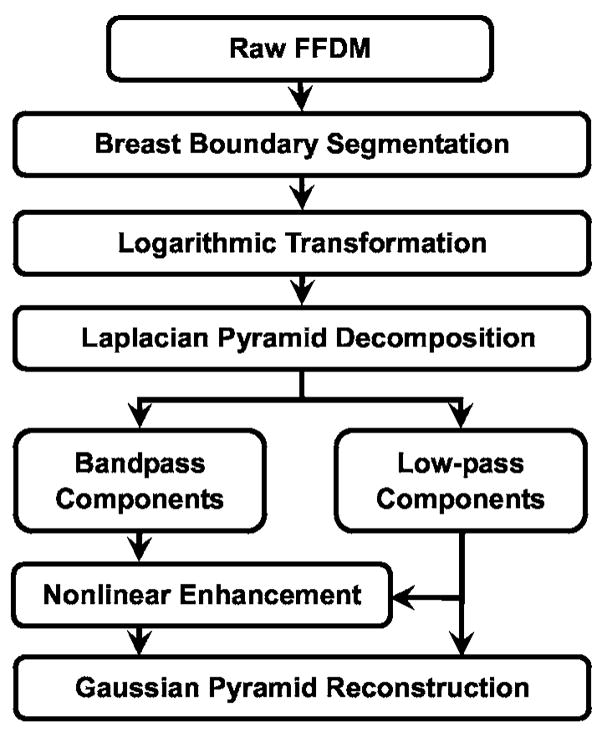
Schematic diagram for the image preprocessing stage of our mass detection system, which includes breast boundary segmentation, logarithmic image transformation, and Laplacian pyramid multiscale enhancement.
Since the contrast between the breast and the background in a raw FFDM is high, a two-step algorithm was developed for the segmentation of breast region. First, Otsu’s method39 is used to calculate a threshold and binarize the original image. Second, an eight-connectivity labeling method is used to identify the connected regions below the threshold on the binary image. The region with the largest area will be considered to be the breast region.
Clinical mammograms are usually viewed in a negative mode of the raw images. In order to process an image with the same format as the clinical mammograms, we first use an inverted logarithmic function40 to transform the raw data. A multiresolution method is then used to enhance the log-transformed image. The inverted logarithmic function for signal transfer can be expressed as
| (1) |
where X is the gray level of the raw data, Xmax is the maximum of the 14 bit digital gray scale number (i.e., 16 383). The transformed image is then linearly scaled to 12 bit pixel values.
The Laplacian pyramid decomposition is a multiscale method that was first introduced as an image compression technique.37 We previously evaluated the effect of Laplacian pyramid data compression on the detection of microcalcifications on digitized mammograms.41 An illustration of a Laplacian decomposition tree is shown on the left-hand side of Fig. 4. The Laplacian pyramid is a sequence of error images L0, L1, …, Ln. Each is the difference between two consecutive levels of the Gaussian pyramid G0, G1, …, Gn, where G0 is the original image. Each subsequent level of the Gaussian pyramid in the decomposition tree is generated by convolution of the image at the previous level with a 5×5 kernel, w(m, n), that has weights of 0.4 at the center, 0.25 at the eight nearest neighbors of the center, and 0.05 at the 16 peripheral pixels, and then downsampled by a factor of 2, as described in Eq. (4). The decomposition of the image from level k to level k+1 can be expressed mathematically by
Fig. 4.

Multiscale enhancement using the Laplacian pyramid decomposition method: Laplacian decomposition tree on the left-hand side and the Gaussian reconstruction tree on the right-hand side. The different levels of the Gaussian pyramid images are denoted by Gi, (i=0, …, n). The error images at different levels of the Laplacian pyramid are denoted by Li, (i =0, …, n). The primed quantities and denoted the images at different levels after enhancement. Σ denotes the summation operation. The image is downsampled by a factor of 2 when it goes down every level of the decomposition tree, and upsampled by a factor 2 when it moves up every level of the reconstruction tree.
| (2) |
where
| (3) |
| (4) |
The original image can be recovered by following the Gaussian reconstruction tree shown on the right-hand side of Fig. 4 if no enhancement is applied to the Laplacian pyramid. At a given level of the Gaussian reconstruction tree, the image is expanded (convolved and upsampled), as shown in Eq. (3), and then added to the Laplacian error image of the corresponding level. Details of the decomposition and reconstruction processes can be found in the literature.37
We enhance the reconstructed image to facilitate mass detection. The image at each level of the Laplacian pyramid that corresponds to a bandpass image is mapped by a nonlinear function. In this study, we use a nonlinear function that incorporates the information from each bandpass image. A Gaussian pyramid expansion is then used to reconstruct the image from the low pass components and the enhanced bandpass components, as shown in Fig. 4. The reconstruction scheme is defined by
| (5) |
where α, β, and p are constant values in the range of 0.2–2.0 experimentally chosen for each frequency level.
Figures 5(a) and 5(b) show an example of a GE raw image and its processed image provided by the GE FFDM system. The histograms of the raw image and the processed image are shown next to the corresponding images. An example of the processed image using our multiresolution enhancement method and the corresponding histogram are shown in Fig. 5(c).
Fig. 5.

An example of (a) GE raw image, (b) GE processed image, and (c) our processed image by using the Laplacian pyramid multiscale method. The gray level histogram of each image is also shown. The GE raw image has 14 bit gray levels but the histogram only plotted the lower 12 bits because very few pixels had gray levels higher than 4095.
2. Prescreening and segmentation of suspicious objects
In our previous CAD system developed for digitized SFMs, an adaptive density-weighted contrast enhancement (DWCE) filter35 was developed for prescreening. Although the DWCE filter using the gray level information can identify the suspicious locations of masses on mammograms with high sensitivity, the prescreening objects often include a large number of enhanced normal breast structures.
In this study, we investigated the use of a new method that combines gradient field information and gray level information to detect mass candidates on FFDMs. Gradient field information is commonly used in computer vision or other fields to extract objects or intensity field distributions. Kobatake et al.42 designed a filter, referred to as an iris filter, to calculate the convergence of gradient index around each pixel on SFMs which provided shape information for detection of masses. An extension of the iris filter, referred to as an adaptive ring filter, was developed by Wei et al.43 for detection of lung nodules on chest x-ray images. In this study, we have developed a two-stage gradient field analysis method which uses not only the shape information of masses on mammograms but also incorporates the gray level information of the local object segmented by a region growing technique in the second stage to refine the gradient field analysis.
To reduce noise in the gradient calculation, the image is smoothed with a 4×4 box filter and subsampled to 400 μm × 400 μm. The gradient field analysis is applied to the smoothed image. At each pixel c(i) within the breast, concentric annular regions centered at c(i) with an average radius, R(k), of k pixels from c(i) and a radial width of 4 pixels are defined within a circular region of about 12 mm in radius. The gradient vector at each pixel p(j) within an annular region is computed and the gradient direction is obtained by projecting the gradient vector to the radial direction vector from c(i) to p(j). The average gradient direction over an annular region at the average radius R(k) is calculated as the mean of the gradient directions over pixels on three adjacent annular regions R(k−1), R(k), and R(k+1). Finally, the gradient field convergence at c(i) was determined as the maximum of the average gradient directions among all annular regions. A region of interest (ROI) of 256×256 pixels in the 100 μm×100 μm images is identified with its center placed at each location of high gradient convergence. The object in each ROI is segmented by a region growing method44 in which the location of high gradient convergence is used as the starting point. After region growing, all connected pixels constituting the object are labeled. Finally, the gradient convergence at the center location of the ROI is recalculated within the segmented object. Objects whose new gradient convergence is lower than 80% of the original value are rejected.
After prescreening, the suspicious objects are identified by using a two-stage segmentation method. First, the background-corrected ROI was weighted by a Gaussian function with σ=256 pixels. Then, a k-means clustering using the pixel values in a background-corrected image and a Sobel filtered image as features is used to find the object. Figures 6(a) and 6(b) show the initial detection locations and the grown objects, respectively, obtained by prescreening the mammogram shown in Fig. 5(c).
Fig. 6.

An example demonstrating the processing steps with our CAD system: (a) object locations identified in prescreening, (b) identified suspicious objects, (c) detected objects after FP reduction, and (d) image superimposed with ROIs identifying the detected objects. The true mass is indicated by an arrow.
3. Feature extraction and FP reduction
FP classification in our mass detection system is accomplished by a three-stage classification scheme.36,44 For each suspicious object, eleven morphological features are extracted. Rule-based classification and a linear discriminant analysis (LDA) classifier using all 11 morphological features as input predictor variables are trained to remove the detected structures that are substantially different from breast masses. The training data set alone was used for training the classification rules and the weights of the LDA classifier. After morphological classification, global and local multi-resolution texture analyses45 are performed in each remaining ROI by using the spatial gray level dependence (SGLD) matrix. Briefly, the wavelet transform is employed to decompose an ROI into three levels for global texture analysis. Thirteen types of texture features44,46 are extracted from each ROI. Each feature is calculated at 14 pixel distances and 2 angular directions. A total of 364 features (13 texture measures×14 distances×2 directions) is extracted from global texture analysis. Local texture features are extracted from the local region containing the detected object (object region) and the peripheral regions within each ROI. A total of 208 features (104 features from the object region and 104 features from the peripheral regions) are extracted. The third-stage FP reduction using the texture features is described next.
4. Texture classification of masses and normal tissue
In order to obtain the best texture feature subset and reduce the dimensionality of the feature space to design an effective classifier, feature selection with stepwise LDA was applied. At each step one feature was entered or removed from the feature pool by analyzing its effect on the selection criterion, which was chosen to be the Wilks’ lambda in this study. The optimization procedure used a threshold Fin for feature entry, a threshold Fout for feature removal, and a tolerance threshold T for excluding features that had high correlation with the features already in the selected pool. Since the appropriate values of Fin, Fout, and T were unknown, we examined a range of Fin, Fout, and T values using an automated simplex optimization method. For a given combination of Fin, Fout, and T values, the algorithm used a leave-one-case-out resampling method within the training subset to select features and estimate the weights for the LDA classifier. To evaluate the classifier performance, the test discriminant scores from the left-out cases were analyzed using receiver operating characteristic ROC methodology. The discriminant scores of the mass and normal tissue were used as the decision variable in the LABROC program, which fits a binormal ROC curve based on maximum likelihood estimation. The accuracy for classification of mass and normal tissue was evaluated as the area under the ROC curve, Az. The test Az for the left-out cases in the leave-one-out resampling within the training subset was used as a figure of merit to guide the simplex algorithm to search for the best set of Fin, Fout, and T values within the parameter space. In this approach, feature selection was performed without the left-out case so that the test performance would be less optimistically biased.48 However, the selected feature set in each leave-one-case-out cycle could be slightly different because every cycle had one training case different from the other cycles. In order to obtain a single trained classifier to apply to the test subset, a final stepwise feature selection was performed with the entire training subset and a set of Fin, Fout, and T thresholds chosen from the output of simplex training process. This set of Fin, Fout, and T thresholds was chosen based not only on the test Az values, which were generated when the simplex procedure was searching through the parameter space, but also on the average number of features selected. The appropriate thresholds were chosen as a balance between keeping the number of selected features small and a relatively high classification accuracy by LDA. The chosen thresholds were then applied to the entire training subset to obtain the final set of features using stepwise feature selection and estimate the weights of the LDA. The LDA classifier with the selected feature set was then fixed and applied to the test subset. The test subset was independent of the training subset as described in Sec. II B 2 and was not used in the above-described leave-one-case-out classifier training process.
5. Evaluation methods
The detected individual objects were compared with the “truth” ROI marked by an experienced radiologist. A detected object was scored as true positive (TP) if the overlap between the bounding box of the detected object and the truth ROI was over 25%. Otherwise, it would be scored as FP. The 25% threshold was selected as described in our previous study.36 The detection performance of the CAD system was assessed by free response ROC (FROC) analysis. FROC curves were presented on a per-mammogram and a per-case basis. For mammogram-based FROC analysis, the mass on each mammogram was considered an independent true object; the sensitivity was thus calculated relative to 220 masses. For case-based FROC analysis, the same mass imaged on the two-view mammograms was considered to be one true object and detection of either or both masses on the two views was considered to be a TP detection; the sensitivity was thus calculated relative to 110 masses. Figure 6(c) shows an example of the final detected objects and Fig. 6(d) shows the locations of these objects superimposed on the mammogram.
To evaluate the effect of the preprocessing methods on mass detection, we also trained a CAD system using the GE processed image as input. This CAD system used the same methods as those described earlier for the raw images except that the Laplacian pyramid preprocessing step was not applied to the GE processed image, and that the prescreening and feature classifiers were retrained specifically for the GE processed images to obtain the best performance. The training and test subsets contained the same corresponding cases as for the raw image subsets. The training and testing were performed using the above-described cross validation method. The performance of the CAD system using the GE processed images was quantified by the average test FROC curve and compared with that using the raw images.
III. RESULTS
With raw images as input and Laplacian pyramid enhancement, our CAD system using the two-stage gradient field analysis detected 92.7% (204/220) of the masses with an average of 18.9 (4152/220) objects/image at the pre-screening stage, compared with an average of 23.8 objects/image at the same sensitivity by using gradient field information alone. After FP reduction using the rule-based and linear classifier based on morphological features, there were a total of 3412 mass candidates (15.5 objects/image) at a sensitivity of 90.5% (199/220).
The texture-based LDA classifier for FP reduction was designed with stepwise feature selection and simplex optimization. The most effective subset of features from the available feature pool was selected for each of the training subsets during the training procedure. Twenty (11 global and 9 local) and 19 (12 global and 7 local) texture features were selected from the two independent training subsets, respectively. The test ROC curves are shown in Fig. 7. The training Az values of the LDA classifier on the two training subsets were 0.87±0.02 and 0.88±0.01, respectively. The classifiers achieved Az values of 0.89±0.02 and 0.85±0.02 on the independent test subsets, respectively. Figure 8 shows the FROC curves for the two test subsets after FP reduction with the corresponding trained LDA classifiers. An average FROC curve was derived from these two FROC curves by averaging the FP/images at the corresponding sensitivities. This average test FROC curve is plotted in Fig. 9 for comparison with the other FROC curves, described next.
Fig. 7.
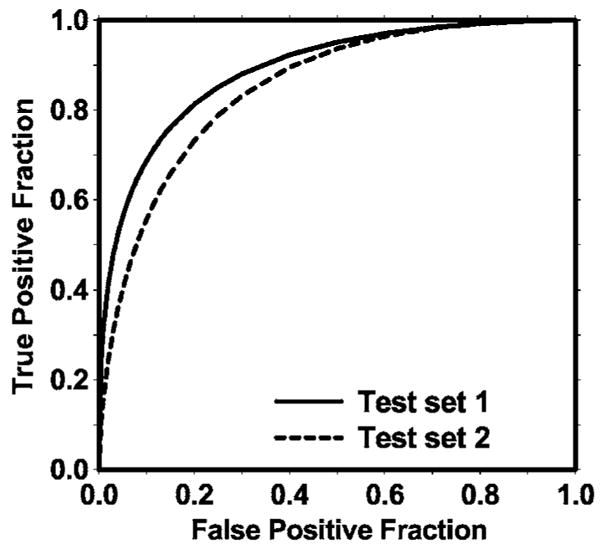
The test ROC curves from the two independent mass subsets. The LDA classifiers using text features achieved an Az value of 0.89±0.02 for test subset 1 and 0.85±0.02 for test subset 2 in the classification of mass and normal breast tissues.
Fig. 8.

The test FROC curves from the two independent mass subsets for the CAD system using the raw images as input and processed with the Laplacian pyramid method. The FP rate was estimated from the mammograms with masses. (a) Image-based FROC curves, (b) case-based FROC curves.
Fig. 9.

Comparison of the average test FROC curves obtained from: (1) the CAD system using raw images as input, with the FP rate estimated from the mammograms with masses, (2) the CAD system using raw images as input, with the FP rate estimated from the normal mammograms without masses, and (3) the CAD system using GE processed images as input, with the FP rate estimated from the GE processed mammograms with masses. (a) Image-based FROC curves, (b) case-based FROC curves.
In addition to using the mass data set containing 110 cases for the cross validation training and testing, we used a no-mass data set containing 90 cases with 180 images to evaluate the FP detection rate in normal cases. Since two sets of trained parameters were acquired as a result of the cross validation training, we applied the two trained CAD systems separately to the no-mass data set for FP detection. The number of FP marks produced by the algorithm was determined by counting the detected objects on these normal cases only. The mass detection sensitivity was determined by counting only the abnormal objects on each of the test mass subsets. The combination of the sensitivity from each of the test mass subsets and the FP rate from the normal data set at the corresponding detection thresholds resulted in a test FROC curve. The two test FROC curves were then averaged, as described earlier, to obtain an overall FROC curve quantifying the test performance of the CAD system. Figures 9(a) and 9(b) show the comparison of the average FROC curves with the FP rates estimated from the two data sets. The test FROC curve with the FP rate estimated from the no-mass data set showed a case-based detection sensitivity of 70%,80%, and 90% at 0.85, 1.31, and 2.14 FP marks/image, which are slightly higher than the FP rates of 0.7, 1.1, and 1.8 marks/image, respectively, estimated from the mass data set. Since our mass detection algorithm limits the maximum number of output marks to be 3 at the final stage, the FP marker rates will be slightly higher if the detection is performed in no-mass images. However, many images do not reach the maximum of 3 marks so that the difference in the FP marker rate between the mass and no-mass set is less than one. We also analyzed the detection accuracy of the system for malignant and benign masses separately. Figures 10(a) and 10(b) show the average FROC curves for detection of malignant and benign masses.
Fig. 10.

Comparison of the average test FROC curves for the malignant and benign mass sets. The CAD system using raw images as input was used and the FP rate was estimated from the mammograms without masses. (a) Image-based FROC curves, (b) case-based FROC curves.
The average test FROC curves of the CAD system using the GE processed images as input were compared to those of the CAD system using raw images as input and Laplacian pyramid multiscale preprocessing as shown in Fig. 9. The FROC curves were plotted as the detection sensitivity as a function of the number of FP marks per image on the mass data set. The CAD system using the GE processed images as input achieved a case-based sensitivity of 70%, 80%, and 90% at 0.9, 1.6, and 3.1 FP marks/image, respectively, compared with 0.7, 1.1, and 1.8 FP marks/image on the CAD system using raw images as input.
IV. DISCUSSION
Several FFDM systems have been approved for clinical applications. It is important to develop a CAD system that can easily be adapted to images acquired by FFDM systems from different manufacturers. In this study, we are developing a CAD system that uses the raw FFDMs as the input. Since digital detectors generally have a linear response to x-ray exposure, the raw pixel values are a linear function of the absorbed x-ray energy in the detector. The signal range between different digital detectors can therefore be normalized linearly with respect to each other. Although the spatial resolution and noise properties of the images from different detectors are still different, the use of raw images already reduces one of the major differences between mammograms from different FFDM systems. For preprocessing of the raw images, we developed a multiresolution enhancement method. An example of a typical mammogram processed by the GE method and our method is compared in Fig. 5. As seen from this example, the enhancement of mammographic structures was stronger for our processed image than for the GE processed image. From a comparison of their histograms, it was found that the two histograms are very similar except for the average gray level.
For the evaluation of the effect of the preprocessing methods on computerized mass detection, we observed that our Laplacian pyramid preprocessing method provided higher detection accuracy than the GE processing method. As shown in Fig. 5, the Laplacian pyramid preprocessing method applies a stronger edge enhancement to the image than the GE method. Our preprocessing method aims at enhancing the image structures for computer vision whereas the GE processing method was designed to enhance the image for human visual interpretation. The stronger enhancement used for preprocessing the raw images appeared to improve the accuracy of the computer in detecting the masses.
Currently, there is no established statistical analysis method for testing the significance of the difference between two FROC curves generated by a CAD system. Chakraborty et al. proposed using an alternative free-response ROC (AFROC) method49 to transform the FROC data to AFROC data, to which the curve fitting software and statistical significance tests for ROC analysis can then be applied and demonstrated its application to human observer performance rating data. In the AFROC method, false-positive images (FPIs) instead of FPs per image are counted. The confidence rating of a FPI is determined by the highest confidence FP decision on the image regardless of how many lower confidence FP decisions are made on the same image. We applied the AFROC method to evaluate the differences in pairs of our FROC curves that used the no-mass set for estimation of the FP rates. The ROCKIT software developed by Metz et al.47 was used to analyze the AFROC data. The comparison of A1 and p values is summarized in Table I. The area under the fitted AFROC curve (A1) was 0.44 and 0.39, respectively, on mass test subsets 1 and 2 for the CAD system using raw images as input and processed with our Laplacian pyramid method, and 0.37 and 0.31, respectively, on the same subsets for the CAD system using GE processed images as input. The difference between the fitted AFROC curve for our processed images and that for the GE processed images was statistically significant (p<0.05) for both test subsets. However, all four fitted AFROC curves deviated systematically from the AFROC data (see two examples plotted in Fig. 11 for the test subset 1). It is uncertain whether the AFROC method is applicable to our FROC data and thus whether the statistical significance testing is valid.
Table I.
Estimation of the statistical significance in the difference between the FROC performance of the CAD system using the FFDM raw images as input and processed with our Laplacian pyramid method and that of the CAD system using GE processed images as input. The FROC curves with the FP rates obtained from the no-mass data set (Fig. 9) were compared.
|
A1 (AFROC) |
FOM (JAFROC) |
|||||
|---|---|---|---|---|---|---|
| Test subset 1 | Test subset 2 | p values | Test subset 1 | Test subset 2 | p values | |
| Raw+LP processed | 0.44 | 0.39 | 0.012 | 0.46 | 0.41 | 0.006 |
| GE processed | 0.37 | 0.31 | 0.0009 | 0.39 | 0.34 | 0.012 |
Fig. 11.
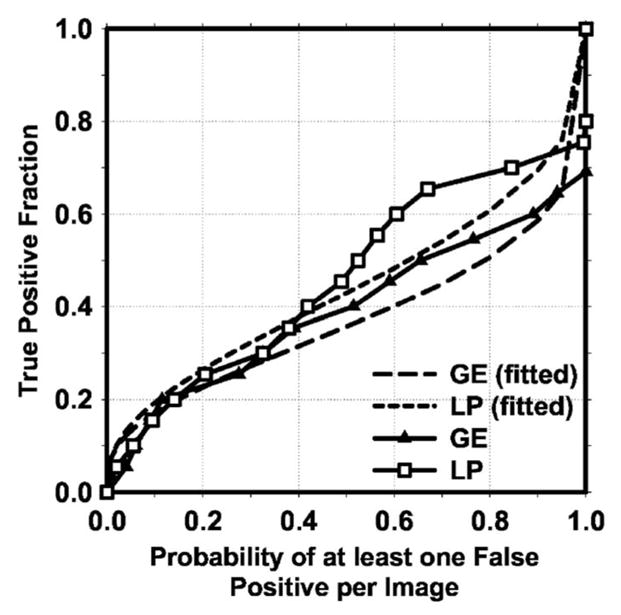
Comparison of alternative free-response receiver operating characteristic (AFROC) curves. The raw curves were transformed from the FROC curves of mass detection on test subset 1 using either the raw images as input and processed with the Laplacian pyramid method (LP) or the GE processed images as input. The FP rate was estimated from the mammograms without masses. The fitted AFROC curves were obtained by applying the ROCKIT program to the transformed AFROC data.
More recently, Chakraborty et al.50 proposed a JAFROC method and provided software to estimate the statistical significance of the difference between two FROC curves. We also applied the JAFROC analysis to the two pairs of FROC curves. The figure-of-merit (FOM) from the output of the JAFROC software was 0.46 and 0.41, respectively, on mass test subsets 1 and 2 for the CAD system using raw images as input and processed with our Laplacian pyramid method, and 0.39 and 0.34, respectively, on the same subsets for the CAD system using GE processed images as input. The difference between the FOM for our processed images and that for the GE processed images was again statistically significant (p < 0.05). The FOM values were about 0.02 higher than the corresponding A1 values. The JAFROC software did not provide a fitted curve or a goodness-of-fit indicator in the output so that it is not known whether this model fits our FROC data better than the AFRPC method. Although both methods indicate that the improvement in the FROC performance using our Laplacian pyramid processed images is statistically significant, further investigations are needed to study whether these models are valid for analyzing the FROC performance of CAD systems.
The prescreening technique is an important task in a CAD system. A number of researchers have developed methods for detection of suspicious masses on SFMs and CRs. The previous methods produced between 10 to 30 FPs/image for a mass detection sensitivity of approximately 90%. However, it is difficult to compare the effectiveness of the different methods because of the differences in the image recording systems and in the data sets. In this study, we developed a new method that combines gradient field information, which was originally developed for the detection of lung nodules on chest x-ray images,43 and gray level information44 for pre-screening mass candidates on the FFDMs. The new method produced 18.9 objects/image at 93% sensitivity in the pre-screening step, compared with an average of 23.8 objects/image at the same sensitivity by using gradient field information alone.
The texture features in this study were extracted by using the SGLD matrix. A total of 572 features were included in our initial feature pool. These features were also used by our CAD system previously developed for SFMs. An average number of 19.5 features were selected by using a stepwise feature selection method. The Az values for the LDA classifiers were 0.87±0.02 and 0.88±0.01 on the two training subsets, and 0.89±0.02 and 0.85±0.02 on the test subsets, respectively. The slightly higher test Az from the first test subset than the Az from its training subset may indicate that some relatively easy cases were assigned, by chance, to that test set during random partitioning. We also investigated if other features could improve the performance of our CAD system. The different feature spaces that we examined included features extracted from principal component analysis applied to the ROI image, run length statistics texture features extracted from the ROI images, and combination of one or both of these feature spaces with the SGLD feature space. However, the test results showed that a LDA classifier designed in the SGLD feature space alone provided the best performance. Although this was found to be true for both our CAD mass detection system for SFMs developed previously and the current system for FFDMs, it is still difficult to conclude that the SGLD features are the best feature set for classification between breast masses and normal tissues. One major concern of the SGLD feature space is that the dependence of the feature values on the pixel pair distance and angular direction leads to a feature pool with a large number of features. Some features in such a large feature space may provide good performance in classification of masses and normal structures by chance. We attempted to alleviate this problem by using an independent test set to evaluate the classifier performance. However, since we chose the overall system parameters with the knowledge of the performance for the test sets, the evaluation would still amount to validation rather than true testing. We have verified that our CAD system for SFMs can achieve reasonable performance in a true independent data set36 and a prospective pilot clinical trial.16 The performance of the current CAD system for FFDMs will have to be evaluated similarly when independent data sets become available.
The detection performance of a CAD system for malignant masses is more important than its performance for all masses. Figures 10(a) and 10(b) indicate that the sensitivity of the system is higher for malignant masses than for benign masses. This is consistent with our observation in previous studies of our CAD system for digitized SFMs.36 However, since our current data set contained only 23 malignant cases, there will be large statistical uncertainty in the evaluation of sensitivity in this subset. A larger data set is being collected for comparing the detection performances of the CAD system between malignant and benign masses and also for the purpose of classifying malignant and benign masses. Furthermore, CAD algorithms developed for SFMs have been proven to be useful as a second opinion to assist radiologists in mammographic interpretation. Because of the higher SNR and linear response of digital detectors, there is also a potential that FFDMs can improve the sensitivity of breast cancer detection, especially in dense breasts. Several studies have been or are being conducted to compare FFDM with SFM in screening cohorts. It is also important to compare the performance of CAD systems between FFDMs and SFMs. A study is under way to compare the performance of the two systems on pairs of FFDM and SFM obtained from the same patients.51
V. CONCLUSION
Several FFDM systems have been approved for clinical applications. It is important to develop CAD systems for breast cancer detection in FFDM. In this work, we developed a CAD system that uses the raw FFDMs as the input. A multiresolution Laplacian pyramid enhancement method was devised to preprocess the raw FFDMs. A new prescreening method that combined gradient field analysis with gray level information was developed to identify mass candidates. Rule-based and LDA classifiers in a feature space which consisted of morphological features and SGLD texture features were designed to differentiate masses from normal tissues. It was found that our CAD system achieved a case-based sensitivity of 70%, 80%, and 90% with an estimate of 0.85, 1.31, and 2.14 FP marks/image, respectively, on normal cases. The results indicate that our mass detection CAD scheme can be useful for detecting masses on FFDMs. Studies are under way to further optimize the processing parameters, the feature extraction, and the classifiers for FP reduction. Comparison of mass detection performance of our CAD system for FFDMs and that for SFMs is also in progress.
Acknowledgments
This work is supported by USPHS Grant No. CA95153, U. S. Army Medical Research and Material Command Grant Nos. DAMD 17-02-1-0214 and W81XWH-04-1-0475. The content of this paper does not necessarily reflect the position of the government and no official endorsement of any equipment and product of any companies mentioned should be inferred. The authors are grateful to Charles E. Metz, Ph.D., for the LABROC and ROCKIT programs.
References
- 1.American Cancer Society. Statistics for 2004 2004 www.cancer.org.
- 2.Smart CR, Hendrick RE, Rutledge JH, Smith RA. Benefit of mammography screening in women ages 40 to 49 years: Current evidence from randomized controlled trials. Cancer (NY) 1995;75:1619–1626. doi: 10.1002/1097-0142(19950401)75:7<1619::aid-cncr2820750711>3.0.co;2-t. [DOI] [PubMed] [Google Scholar]
- 3.Feig SA, D’Orsi CJ, Hendrick RE, Jackson VP, Kopans DB, Monsees B, Sickles EA, Stelling CB, Zinninger M, Wilcox-Buchalla P. American College of Radiology guidelines for breast cancer screening. Am J Roentgenol. 1998;171:29–33. doi: 10.2214/ajr.171.1.9648758. [DOI] [PubMed] [Google Scholar]
- 4.Cady B, Michaelson JS. The life-sparing potential of mammographic screening. Cancer (NY) 2001;91:1699–1703. doi: 10.1002/1097-0142(20010501)91:9<1699::aid-cncr1186>3.0.co;2-w. [DOI] [PubMed] [Google Scholar]
- 5.Hillman BJ, Fajardo LL, Hunter TB, Mockbee B, Cook CE, Hagaman RM, Bjelland JC, Frey CS, Harris CJ. Mammogram interpretation by physician assistants. Am J Roentgenol. 1987;149:907–911. doi: 10.2214/ajr.149.5.907. [DOI] [PubMed] [Google Scholar]
- 6.Beam CA, Layde PM, Sullivan DC. Variability in the interpretation of screening mammograms by US radiologists—Findings from a national sample. Arch Intern Med. 1996;156:209–213. [PubMed] [Google Scholar]
- 7.Birdwell RL, Ikeda DM, O’Shaughnessy KF, Sickles EA. Mammographic characteristics of 115 missed cancers later detected with screening mammography and the potential utility of computer-aided detection. Radiology. 2001;219:192–202. doi: 10.1148/radiology.219.1.r01ap16192. [DOI] [PubMed] [Google Scholar]
- 8.Elmore JG, Nakano CY, Koepsell TD, Desnick LM, D’Orsi CJ, Ransohoff DF. International variation in screening mammography interpretations in community-based programs. J Natl Cancer Inst. 2003;95:1384–1393. doi: 10.1093/jnci/djg048. [DOI] [PMC free article] [PubMed] [Google Scholar]
- 9.Shtern F, Stelling C, Goldberg B, Hawkins R. Novel technologies in breast imaging: National Cancer Institute perspective. Orlando, FL: [Google Scholar]
- 10.Vyborny CJ. Can computers help radiologists read mammograms? Radiology. 1994;191:315–317. doi: 10.1148/radiology.191.2.8153298. [DOI] [PubMed] [Google Scholar]
- 11.Chan HP, Doi K, Vyborny CJ, Schmidt RA, Metz CE, Lam KL, Ogura T, Wu Y, MacMahon H. Improvement in radiologists’ detection of clustered microcalcifications on mammograms. The potential of computer-aided diagnosis. Invest Radiol. 1990;25:1102–1110. doi: 10.1097/00004424-199010000-00006. [DOI] [PubMed] [Google Scholar]
- 12.Warren Burhenne LJ, Wood SA, D’Orsi CJ, Feig SA, Kopans DB, O’Shaughnessy KF, Sickles EA, Tabar L, Vyborny CJ, Castellino RA. Potential contribution of computer-aided detection to the sensitivity of screening mammography. Radiology. 2000;215:554–562. doi: 10.1148/radiology.215.2.r00ma15554. [DOI] [PubMed] [Google Scholar]
- 13.Freer TW, Ulissey MJ. Screening mammography with computer-aided detection: Prospective study of 12,860 patients in a community breast center. Radiology. 2001;220:781–786. doi: 10.1148/radiol.2203001282. [DOI] [PubMed] [Google Scholar]
- 14.Brem RF, Baum JK, Lechner M, Kaplan S, Souders S, Naul LG, Hoffmeister J. Improvement in sensitivity of screening mammography with computer-aided detection: A multi-institutional trial. Am J Roentgenology. 2003;181:687–693. doi: 10.2214/ajr.181.3.1810687. [DOI] [PubMed] [Google Scholar]
- 15.Destounis SV, DiNitto P, Logan-Young W, Bonaccio E, Zuley ML, Willison KM. Can computer-aided detection with double reading of screening mammograms help decrease the false-negative rate? Initial experience. Radiology. 2004;232:578–584. doi: 10.1148/radiol.2322030034. [DOI] [PubMed] [Google Scholar]
- 16.Helvie MA, Hadjiiski LM, Makariou E, Chan HP, Petrick N, Sahiner B, Lo SCB, Freedman M, Adler D, Bailey J, et al. Sensitivity of noncommercial computer-aided detection system for mammographic breast cancer detection—A pilot clinical trial. Radiology. 2004;231:208–214. doi: 10.1148/radiol.2311030429. [DOI] [PMC free article] [PubMed] [Google Scholar]
- 17.Gur D, Sumkin JH, Rockette HE. Response to Re: Changes in breast cancer detection and mammography recall rates after the introduction of a computer-aided detection system. J Natl Cancer Inst. 2004;96:1261. doi: 10.1093/jnci/djh067. [DOI] [PubMed] [Google Scholar]
- 18.Feig SA, Sickles EA, Evans WP, Linver MN. Re. Changes in breast cancer detection and mammography recall rates after the introduction of a computer-aided detection system. J Natl Cancer Inst. 2004;96:1260–1261. doi: 10.1093/jnci/djh257. [DOI] [PubMed] [Google Scholar]
- 19.Winsberg F, Elkin M, Macy J, Bordaz V, Weymouth W. Detection of radiographic abnormalities in mammograms by means of optical scanning and computer analysis. Radiology. 1967;89:211–115. [Google Scholar]
- 20.Semmlow JL, Shadagopappan A, Ackerman LV, Hand W, Alcorn FS. A fully automated system for screening mammograms. Comput Biomed Res. 1980;13:350–362. doi: 10.1016/0010-4809(80)90027-0. [DOI] [PubMed] [Google Scholar]
- 21.Lau TK, Bischof WF. Automated detection of breast tumors using the asymmetry approach. Comput Biomed Res. 1991;24:273–295. doi: 10.1016/0010-4809(91)90049-3. [DOI] [PubMed] [Google Scholar]
- 22.Yin FF, Giger ML, Doi K, Metz CE, Vyborny CJ, Schmidt RA. Computerized detection of masses in digital mammograms: Analysis of bilateral subtraction images. Med Phys. 1991;18:955–963. doi: 10.1118/1.596610. [DOI] [PubMed] [Google Scholar]
- 23.Kimme C, O’Laughlin BJ, Sklansky J. Data Structures, Computer Graphics and Pattern Recognition. Academic; New York: 1975. Automatic Detection of Suspicious Abnormalities in Breast Radiographs. [Google Scholar]
- 24.Kegelmeyer WP, Pruneda JM, Bourland PD, Hillis A, Riggs MW, Nipper ML. Computer-aided mammographic screening for spiculated lesions. Radiology. 1994;191:331–337. doi: 10.1148/radiology.191.2.8153302. [DOI] [PubMed] [Google Scholar]
- 25.Ng SL, Bischof WF. Automated detection and classification of breast tumors. Comput Biomed Res. 1992;25:218–237. doi: 10.1016/0010-4809(92)90040-h. [DOI] [PubMed] [Google Scholar]
- 26.Karssemeijer N, te Brake G. Detection of stellate distortions in mammograms. IEEE Trans Med Imaging. 1996;15:611–619. doi: 10.1109/42.538938. [DOI] [PubMed] [Google Scholar]
- 27.Lai SM, Li X, Bischof WF. On techniques for detecting circumscribed masses in mammograms. IEEE Trans Med Imaging. 1989;8:377–386. doi: 10.1109/42.41491. [DOI] [PubMed] [Google Scholar]
- 28.Brzakovic D, Luo XM, Brzakovic P. An approach to automated detection of tumors in mammograms. IEEE Trans Med Imaging. 1990;9:233–241. doi: 10.1109/42.57760. [DOI] [PubMed] [Google Scholar]
- 29.Laine AF, Schuler S, Fan J, Huda W. Mammographic feature enhancement by multiscale analysis. IEEE Trans Med Imaging. 1994;13:725–740. doi: 10.1109/42.363095. [DOI] [PubMed] [Google Scholar]
- 30.Petrick N, Chan HP, Wei D, Sahiner B, Helvie MA, Adler DD. Automated detection of breast masses on mammograms using adaptive contrast enhancement and texture classification. Med Phys. 1996;23:1685–1696. doi: 10.1118/1.597756. [DOI] [PubMed] [Google Scholar]
- 31.Zheng B, Chang YH, Gur D. Computerized detection of masses in digitized mammograms using single-image segmentation and a multilayer topographic feature analysis. Acad Radiol. 1995;2:959–966. doi: 10.1016/s1076-6332(05)80696-8. [DOI] [PubMed] [Google Scholar]
- 32.Kobatake H, Murakami M, Takeo H, Nawano S. Computer detection of malignant tumors on digital mammograms. IEEE Trans Med Imaging. 1999;18:369–378. doi: 10.1109/42.774164. [DOI] [PubMed] [Google Scholar]
- 33.Li L, Clark RA, Thomas JA. Computer-aided diagnosis of masses with full-field digital mammography. Acad Radiol. 2002;9:4–12. doi: 10.1016/s1076-6332(03)80290-8. [DOI] [PubMed] [Google Scholar]
- 34.Gur D, Stalder JS, Hardesty LA, Zheng B, Sumkin JH, Chough DM, Shindel BE, Rockette HE. Computer-aided detection performance in mammographic examination of masses: Assessment. Radiology. 2004;233:418–423. doi: 10.1148/radiol.2332040277. [DOI] [PubMed] [Google Scholar]
- 35.Petrick N, Chan HP, Sahiner B, Wei D. An adaptive density-weighted contrast enhancement filter for mammographic breast mass detection. IEEE Trans Med Imaging. 1996;15:59–67. doi: 10.1109/42.481441. [DOI] [PubMed] [Google Scholar]
- 36.Petrick N, Chan HP, Sahiner B, Helvie MA, Paquerault S, Hadjiiski LM. Breast cancer detection: Evalution of a mass detection algorithm for computer-aided diagnosis: Experience in 263 patients. Radiology. 2002;224:217–224. doi: 10.1148/radiol.2241011062. [DOI] [PubMed] [Google Scholar]
- 37.Burt PJ, Adelson EH. The Laplacian pyramid as a compact image code. IEEE Trans Commun COM-31. 1983:337–345. [Google Scholar]
- 38.Dippel S, Stahl M, Wiemker R, Blaffert T. Multiscale constrast enhancement for radiographies: laplacian pyramid versus fast wavelet transform. IEEE Trans Med Imaging. 2002;21:343–353. doi: 10.1109/TMI.2002.1000258. [DOI] [PubMed] [Google Scholar]
- 39.Otsu N. A threshold selection method from gray-level histograms. IEEE Trans Syst Man Cybern. 1979;9:62–66. [Google Scholar]
- 40.Burgess A. On the noise variance of a digital mammography system. Med Phys. 2004;31:1987–1995. doi: 10.1118/1.1758791. [DOI] [PubMed] [Google Scholar]
- 41.Chan HP, Lo SCB, Niklason LT, Ikeda DM, Lam KL. Image compression in digital mammography: Effects on computerized detection of subtle microcalcifications. Med Phys. 1996;23:1325–1336. doi: 10.1118/1.597871. [DOI] [PubMed] [Google Scholar]
- 42.Kobatake H, Hashimoto S. Convergence index filter for vector fields. IEEE Trans Image Process. 1999;8:1029–1038. doi: 10.1109/83.777084. [DOI] [PubMed] [Google Scholar]
- 43.Wei J, Hagihara Y, Kobatake H. Detection of rounded opacities on chest radiographs using convergence index filter. ICIAP 99, Venice; 27–29 September, 1999; pp. 757–761. [Google Scholar]
- 44.Petrick N, Chan HP, Sahiner B, Helvie MA. Combined adaptive enhancement and region-growing segmentation of breast masses on digitized mammograms. Med Phys. 1999;26:1642–1654. doi: 10.1118/1.598658. [DOI] [PubMed] [Google Scholar]
- 45.Wei D, Chan HP, Petrick N, Sahiner B, Helvie MA, Adler DD, Goodsitt MM. False-positive reduction technique for detection of masses on digital mammograms: Global and local multiresolution texture analysis. Med Phys. 1997;24:903–914. doi: 10.1118/1.598011. [DOI] [PubMed] [Google Scholar]
- 46.Haralick RM, Shanmugam K, Dinstein I. Texture features for image classification. IEEE Trans Syst Man Cybern SMC-3. 1973:610–621. [Google Scholar]
- 47.Metz CE, Herman BA, Shen JH. Maximum-likelihood estimation of receiver operating characteristic (ROC) curves from continuously-distributed data. Stat Med. 1998;17:1033–1053. doi: 10.1002/(sici)1097-0258(19980515)17:9<1033::aid-sim784>3.0.co;2-z. [DOI] [PubMed] [Google Scholar]
- 48.Sahiner B, Chan HP, Petrick N, Wagner RF, Hadjiiski LM. Feature selection and classifier performance in computer-aided diagnosis: The effect of finite sample size. Med Phys. 2000;27:1509–1522. doi: 10.1118/1.599017. [DOI] [PMC free article] [PubMed] [Google Scholar]
- 49.Chakraborty DP. Maximum likelihood analysis of free-response receiver operating characteristic (FROC) data. Med Phys. 1989;16:561–568. doi: 10.1118/1.596358. [DOI] [PubMed] [Google Scholar]
- 50.Chakraborty DP, Berbaum KS. Observer studies involving detection and localization: Modeling, analysis, and validation. Med Phys. 2004;31:2313–2330. doi: 10.1118/1.1769352. [DOI] [PubMed] [Google Scholar]
- 51.Wei J, Sahiner B, Chan HP, Petrick N, Hadjiiski LM, Helvie MA. Computer aided diagnosis system for mass detection: Comparison of performance on full-field digital mammograms and digitized film mammograms. RSNA 2003; Chicago. 30 November–5 December 2003; p. 387. [Google Scholar]