Abstract
The authors are developing a computerized pulmonary vessel segmentation method for a computer-aided pulmonary embolism (PE) detection system on computed tomographic pulmonary angiography (CTPA) images. Because PE only occurs inside pulmonary arteries, an automatic and accurate segmentation of the pulmonary vessels in 3D CTPA images is an essential step for the PE CAD system. To segment the pulmonary vessels within the lung, the lung regions are first extracted using expectation-maximization (EM) analysis and morphological operations. The authors developed a 3D multiscale filtering technique to enhance the pulmonary vascular structures based on the analysis of eigenvalues of the Hessian matrix at multiple scales. A new response function of the filter was designed to enhance all vascular structures including the vessel bifurcations and suppress nonvessel structures such as the lymphoid tissues surrounding the vessels. An EM estimation is then used to segment the vascular structures by extracting the high response voxels at each scale. The vessel tree is finally reconstructed by integrating the segmented vessels at all scales based on a “connected component” analysis. Two CTPA cases containing PEs were used to evaluate the performance of the system. One of these two cases also contained pleural effusion disease. Two experienced thoracic radiologists provided the gold standard of pulmonary vessels including both arteries and veins by manually tracking the arterial tree and marking the center of the vessels using a computer graphical user interface. The accuracy of vessel tree segmentation was evaluated by the percentage of the “gold standard” vessel center points overlapping with the segmented vessels. The results show that 96.2% (2398/2494) and 96.3% (1910/1984) of the manually marked center points in the arteries overlapped with segmented vessels for the case without and with other lung diseases. For the manually marked center points in all vessels including arteries and veins, the segmentation accuracy are 97.0% (4546/4689) and 93.8% (4439/4732) for the cases without and with other lung diseases, respectively. Because of the lack of ground truth for the vessels, in addition to quantitative evaluation of the vessel segmentation performance, visual inspection was conducted to evaluate the segmentation. The results demonstrate that vessel segmentation using our method can extract the pulmonary vessels accurately and is not degraded by PE occlusion to the vessels in these test cases.
Keywords: pulmonary vessels, vessel segmentation, multiscale filtering, pulmonary embolism, computer-aided detection
I. INTRODUCTION
Vascular diseases are very common, especially as people age. Most vascular diseases are caused by conditions that clog or weaken blood vessels or damage valves that control the flow of blood in and out of the veins. Pulmonary embolism (PE) is a common, potentially fatal condition in all age groups associated with significant morbidity and mortality in untreated patients. Prompt and accurate diagnosis of PE greatly influences patient outcome.1–3 Unfortunately, the clinical diagnosis of PE is difficult because symptoms are often vague and nonspecific, leading to misdiagnosis. Computed tomographic pulmonary angiography (CTPA) is an effective means for clinical diagnosis of PE.4–11 However, each CT scan for PE produces an average of about 300 axial images with a range of 200–600. Multiplanar reconstruction viewing of vessels further increases the number of images to be read. Interpretation of a CT study demands extensive reading time from a radiologist who has to visually track each vessel, distinguish arteries from veins and bronchi, adjust window and level settings, and inspect each artery for possible pulmonary emboli (PEi) on a workstation. The advent of multidetector CT offers the possibility of detecting subtle PEi in subsegmental arteries but it also makes CTPA interpretation an even more demanding task. It is difficult to review small subsegmental vessels not only because of the large number of these vessels, but also because of their lower conspicuity due to partial volume effects. False negatives (missed diagnosis) may occur due to the complexity of the images and the large number of vessels to be tracked in each case. Computer-aided diagnosis (CAD) may assist radiologists in PE detection by reducing the chance of missing PEi. Using a computer to automatically detect PE on CTPA images is a new and challenging task. With advanced computer vision techniques, the computer is expected to be able to automatically trace the pulmonary vessels, distinguish arteries from veins, detect suspicious PE locations by searching along the arteries, and finally alert the radiologists to the regions of interest (ROI) for suspicious PEi.
Because PEi only occurs inside pulmonary vessels, segmentation and tracking of vessels constitute the fundamental steps to limit the search space for identifying ROIs that contain suspicious PEi. Many of the published vessel segmentation and tracking methods provided accurate results in 2D or 3D images for vascular structures in the retina, brain, liver, etc. However, few studies have been conducted for segmentation, tracking, and reconstruction of the pulmonary vessel tree on CTPA images because the pulmonary vessels are more complicated compared to the vessels in other parts of the body in several aspects: widely distributed CT values, large variations of vessel sizes ranging from 1 to 20 mm, and the complicated branching structures.
Multiscale filtering has been used for the segmentation of curvilinear or tubular structures in 3D medical images12–19 and share a common approach: the images are convolved with 3D Gaussian filters at multiple scales and the eigenvalues of the Hessian matrix at each voxel are analyzed in terms of a response function to determine the shape of the local structures in the image. The eigenvalues for the voxels that correspond to a linear structure would be different from those that correspond to a planar structure, blob, noise, or no structure. The response of the enhancement filter reaches its maximum when the scale of the filter matches the size of the local structures. The local structures can then be extracted using the local maxima.16 Other efforts in vessel segmentation and tracking include hysteresis thresholding,20 region growing,6,21 statistical modeling, and matching methods22,23 using a priori knowledge provided by radiologists, direction field based segmentation, and detection,24 and deformable model approaches25,26 in which an initial surface estimate is deformed iteratively to optimize an energy criterion so that the model boundary is extended to the vessel wall as a so-called minimal surface. However, for the PE diagnosis task, it is difficult to track or segment vessel structures in 3D volume using conventional methods because pulmonary vessels cannot be accurately segmented and continuously tracked if they are largely or totally obstructed by PE. The problem becomes even more difficult if the PE appears to be connected to its surrounding lymphoid tissues due to partial volume effect, which can easily cause leaking to the soft tissues during vessel segmentation.
We previously developed a vessel tracking method using multi-level expectation-maximization (EM) estimation for segmentation of the vessel in local volumes.27,28 In this study we further improve the segmentation by developing an enhancement method based on the eigenvalues of the Hessian matrix at multiple scales. A new response function was designed specifically for the pulmonary vessel tracking problem. The effectiveness of the method was evaluated by comparison with vascular trees manually tracked by experienced radiologists.
II. MATERIALS AND METHODS
II.A. Materials
CTPA cases from patient files at the University of Michigan were collected retrospectively without identification with the approval of our Institutional Review Board. Two cases were used as a test set in this study. Case 1 (67 years old male) was acquired with a 16-slice GE LightSpeed16 CT scanner, 140 kVp, 370 mAs, 1.25 mm collimation, and reconstructed at 1.25 mm slice thickness. Case 2 (30 years old female) was acquired with a four-slice GE LightSpeed Qx/i CT scanner, 120 kVp, 370 mAs, 1.25 mm collimation, and reconstructed at 1.00 mm slice thickness. The exams were performed with injection of 135 cm3 of low osmolar non-ionic contrast (300 mg/cm3 of iodine) at 4 ml/s.
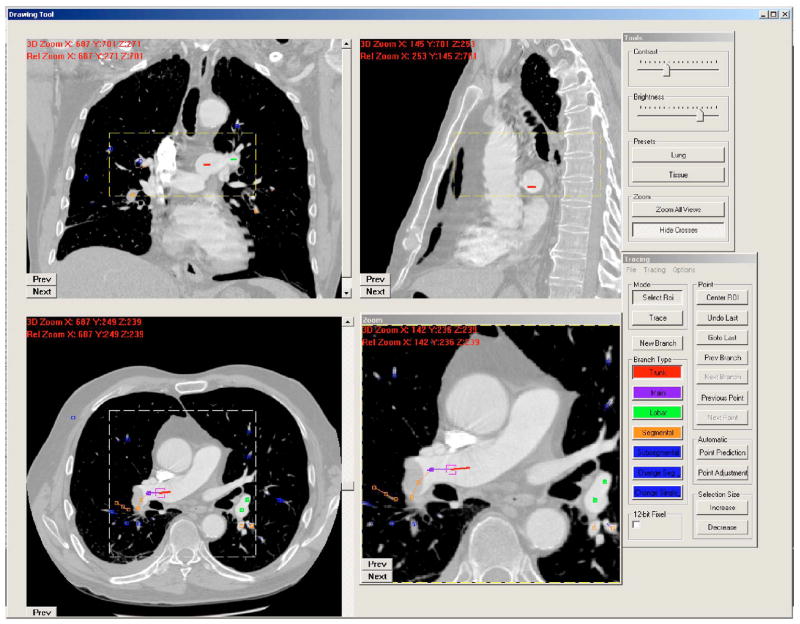
The two CTPA cases were diagnosed as positive PE cases during the patients’ clinical care. Two experienced thoracic radiologists identified PEs at multiple levels of the pulmonary arteries. The percentages of PE occlusion in the vessels ranged from 20% to 100%. Both cases were judged by the radiologists to have “good contrast” and minimal motion artifacts, but case 2 contained pleural effusion disease. The radiologists (S.P. and P.C.) provided gold standards for the pulmonary vessels including arteries and veins by manually tracking the vessel tree and marking the center of the vessels using a graphical user interface (GUI) developed in our laboratory, as shown in Fig. 1. On the GUI, the sagittal view, axial view, and coronal view of the CTPA scans corresponding to the region where a vessel is being tracked are displayed on a monitor. The GUI has functions allowing the user to cine-page through the CT slices, scroll in and out of individual vessels, adjust window setting, and zoom to improve visualization. The user can manually track the vessel trees by marking the vessel center points in any one of the three views at each vessel branch and the center point location will automatically propagate to all three views. Using the GUI, the radiologists marked the approximate centerline for each branch, identified it as an artery or a vein, and labeled the anatomical level of the arteries (pulmonary trunk, main, lobar, segmental, and subsegmental). A total of 4689 and 4732 vessel center points were marked by radiologists, respectively, for cases 1 and 2. Of the 4689 points in case 1, 2494 were marked as located in arteries. Of the 4732 points in case 2, 1984 were marked as located in arteries. For case 2, they were not able to track the vessels into the denser part of the small area of pleural effusion in the right lower lobe. The two CTPA cases with radiologist-provided gold standards were used as an independent test set to evaluate the performance of the vessel tree segmentation algorithm.
Fig. 1.
A screen shot of our computer graphic user interface for manually tracking and marking vessels.
In addition to the two test cases, one CTPA patient case was selected from the database and used as a training case for algorithm development. Because manual tracking of the vessel tree is very time consuming, the radiologists did not provide manually tracked vessel tree for this case. The training process in our algorithm development was based on visual inspection of the vessel segmentation result. Visual inspection is important for evaluating the segmentation of small vessels because many of those may be smaller than the sizes that the radiologists can track (see also Secs. III and IV). Although only one training case was used, each CTPA case contained numerous vessels of similar sizes and different sizes so that vessel segmentation could be trained with effectively a large sample of vessels.
II.B. Methods
II.B.1. Vascular structure enhancement
Multiscale 3D filters have been used in several studies to enhance local structures, such as tissue boundaries, cortices, vessels, and nodules, in medical volumetric data.12–18 We found that the conventional multiscale 3D filters are limited to specific structures of interest because their filter response functions are defined explicitly. For example, a filter designed to enhance tubular structures cannot enhance the vessel bifurcation which forms a blob-like structure when the vessel splits into two or more branches, thus causing a gap between the vessel branches. Similarly, a filter designed to enhance blob-like structure cannot enhance tubular structures. In this study, we therefore designed a new multiscale 3D filter using the eigenvalues of the Hessian matrix to enhance all vascular structures including vessel bifurcations and to suppress nonvessel structures such as the lymphoid tissue surrounding the vessels.
Let I(r⃗) be a 3D image with voxels at points r⃗ = (x,y,z), its Taylor series approximation up to second order for three variables about a point r⃗ = a⃗ is
| (1) |
where ∇I(a⃗) is the gradient and ∇2I(a⃗) is the Hessian matrix H at point a⃗, given by the second-order partial derivatives of the image I(r⃗),
| (2) |
To enhance local structures of variable sizes, the partial second derivatives of I(r⃗) in the Hessian matrix can be calculated by convolving I(r⃗) with the partial second derivatives of Gaussian filters with variable standard deviation σ, for example,
| (3) |
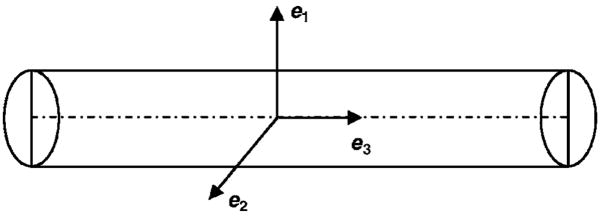
The Hessian matrix H describes the second-order local intensity variations around each point of a 3D structure. Let the eigenvalues of H be λ1, λ2, λ3 (|λ1| > |λ2| > |λ3|, and their corresponding eigenvectors be e1, e2, e3, respectively. The eigenvector e1 corresponding to the largest eigenvalue λ1 represents the direction along which the second derivative is maximum and λ1 gives the maximum second derivative value. For an ideal tubular structure in 3D volume, as shown in Fig. 2 and summarized in Table I, the voxels at the centerline of the tube will be signaled by λ3 being approximately zero and λ1 and λ of larger magnitudes. Similarly, for an ideal sphere, the three eigenvalues λ1, λ2, λ3 will be equal at the center of the sphere. Analyzing the second derivatives using eigenvalues thus has an intuitive explanation that the three eigenvalues play an important role in discriminating structures of different shapes. However, the studies of Sato et al.,29 Lorenz et al.,15 and Li et al.17 only make use of two eigenvalues in their 3D line filters for vessel enhancement. Based on an analysis of the three eigenvalues, Frangi et al.14 combined three measurements to define a vesselness response function for vessel enhancement. Two measurements were designed as two geometric ratios, one for the discrimination between a blob-like structure and a tubular or plate-like structure, and the other for the discrimination between a tubular and a plate-like structure. The third measurement was designed to measure the contrast of the structures. Three parameters have to be trained to control the sensitivity of the line filter to the three measurements in their study.
Fig. 2.
An ideal tubular structure and its eigenvectors.
Table I.
Characteristics of the eigenvalues of the Hessian matrix corresponding to structures of different shapes in 3D volume.
| Tubular structure | Blob-like 3sphere3 structure | Plate-like structure |
|---|---|---|
| |λ3(r)| ≈ 0 | |λ3(r)| ≈ |λ2(r)| ≈ |λ1(r)| | |λ2(r)| ≈ |λ3(r)| ≈ 0 |
| |λ1(r)| ≈ |λ2(r)| ≫ |λ3(r)| | |λ3(r)| > 0 | |λ1(r)| ≫ |λ2(r)| |
Based on the characteristics of the three eigenvalues of the Hessian matrix, we developed a new multiscale response function R(r⃗σs;λ1, λ2, λ3 to enhance all vascular structures including vessel bifurcations and to suppress nonvessel structures such as the lymphoid tissue surrounding the vessels,
| (4) |
where λ1, λ2, λ3 (|λ1| > |λ2| > |λ3|are Hessian eigenvalues at voxel r⃗ =(x,y,z) in a 3D image, σs is the standard deviation of the Gaussian kernel at scale s, and c is a constant. The negativity of the eigenvalues is due to the fact that the vascular structures are brighter than the background in the CTPA images and occupy a relatively small volume.
The constant c plays an important role in enhancement of both the tubular and the blob-like structures in Eq. (4). As summarized in Table I, for a branch of the vessels that has tubular structure, |λ1| ≈ |λ2|, |λ1| ≫ |λ3|, and |λ3| ≈ 0. and The response RC of tubular structures can be approximated as
| (5) |
where .
Similarly, for the vessel bifurcation which forms a blob-like structure when the vessel splits into two or more branches, |λ1| ≈ |λ2| ≈ |λ3|. The response RB of blob-like structures can be approximated as
| (6) |
where .
The lymphoid tissues surrounding the pulmonary vessels which generally are plate-like structures with |λ1| ≫ |λ2|, and|λ2| ≈ |λ3| ≈ 0,
| (7) |
where κ =1/2 exp(−|1 − c|).
The largest eigenvalue |λ1| of a plate-like structure is usually much smaller than the largest eigenvalue of a tubular or a blob-like structure at the same scale if the size of the local structure of the lymphoid tissue is larger than that of vascular structure, the response function RP is therefore even smaller.
The value of α is at its maximum of 1 when and β is at its maximum of 1 when . The maximum of κ is only 0.5 when c=1. To maximize the differences of RC and RB from RP, the value of c should be set to between 0.57 and 0.71. For example, if c is chosen to be 0.64, both RC and RB can be as high as 0.94|λ1| and RP will be low at 0.35|λ1|. Considering the real situation in medical images that vascular structures are not an ideal cylinder or sphere, c was set to 0.7 in our study.
II.B.2. Vessel segmentation
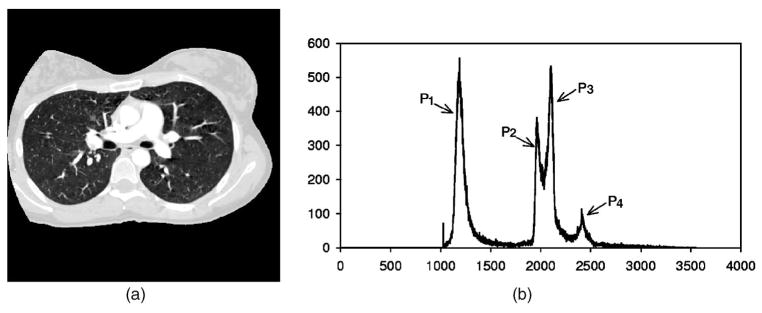
As shown in Fig. 3, the voxel value histogram of a typical CTPA image slice of which the voxel values were transformed to 0–4095 to facilitate image processing. The air region outside the patient body was excluded by thresholding at a voxel value of 50. The histogram exhibits several peaks that generally correspond to the lung region (P1), the chest wall (P2), the soft tissue region (P3), and vessels and bones (P4). To separate these regions, in our previous study,28 a 3D multistage adaptive segmentation (MAS) method was developed to cluster voxels into soft tissue, chest wall, lung region, and vascular structures based on EM analysis. In this study, the MAS method was modified into two EM segmentation steps, one for extracting the volume of lung region and the other for segmenting pulmonary vascular structures on vessel enhanced images.
Fig. 3.
(a): Typical CT slice image. (b): Histogram of thoracic region excluding air region outside the patient body (CT value was converted to gray level ranged from 0 to 40953. P1: lung regions, P2, P3: chest wall and soft tissue, and P4: vascular structures and bones.
II.B.2.a. EM segmentation method
EM was proposed as an algorithm to be used for estimation of missing model parameters.30 It can also be defined as a probabilistic counterpart to fuzzy clustering. Image segmentation can be reformulated as a “missing data” problem if we assume each image pixel is produced by a probability density associated with one of the segments.31 Assuming that the pixel values associated with a given segment i has a probability density p(x|θi), where θi s the set of parameters for the density function associated with the ith segment. Using the total probability theorem, the probability density for a pixel is
| (8) |
where S is the number of segments and πi is the prior probability for the ith segment. Given a set of image pixels X = {xk, k =1, …, n}, the segmentation task is the inverse problem of estimating the parameter set Θ = {θi, i =1, …, S}, πi and the labels for all the pixels. Assuming that the pixel values are independent, the parameter set Θ of the density functions can be estimated by maximizing the likelihood of the data set written as
| (9) |
using EM iteration as follows. Each image segment is assumed to be characterized by a Gaussian distribution p(x|θi) − G(μi, σi) At the E step, EM computes the expected value (of the complete data) of the probability that the kth pixel comes from the ith segmented component as
| (10) |
and at the M step, EM maximizes the likelihood of the complete data to estimate Θ,
| (11) |
The EM algorithm iterates between these two steps until it reaches convergence.
The segment labels Lk for all the pixels X={xk, k =1, …, n} can be estimated using the method of maximum a posterior, given the density parameter set Θ,
| (12) |
In our study, we assumed that the number of components (or segments, classes) was known, based on a priori knowledge of the regions being segmented, which was used to set the number of Gaussians in the EM segmentation. Gaussians with equal variances was evenly placed across the histogram of the image as the initial estimates. The EM segmentation algorithm iterated until convergence was reached.
II.B.2.b. Lung region segmentation
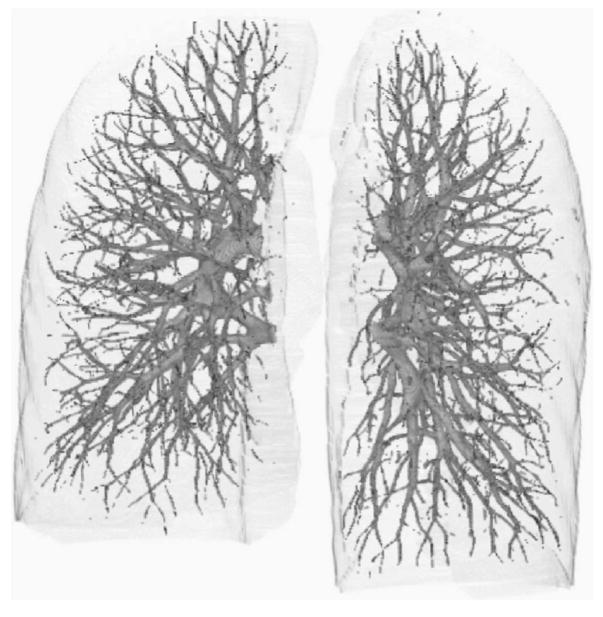
In our vessel segmentation scheme, the lung region was first extracted to reduce computation time and avoid the effects caused by other nonvascular structures such as ribs, motion artifacts of the heart, and the edges of the heart and chest walls. The EM segmentation method was applied to the volume of the scan within the patient body (Fig. 3) to extract lung regions assuming there were two classes (S=2) in the volume: lung regions (P1) as class 1, and other structures not belonging to class 1 as class 2. A 3D rolling ball method32 employing morphological “closing” operation (dilation followed by erosion) was used to “fill” in the gaps along the boundary of the lung region and “holes” inside the lung regions. Figure 4 shows an example of 3D volume rendering of the segmented left and right lungs. The surfaces of the segmented lung regions formed the boundaries of the volumes for subsequent vessel segmentation. The chest wall, bones, and mediastinum are thus excluded.
Fig. 4.
Example of segmented left and right lung volumes.
II.B.2.c. Integration of vessel segmentation at multiple scales
The pulmonary vascular structures within the lung regions have sizes over a wide range. To adapt the 3D enhancement filter response to cover the various sizes, a widely used method to integrate multiscale responses is to calculate the second-order partial derivatives of the 3D image I(r⃗) in the Hessian matrix by convolving I(r⃗) with the second-order partial derivatives of Gaussians having variable standard deviations.14,15,33,34 By adjusting the standard deviations of the Gaussian kernels, the local structures with a specific range of sizes can be enhanced by combining the local maxima of the filter response at multiple scales.
In order to have a fair comparison of the responses among multiple scales, the filter responses have to be first normalized.35 The maximum response among the multiple scales can then be selected as the optimal filter response that matches the vessel size. To achieve this, a normalization parameter γ can be incorporated in Eq. (2) when calculating the Hessian matrix H of image I(r) at scale s and Eq. (2) can be rewritten as
| (13) |
Similarly, the second-order partial derivatives can be calculated as a convolution with the corresponding derivatives of Gaussians, for example,
| (14) |
The normalization factors were determined in previous studies by using Gaussian-shape models for the ideal step edge, plate, line, and blob structures.12,17,29 However, the normalization factors estimated from the idealized models of the structures do not work well for real structures in clinical images according to our experimental observations.
In this study, we developed a multiscale segmentation scheme to integrate the segmented vascular structures at multiple scales. This scheme was based on the second EM segmentation method used in our previous multistage adaptive segmentation technique.28 If a given local volume contains some structures, the response function in Eq. (4) may enhance the structures to different degrees at different scales. The voxels with a high response value indicate that there is an enhanced vessel and its size matches the given filter scale, whereas the voxels with a low response value may belong to a suppressed structure such as lymphoid tissue or a vessel of a size that does not match the filter size. The EM segmentation algorithm is then applied to the volume containing the response values to segment the vessels by extracting the high response voxels and setting all low response voxels to zero at this single scale. To integrate the segmented vessels at all scales, the simplest way is to unite all the segmented voxels on all scales. However, this will lose the vessel size information which is useful in the analysis of vessel structures for PE detection and other applications. We therefore designed a hierarchical integration scheme to combine the segmented vessels at all scales and retain their size information. We assume that the sizes of the largest and the smallest vessels that are expected to be extracted correspond to filter scales from SMax down to SMin(SMax>SMin). The process of integrating the segmented structures at multiple scales begins from the maximum scale SMaxdown to the minimum scale SMin. Let the EM segmented vascular structure at scale Sk, (k=Min, …, Max) be T(x, y, z; Sk) at voxel (x, y, z) in the 3D volume of response values. The segmented V(x, y, z) is integrated recursively as:
-
First segmentation at scale SMax:
-
For scale Sk = SMax−1 down to Smin.
If V(x, y, z)= 0, then:
The voxels in the integrated volume will be the first nonzero segmented voxels and labeled as the scale value Sk(k =Min, …, Max) when going from the larger segmented vascular structure down to the smaller structure, thus recursively incorporating the smaller segmented structures to the integrated volume. In our study, this process is performed for 12 scales (σ = 1,2, …, 12), corresponding to a vessel size ranging approximately from 2 to 24 mm in diameter. The voxels in the integrated volume thus have values V(x,y,z) ∈ [0,12].
III. RESULTS
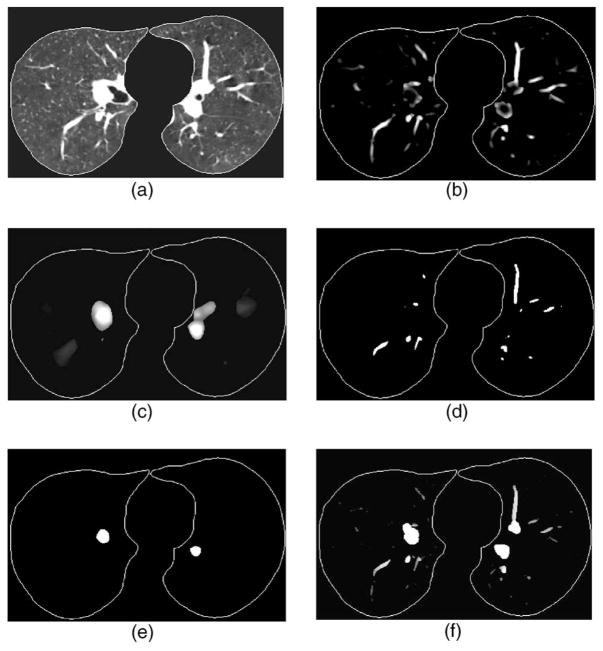
Figure 5 shows an example of the responses of our 3D multiscale vessel enhancement filter at different scales and the segmented vessels and structures of different sizes. The example demonstrates that the multiscale filter can selectively enhance the vessels that match the given filter scale and the enhanced vessels can be segmented correctly using EM analysis algorithm.
Fig. 5.
Example of vessel segmentation at different scales. (a) CT volume after lung region extraction—only one slice is shown from demonstration, (b) output of the response function at scale corresponding to vessels of about 6 mm in diameter, (c) output of the response function at scale corresponding to vessels of about 14 mm in diameter, (d) and (e) segmentation of (b) and (c) using EM segmentation method, and (f) the vessel image after combining the segmentation results from all scales by the hierarchical integration scheme, the gray values, ranging from 0 to 12, indicate that the voxels were segmented at different scales that corresponded to different vessel sizes.
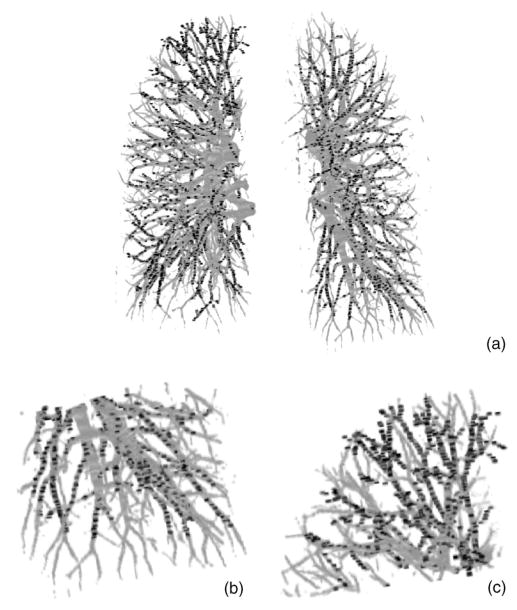
Two CTPA cases were used to evaluate the performance of the pulmonary vessel segmentation method. Using radiologists’ manually marked vessel center points as the “gold standard,” the accuracy of the vessel segmentation was estimated as the percentage of gold standard points overlapping with the computer segmented vessels. This performance metric is used to estimate the completeness of a vessel tree reconstructed from the segmented vessels and the percentage of missed vessels (false negatives), which are useful measures for the application of computer-aided PE or lung nodule detection utilizing pulmonary vessel segmentation. Table II summarizes the accuracy of the segmentation for the two test cases. The results show that 96.2% (2398/2494) of the manually marked center points in the arteries overlapped with the segmented vessels for the case without and 96.3% (1910/1984) for the case with other lung diseases. For the manually marked center points in all vessels including arteries and veins, the segmentation accuracy was 97.0% (4546/4689) for the case without and 93.8% (4439/4732) for the case with other lung diseases. Figure 6 shows the pulmonary tree segmented by our vessel segmentation method for the test case without pleural effusion disease.
Table II.
Segmentation sensitivity estimated as the percentage of gold standard points overlapping with the computer-segmented vessels for arteries only and for the entire vascular tree including both arteries and veins.
| Case 1 | Case 2 | |||||
|---|---|---|---|---|---|---|
| No. of gold standard center points | TPs | Sensitivity (%) | No. of gold standard center points | TPs | Sensitivity (%) | |
| Artery | 2494 | 2398 | 96.2 | 1984 | 1910 | 96.3 |
| Artery and vein | 4689 | 4546 | 97.0 | 4732 | 4439 | 93.8 |
Fig. 6.
Example of computer segmented pulmonary vascular trees for the test case without pleural effusion disease.
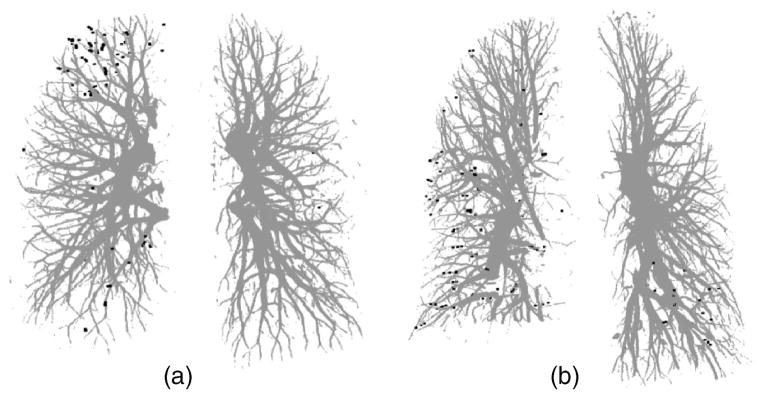
For the clinical cases, there is no “ground truth” to prove the presence or absence of the vessels and their sizes. In our study, the manually marked center points of the vessels by radiologists were used as the gold standard for quantitative evaluation of the segmentation accuracy of the vessels. However, the improved quality of the pulmonary vessels in multidetector CT scans with thinner collimation (1.25 mm) can allow visualization up to the seventh order vessels.10 It is a demanding task for radiologists to mark the center points manually along small peripheral vessels on images displayed on a computer monitor. The radiologists decided to stop marking the center points on the peripheral vessels at certain levels, leaving some vessels not marked. Therefore, a visual inspection was performed to evaluate those vessels that were not marked by radiologists. Figure 7(a) shows an example of the manually marked vessel center points (black points) superimposed on the computer segmented vessels. Figures 7(b) and 7(c) show two enlarged local regions of the vessel tree shown in Fig. 7(a) It can be seen that many of the small vessels not marked by radiologists were extracted by our segmentation method. These small vessels were estimated to be smaller than 2 mm in diameter by manual measurement using an electronic ruler on the computer graphical user interface. Figures 8(a) and 8(b) show the false negative vessel center points that were missed by our vessel segmentation method in the two test cases. Both Figs. 8(a) and 8(b) illustrate that all of the missed vessels (the gold standard vessels that were not segmented) were subsegmental peripheral vessels and they were also estimated to be smaller than 2 mm in diameter by manual measurement on the CT scans using the GUI. Some of the vessels in the lower right lobe of case 2 could not be segmented by our computer algorithm, due to the area of pleural effusion. However, these vessels are not shown as false negatives in Fig. 8(b) because they could not be tracked by the radiologists either.
Fig. 7.
Comparison of radiologist’s marked vessel center points with the computer-segmented vascular trees for the test case without pleural effusion disease. (a) Computer-segmented vascular trees within the left and right lungs superimposed with the gold standard vessel center points (black points); (b) the enlarged lower region of the left lung [lower right part in (a)], and (c) the enlarged upper region of the right lung [upper left part in (a)] showing the detail of the subsegmental peripheral vessels.
Fig. 8.
False negative vessel center points indicating missed vessels by our automated vessel segmentation method compared to radiologist’s manual tracking for (a) the test case without other disease and (b) the test case with pleural effusion disease. All of the false negative vessel center points were located in subsegmental peripheral vessels for both test cases.
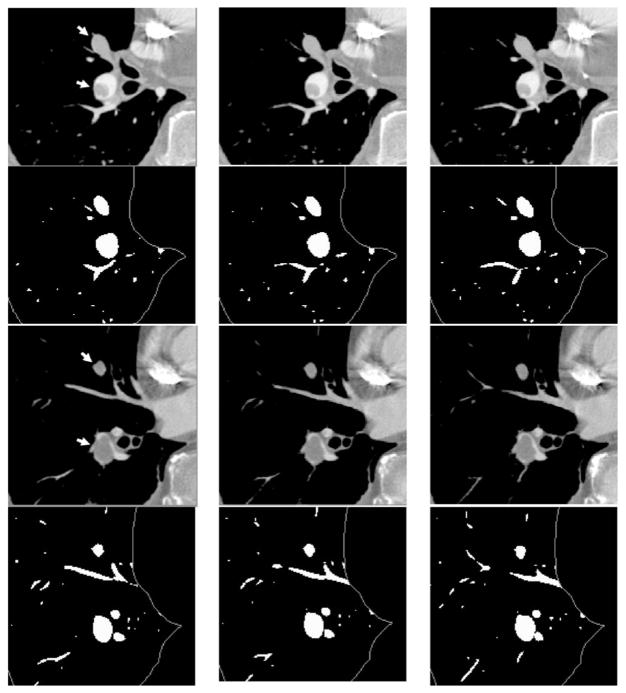
In our study, experienced radiologists identified 13 and 7 PEi, respectively, in arteries from lobar down to the subsegmental level in test cases 1 and 2 and the percentages of occlusion in the arteries by the PEi ranged from 10% to 100%. The segmented arteries that were occluded by the PEi were visually inspected and no significant degradations were observed. Figure 9 shows examples of the vessel segmentation for arteries obstructed by PEi at different occlusion percentage to the vessels as estimated by our experienced radiologists. Two different sequences of CT slices are shown in the first row and the third row. The second and the fourth row are segmented vessels using our automated vessel segmentation method. Multiple PEis found by experienced radiologists are indicated by arrows. In the first row, the upper PE occluded the artery at 100% and the lower one occluded about 40%. Both PE occluded arteries were surrounded by lymphoid tissues and the upper PE was also connected to its surrounding lymphoid tissues. The example shown in the third row contained two PEi: 100% occlusion to the artery by the upper PE and about 95% occlusion by the lower one. As shown in the segmented vessel images, the vessels occluded by the PEi can be segmented accurately, even if the vessels were fully (100%) obstructed by PEi or surrounded by lymphoid tissues.
Fig. 9.
Examples of vessel segmentation for arteries occluded by PEi at different occlusion percentage to the vessels. The PEi are indicated by arrows. The images in the first and the third row are two different sequences of CT slices from the same scan (test case 1), the second and the fourth row are segmented vessels. The vessel integration images were converted to binary images to highlight the small vessels for displaying purpose. There were two PEis in the first row. The upper PE occluded the artery at 100% and the lower one was about 40% occlusion. Both PE-occluded arteries were surrounded by lymphoid tissue, and the upper PE was connected to its surrounding tissue. The example shown in the third row also contained two PEis: 100% occlusion by the upper PE and about 95% occlusion by the lower one.
IV. DISCUSSION
Segmentation and reconstruction of the pulmonary vessel tree on CTPA images is a challenging task. The pulmonary vessels are complicated compared to the vessels in other parts of the body because of their widely distributed CT values, large variations of vessel sizes, and complicated anatomic structures. The conventional multiscale vessel segmentation methods for 3D images share a common approach in which the local behavior of an image (or 3D volume) is approximated by its Taylor expansion up to the second order as shown in Eq. (1) 12–18 The analysis of eigenvalues of the Hessian matrix can thus be used to design a multiscale filter to enhance tubular structures. The response of the enhancement filter is maximal when its scale matches the size of the vessel. The enhancement filter has to be normalized in order to determine the local maximum of the response function at multiple scales. However, it is difficult to select the normalization parameter γ for an enhancement filter designed to enhance a number of different structures. The analytical models have to be established by studying the relationship between the scales at which a specific structure needs to be enhanced, the normalization parameter γ, and the size of the structure. Extensive studies were conducted to build and analyze these models.12,35
To avoid the selection of normalization parameter γ in our pulmonary vessel enhancement filter, we designed a multi-scale vessel segmentation scheme to combine the vessel structure enhancement and vessel segmentation processes. At each scale, the 3D image output from the response function defined in Eq. (4) is directly segmented using a multiscale segmentation scheme based on EM segmentation algorithm.28 Instead of finding the maximum response from all scales at each voxel in the 3D images which would require normalized responses for all scales, our method only finds the voxels with high responses at an individual scale and segments those high response voxels using EM segmentation method. Because there is no direct comparison of the response between different scales, it is not necessary to normalize the response values in our method.
PEi can obstruct an artery at any level and of any size up to 100% occlusion to the vessel. It is difficult to segment a vessel obstructed by PE accurately. This problem becomes more severe when the PE appears to be connected to the vessel wall and the lymphoid tissues surrounding the vessel because the CT values of the PEi are very close to those of the soft tissues. Our results demonstrate that the vessels occluded by PEi can be segmented accurately even if the vessels were fully (100%) obstructed by PEi or surrounded by lymphoid tissues. Although the number of PEis in our test set is limited, the results indicate that our proposed method is promising for segmentation of occluded vessels in CTPA images. The ability of excluding soft tissues that surround the arteries is very important for PE detection because the CT values of PEi are very close to those of the soft tissues. The soft tissues may be detected as false positive PEi, or the true PE may be excluded as soft tissues.28
In our study, our vessel segmentation method was tested on two CTPA cases acquired with PE diagnosis protocol in our institution. We demonstrated that the pulmonary vessels can be extracted accurately. It is still unknown if the performance of our algorithm will be degraded in low dose CTPA scans or noncontrast CTPA studies. In a separate study, we applied our vessel segmentation method to false positive reduction for lung nodule detection by segmenting the detected objects and extracting shape features to differentiate nodules and pulmonary vascular structures.36 A data set of 58 non-contrast CT scans acquired with mA s ranging from 50 to 570 were used as test set. We found that the new features extracted from the segmented structures can significantly reduce the FPs in nodule detection. These results provide some indication that our vessel segmentation method may be applicable to low dose noncontrast CTPA scans. However, the generalizability of a CAD system to image data acquired with different equipment and different imaging techniques is an important issue in CAD. The performance of our vessel segmentation method under different conditions has to be investigated in future studies.
Quantitative evaluation of vessel segmentation accuracy and the completeness of arterial tree reconstruction is a challenging problem because there is no ground truth for the pulmonary vessel tree for clinical cases. Although a tubular phantom can be constructed with known “vessels,” it is difficult to construct a realistic phantom with a complete arterial tree mimicking complicated pulmonary vascular structures. In a recent study by Shikata et al.,18 about 2000 points were manually placed along the pulmonary vessels in each case as true vessel points for quantitative evaluation of a pulmonary vascular tree segmentation method. This method will provide an estimate of the fraction of the vessel tree segmented by the computer relative to that marked manually if the “representative” points are placed with reasonably balanced distribution in the entire pulmonary vascular tree. In our study, two patient CTPA cases were chosen as representative cases from our collected data set: an optimal case with good contrast, no visible motion artifacts, and no other lung diseases and artifacts; and a suboptimal case containing small area of pleural effusion diseases. Although the number of cases is small, the total number of center points that mark the entire pulmonary vessel tree down to very small vessels, for example, the segmental and subsegmental levels of arteries, is quite large (more than 4500 for both cases). The evaluation including quantitative comparison and visual inspection on these two cases allows us to obtain a reasonable assessment of the vessel segmentation performance in this preliminary study.
Because the radiologists’ manually marked center points were used as the gold standard for evaluation of the completeness of the vessel tree segmentation, it will not allow us to report the false positive rate because it is difficult to determine whether segmented vessels that did not overlap with the radiologists’ center points were true or false vessels and count the number of the false vessels quantitatively. The visual inspection, for example, as shown in Fig. 7, indicates that many of the small vessels that were not marked by radiologists but segmented by the computer appeared to be true vessels. Further work is underway to investigate methods for estimation of false positive segmentation.
V. CONCLUSION
Three-dimensional multiscale filtering in combination with a newly developed response function derived from the eigenvalues of Hessian matrices can effectively enhance the pulmonary vascular structures including vessel bifurcations. A combination of multiscale enhancement with EM estimation provides accurate segmentation of the pulmonary vascular tree having a wide range of vessel sizes. The results demonstrate that vessel segmentation using our method can extract the pulmonary vessels accurately and the performance is not degraded by PE occlusion to the vessels in the test scans used in this study. Automated pulmonary vessel segmentation will provide the foundation for many thoracic image analysis tasks in CAD applications including PE detection and lung nodule detection.36 Further investigations are being conducted to improve tracking of the arterial tree, develop methods for differentiation of the arterial tree and the venous tree, identify locations with PEi, and to evaluate the performances with a larger data set.
Acknowledgments
This work is supported by USPHS Grant Nos. R21 EB005851 and R01 CA93517.
References
- 1.Dalen J, Alpert J. Natural history of pulmonary embolism. Prog Cardiovasc Dis. 1975;17:259–270. doi: 10.1016/s0033-0620(75)80017-x. [DOI] [PubMed] [Google Scholar]
- 2.Investigators P. Value of the ventilation/perfusion scan in acute pulmonary embolism. Results of the prospective investigation of pulmonary embolism diagnosis (PIOPED) JAMA, J Am Med Assoc. 1990;263:2753–2759. doi: 10.1001/jama.1990.03440200057023. [DOI] [PubMed] [Google Scholar]
- 3.Price DG. Thoughts on immediate care—Pulmonary embolism. Prophylax diagnosis and treatment. Anaesthesia. 1976;31:925–932. doi: 10.1111/j.1365-2044.1976.tb11905.x. [DOI] [PubMed] [Google Scholar]
- 4.Remy-Jardin M, Remy J, Wattinne L, Giraud F. Central pulmonary thromboembolism: Diagnosis with spiral volumetric CT with the single-breath-hold technique-comparison with pulmonary angiography. Radiology. 1992;185:381–387. doi: 10.1148/radiology.185.2.1410342. [DOI] [PubMed] [Google Scholar]
- 5.McCollough CH, Zink FE. Performance evaluation of a multi-slice CT system. Med Phys. 1999;26:2223–2230. doi: 10.1118/1.598777. [DOI] [PubMed] [Google Scholar]
- 6.Rubin GD, Paik DS, Johnston PC, Napel S. Measurements of the aorta and its branches with helical CT. Radiology. 1998;206:823–829. doi: 10.1148/radiology.206.3.9494508. [DOI] [PubMed] [Google Scholar]
- 7.Stein PD, Henry JW, Gottschalk A. Reassessment of pulmonary angiography for the diagnosis of pulmonary embolism: Relation of interpreter agreement to the order of the involved pulmonary arterial branch. Radiology. 1999;210:689–691. doi: 10.1148/radiology.210.3.r99mr41689. [DOI] [PubMed] [Google Scholar]
- 8.Ghaye B. Peripheral pulmonary arteries: How far in the lung does multi-detector row spiral CT allow analysis? Radiology. 2001;219:629–636. doi: 10.1148/radiology.219.3.r01jn32629. [DOI] [PubMed] [Google Scholar]
- 9.Raptopoulos V, Boiselle P. Multi-detector row spiral CT pulmonary angiography: Comparison with single-detector row spiral CT. Radiology. 2001;221:606–613. doi: 10.1148/radiol.2213010473. [DOI] [PubMed] [Google Scholar]
- 10.Schoepf U. Subsegmental pulmonary emboli: improved detection with thin-collimation multi-detector row spiral CT. Radiology. 2002;222:483–490. doi: 10.1148/radiol.2222001802. [DOI] [PubMed] [Google Scholar]
- 11.Diffin DC, Leyendecker JR, Johnson SP, Zucker RJ, Grebe PJ. Effect of anatomic distribution of pulmonary emboli on interob-server agreement in the interpretation of pulmonary angiography. AJR Am J Roentgenol. 1998;171:1085–1089. doi: 10.2214/ajr.171.4.9763002. [DOI] [PubMed] [Google Scholar]
- 12.Krissian G, Malandain N, Ayache R, Vaillant, Trousset Y. Model-based detection of tubular structures in 3D images. Comput Vis Image Underst. 2000;80:130–171. [Google Scholar]
- 13.Kanazawa K, Kawata Y, Niki N, Satoh H, Ohmatsu H, Kakinuma R, Kaneko M, Moriyama N, Eguchi K. Computer-aided diagnosis for pulmonary nodules based on helical CT images. Comput Med Imaging Graph. 1998;22:157–167. doi: 10.1016/s0895-6111(98)00017-2. [DOI] [PubMed] [Google Scholar]
- 14.Frangi AF, Neissen W, Vincken K, Viergever M. Multiscale vessel enhancement filtering. Medical Image Computing Computer-Assisted Intervention. 1998;1496:130–137. [Google Scholar]
- 15.Lorenz C, Carlsen I, Buzug T, Fassnacht C, Weese J. A multi-scale line filter with automatic scale selection based on the Hessian matrix for medical image segmentation. Proceedings of the First International Conference on Scale-Space Theory in Computer Vision; 1997. pp. 152–163. [Google Scholar]
- 16.Aylward SR, Bullitt E. Initialization, noise, singularities, and scale in height ridge traversal for tubular object centerline extraction. IEEE Trans Med Imaging. 2002;21:61–75. doi: 10.1109/42.993126. [DOI] [PubMed] [Google Scholar]
- 17.Li Q, Sone S, Doi K. Selective enhancement filters for nodules, vessels, and airway walls in two- and three-dimensional CT scans. Med Phys. 2003;30:2040–2051. doi: 10.1118/1.1581411. [DOI] [PubMed] [Google Scholar]
- 18.Shikata H, Hoffman EA, Sonka M. Automated segmentation of pulmonary vascular tree from 3D CT images. Proc SPIE. 2004;5369:107–116. doi: 10.1155/2009/636240. [DOI] [PMC free article] [PubMed] [Google Scholar]
- 19.Bülow T, Lorenz C, Renisch S. A general framework for tree segmentation and reconstruction from medical volume data. Medical Image Computing and Computer-Assisted Intervention MICCAI; 2004. [Google Scholar]
- 20.Masutani Y, Macmahon H, Doi K. Automated segmentation and visualization of the pulmonary vascular tree in spiral CT angiography: An anatomy-oriented approach based on tree-dimensional image analysis. J Comput Assist Tomogr. 2001;25:587–597. doi: 10.1097/00004728-200107000-00014. [DOI] [PubMed] [Google Scholar]
- 21.Higgins WE, Spyra WJT, Warwoski RA, Ritman EL. System for analyzing high-resolution three dimensional coronary angiograms. IEEE Trans Med Imaging. 1996;15:377–385. doi: 10.1109/42.500146. [DOI] [PubMed] [Google Scholar]
- 22.Blanks RG, Wallis MG, Given-Wilson RM. Observer variability in cancer detection during routine repeat (incident) mammographic screening in a study of two versus one view mammography. J Med Screen. 1999;6:152–158. doi: 10.1136/jms.6.3.152. [DOI] [PubMed] [Google Scholar]
- 23.Chung A, Noble J. Statistical 3D vessel segmentation using a Rician distribution. International Conference on Medical Image Computing Computer-Assisted Intervention; 1999. pp. 82–89. [Google Scholar]
- 24.Kutka R, Stier S. Extraction of line properties based on direction fields. IEEE Trans Med Imaging. 1996;15:51–58. doi: 10.1109/42.481440. [DOI] [PubMed] [Google Scholar]
- 25.McInerney T, Terzopoulos D. T-snake: Topology adaptive snakes. Med Image Anal. 2000;4:73–91. doi: 10.1016/s1361-8415(00)00008-6. [DOI] [PubMed] [Google Scholar]
- 26.Lorigo LM, Faugeras OD, Grimson WEL, Keriven R, Kikinis R, Nabavi A, Westin AF. CURVES: Curve evolution for vessel segmentation. Med Image Anal. 2001;5:195–206. doi: 10.1016/s1361-8415(01)00040-8. [DOI] [PubMed] [Google Scholar]
- 27.Zhou C, Hadjiiski LM, Sahiner B, Chan HP, Patel S, Cascade PN, Kazerooni EA, Wei J. Computerized detection of pulmonary embolism in 3D computed tomographic (CT) images: Vessel tracking and segmentation techniques. Proc SPIE. 2003;5032:1613–1620. [Google Scholar]
- 28.Zhou C, Chan HP, Patel S, Cascade PN, Sahiner B, Hadjiiski LM, Kazerooni EA. Preliminary investigation of computer-aided detection of pulmonary embolism in 3D computed tomographic pulmonary angiography (CTPA) images. Acad Radiol. 2005;12:782–792. doi: 10.1016/j.acra.2005.01.014. [DOI] [PMC free article] [PubMed] [Google Scholar]
- 29.Sato Y, Westin CF, Bhalerao A, Nakajima S, Shiraga N, Tamura S, Kikinis R. Tissue classification based on 3D local intensity structures for volume rendering. IEEE Trans Vis Comput Graph. 2000;6:160–180. [Google Scholar]
- 30.Dempster NM, Laird AP, Rubin DB. Maximum likelihood from incomplete data via the EM algorithm. J R Stat Soc Ser B (Methodol) 1977;39:185–197. [Google Scholar]
- 31.Wu Y, Tian Q, Huang TS. Discriminant-EM algorithm with application to image retrieval. Proceedings of the IEEE Conference on Computer Vision and Pattern Recognition; 2000. pp. 222–227. [Google Scholar]
- 32.Sternberg SR. Biological image processing. Computer. 1983;16:22–34. [Google Scholar]
- 33.Sato Y, Nakajima S, Shiraga N, Atsumi H, Yoshida S, Koller T, Gerig G, Kikinis R. Three-dimensional multi-scale line filter for segmentation and visualization of curvilinear structures in medical images. Med Image Anal. 1998;2:143–169. doi: 10.1016/s1361-8415(98)80009-1. [DOI] [PubMed] [Google Scholar]
- 34.Wink O, Niessen WJ, Viergever MA. Multiscale vessel tracking. IEEE Trans Med Imaging. 2004;23:130–133. doi: 10.1109/tmi.2003.819920. [DOI] [PubMed] [Google Scholar]
- 35.Lindeberg T. Feature detection with automatic scale selection. Int J Comput Vis. 1998;30:77–116. [Google Scholar]
- 36.Zhou C, Sahiner B, Chan H-P, Hadjiiski LM, Cascade P, Bogot N, Kazeroonu E, Wei J, Ge J. Computerized lung nodule detection on screening CT scans: Improvement of false positive reduction utilizing vessel segmentation method. Presentation at the 92nd Scientific Assembly and Annual Meeting of the Radiological Society of North America; Chicago, IL. November 26–December 1, 2006; p. 465. RSNA Program 2006. [Google Scholar]


