Abstract
In vitro experiments indicate a non-metabolic role of muscle glycogen in contracting skeletal muscles. Since the sequence of events in excitation–contraction (E–C) coupling is known to be located close to glycogen granules, at specific sites on the fibre, we hypothesized that the distinct compartments of glycogen have specific effects on muscle fibre contractility and fatigability. Single skeletal muscle fibres (n= 19) from fed and fasted rats were mechanically skinned and divided into two segments. In one segment glycogen localization and volume fraction were estimated by transmission electron microscopy. The other segment was mechanically skinned and, in the presence of high and constant myoplasmic ATP and PCr, electrically stimulated (10 Hz, 0.8 s every 3 s) eliciting repeated tetanic contractions until the force response was decreased by 50% (mean ±s.e.m., 81 ± 16, range 22–252 contractions). Initially the total myofibrillar glycogen volume percentage was 0.46 ± 0.07%, with 72 ± 3% in the intermyofibrillar space and 28 ± 3% in the intramyofibrillar space. The intramyofibrillar glycogen content was positively correlated with the fatigue resistance capacity (r2= 0.32, P= 0.02). Intermyofibrillar glycogen was inversely correlated with the half-relaxation time in the unfatigued tetanus (r2= 0.25, P= 0.03). These results demonstrate for the first time that two distinct subcellular populations of glycogen have different roles in contracting single muscle fibres under conditions of high myoplasmic ATP.
The consistent observations that muscle glycogen stores at the beginning of exercise are closely related to endurance capacity (Bergström et al. 1967) and that the time point of exhaustion after prolonged exercise coincides with low muscle glycogen levels (Hermansen et al. 1967), clearly suggest a role for muscle glycogen in fatigue. However, the link between glycogen and impaired muscle function during fatigue is not well understood and a direct cause-and-effect relationship between glycogen and muscle function remains to be established. In in vitro intermittent stimulation protocols of whole muscles and single fibres fatigue is related to excitation–contraction (E–C) coupling failure (Westerblad & Allen, 1991) and accumulating evidence indicates that glycogen depletion impairs E–C coupling leading to fatigue (Chin & Allen, 1997; Kabbara et al. 2000; Helander et al. 2002). This is evident from experiments where isolated small bundles of mouse fast-twitch muscle fibres were fatigued by repeated tetani, which markedly reduced glycogen content and tetanic intracellular free [Ca2+] ([Ca2+]i). Following 1 h recovery maximum force (Fmax) and [Ca2+]i were normalized. However, when fibres recovered in the absence of glucose the low glycogen levels were maintained and there was a sustained reduction in [Ca2+]i, depressed reduction in Fmax and muscles fatigued faster in a second fatigue run (Chin & Allen, 1997). These observations were later confirmed in cane toad fibres and mouse extensor digitorum longus (EDL) fibres (Kabbara et al. 2000; Helander et al. 2002), and together these data suggest that the change in E–C coupling associated with fatigue and recovery has a component which is glycogen dependent.
Since muscle glycogen, through glycogenolysis, provides glucose-6-phosphate for glycolysis and replacement of intermediates in the tricarboxylic acid cycle, the link between glycogen and muscle performance has traditionally been considered as being closely related to impaired energy metabolism at low glycogen levels. However, experiments on both in vitro stimulation and whole body exercise in man demonstrate a strong association between low glycogen levels and muscle performance even after long recovery periods, where adenine nucleotide levels may be normalized (Bangsbo et al. 1992; Chin & Allen, 1997; Kabbara et al. 2000; Helander et al. 2002). Further, in mechanically skinned fibres from cane toad, where the myoplasmic metabolic levels (PCr and ATP) are kept high and constant, the number of t-system depolarizations required to reduce Fmax by 50% is proportional to the initial glycogen content (Stephenson et al. 1999). Together, these studies demonstrate a role for glycogen in E–C coupling events, which is not related to myoplasmic energy status and that skeletal muscle fibre glycogen is a prerequisite for normal E–C coupling. However, the explanatory mechanism currently remains unknown.
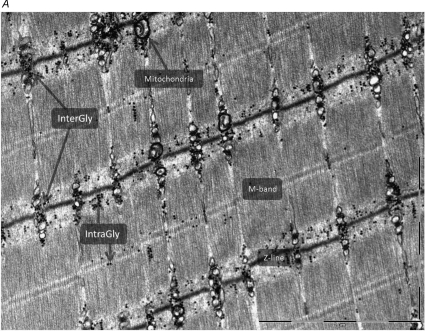
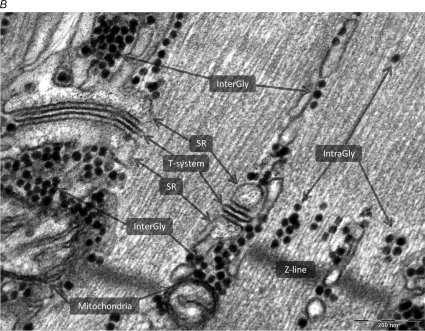
Using mechanically skinned muscle fibres from rat EDL muscle, these data have later been both confirmed (Barnes et al. 2001) and disproven (Goodman et al. 2005). One reason for this discrepancy could be that data relating to muscle glycogen are interpreted as being homogeneously distributed when quantified biochemically, whereas in fact glycogen may exist as granules in specific subcellular locations. This would be consistent with the hypothesis of a role of glycogen in E–C coupling. Transmission electron microscopy (TEM) reveals that glycogen is located in distinct compartments close to different sites of E–C coupling (Wanson & Drochmans, 1968; Sjöström et al. 1982; Fridén et al. 1985, 1989; Marchand et al. 2002, 2007). Hence, three distinct pools of glycogen have been identified: (1) subsarcolemmal glycogen beneath the sarcolemma; (2) intermyofibrillar glycogen located between the myofibrils close to sarcoplasmic reticulum (SR) and mitochondria, and (3) intramyofibrillar glycogen, in the interfilament space (Fig. 2A and B). Further, it is recognized that repeated contractions mediate an uneven breakdown of glycogen subpopulations (Sjöström et al. 1982; Fridén et al. 1985, 1989; Marchand et al. 2007). This raises the likely possibility that the glycogen pools act as independent metabolic units with specialized functions, resulting in regulatory or metabolic compartments with distinct characteristics and functions. Thus, in order to elucidate the link between glycogen and E–C coupling it is essential to estimate glycogen content in the various pools of the myofibre. However, little is known about the role of the distinct glycogen pools on action potential (AP)-activated contracture characteristics (i.e. Fmax, and rate of force development and relaxation) and fatigue resistance.
Figure 2. TEM image illustrating the distinct myofibrillar glycogen populations.
Glycogen granules are visualized as black dots. A, two localizations of glycogen in the skinned fibre segments were defined: (1) InterGly: intermyofibrillar glycogen, and (2) IntraGly: intramyofibrillar glycogen (scale bar = 2 μm, original ×20 000 magnification). The number of glycogen particles per area were manually counted using iTEM 5.0 (Soft Imaging System GmbH). The estimates of mean particle diameter were measured on images of ×160 000 magnification (not shown). B, TEM image of higher magnification illustrating the two populations of glycogen in relation to structures of the muscle fibre (scale bar = 200 nm, original magnification ×80 000). To the left of the image the myofibril has been cut precisely on the surface, enabling visualization of the ultrastructural arrangement of the triads situated in the I-band on each side of the Z-line, wrapped around the contractile apparatus. Intermyofibrillar glycogen surrounds the SR indicative of glycolytic compartmentalization with the SR. The myofibrils to the right of the section are cut straight through, permitting visualization of the contractile apparatus and intramyofibrillar glycogen mainly localized in the I-band.
In the present study, we proposed to fill this cognitive gap by examining the relationship between glycogen localization (estimated by TEM) and AP-induced contractility and fatigue resistance capacity in single fibres, under conditions of high and constant myoplasmic ATP and PCr. We hypothesize that the distinct compartments of glycogen affect muscle fibre function and that this effect is not related to myoplasmic energy status.
Methods
Preparation of the mechanically skinned fibres
Six male Sprague–Dawley rats weighing 602 ± 12 g were purchased from the Institute of Biomedicine, Odense University Hospital. The rats were housed in cages with a 12 h:12 h light:dark cycle and provided unrestricted access to water and food. Two of the six rats were fasted for 24 h before the experimental day in an attempt to reduce muscle glycogen stores. On the experimental day the rats were anaesthetized with isoflurane and killed by cervical dislocation in accordance with the guidelines of the animal ethics committee at Odense University Hospital. Both EDL muscles were dissected, blotted dry on filter paper, placed in paraffin oil and cooled. Single fibres (n= 19) were isolated under a dissecting microscope and mechanically skinned by rolling back the sarcolemma using a pair of jeweller's forceps. All the mechanically skinned fibres were divided into two paired segments. One skinned fibre segment was tied at both ends with a black twisted silk suture (Deknatel 10.0, Genzyme, MA, USA) and mounted on an isometric force transducer (AME801, sensoNor, Horten, Norway) in order to estimate contractile properties. The other segment from the same fibre was prepared for glycogen visualization by TEM. Skinning of single fibres involves a brief rapid glycogen loss (Goodman et al. 2005) implying that the best prediction of glycogen localization in the fibre segment used for contractility and fatigue resistance capacity measurements is carried out on paired segments which are also skinned.
Measurement of contractile properties
After the skinned fibre segments were mounted on the force transducer they were stretched to 120% of their resting length under paraffin oil. The fibres were transferred to a polarizing solution (see below) and washed for 3 min and then transferred to a custom-made stimulation chamber. T-system APs were generated by transverse electrical stimulation conducted via two platinum wire electrodes 4 mm apart parallel to the skinned fibre segment as previously described (Posterino et al. 2000; Ørtenblad & Stephenson, 2003). Force was measured using force displacement transducers and recorded with a chart recorder and digitally on a computer. The force transducer was pre-calibrated between 0 and 0.78 mN (r2= 0.99) and the force responses were sampled at 1 kHz using a custom-made LabVIEW program (LabView 8.0, National Instruments, Austin, TX, USA). All single-fibre experiments were performed at room temperature (∼22°C).
Electric field stimulation was used to test unfatigued tetanic contractile characteristics and fatigue resistance capacity. The fatigue resistance capacity (fibre endurance) was defined as the number of tetanic contractions until exhaustion, which was defined as a tetanic force response below 50% of the initial Fmax. The contractile characteristics were evaluated in the unfatigued fibre by: Fmax, the half-contraction time (time (ms) from stimulus to 50% of Fmax), the half-relaxation time (the time after the last stimulus in the tetanic contraction to 50% of this from Fmax), the maximal rate of force development relative to Fmax, and the maximal rate of relaxation relative to Fmax.
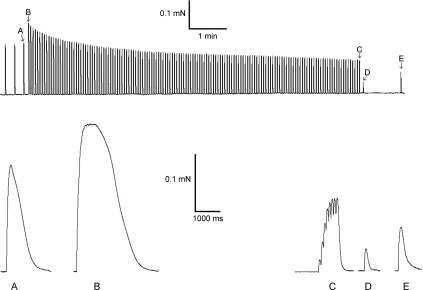
After three subsequent stable twitch force responses the fibre segments were exposed to a fatiguing protocol consisting of repeated tetanic contractions elicited by pulses of 2 ms duration at 75 V cm−1 delivered at a frequency of 10 Hz for a duration of 800 ms separated by 3 s of rest. The protocol is depicted in Fig. 3. When 50% of initial force was reached, the stimulation protocol was stopped and a twitch was elicited immediately (< 5 s) and 1 min after recovery. Finally, the fibre segments were activated maximally by the Ca2+ solution (pCa = 4.5). Six fibres were exposed to the same stimulation protocol, but instead of eliciting two twitches after fatigue, the fibres were rapidly exposed to the low Mg2+ solution to measure the content of rapidly releasable SR Ca2+. In order to determine the degree of glycogen washed out during the stimulation protocol, the glycogen volume was estimated in two fibres immediately after exhaustion and compared with the glycogen volume estimates in two fibres that had rested for an equal amount of time in the polarizing solution.
Figure 3. Force records from one fibre segment.
Upper panel shows the entire protocol and the lower panel shows in larger scale the unfatigued twitch (A) and tetanus (B), the tetanus (C) and twitch (D) at exhaustion, and also the twitch after 1 min of recovery (E).
Solutions
Each skinned fibre used to measure contraction force was exposed to a number of solutions mimicking the intracellular environment. All solutions included a basic composition of (mm): ATP (8), PCr (10), Na+ (36), K+ (126), free Mg2+ (1) and Hepes (90), unless otherwise specified. The polarizing solution, largely mimicking the myoplasm (Lamb & Stephenson, 1994; Posterino et al. 2000), contained 50 μm EGTA (when used in electrical field stimulation, 100 μm) and 1,6-diaminohexane-N,N,N′,N′-tetraacetic acid (HDTA2−) (50). In the Ca2+ solution, the Ca2+ buffer HDTA2− was replaced with EGTA (50) and also contained Ca2+ (48.5). The relaxing solution had EGTA (50). The SR Ca2+ release solution was similar to the polarizing solution, but contained only 15 μm free Mg2+ and 30 mm caffeine, i.e. low Mg2+ removes the inhibitory effect of myoplasmic Mg2+ on the SR Ca2+ release channels which together with the addition of caffeine mediates SR Ca2+ release (Lamb & Stephenson, 1994). In all solutions osmolality was measured to 297 ± 7 mosmol kg−1 on a Gonotec Osmomat 030, cryoscopic osmometer. All solutions were buffered at pH 7.10 ± 0.01 at room temperature (∼22°C). The polarizing solution and the solution for electrical stimulation were weakly Ca2+-buffered at a pCa (i.e. −log10[Ca2+]) of 7.0 (50 μm total EGTA) and 7.2 (100 μm total EGTA), respectively. Ca2+ concentrations were measured with a Ca2+-sensitive electrode (Orion Research Inc., Boston, MA, USA). The chemicals were obtained from Sigma (St Louis, USA), except HDTA2− which was obtained from Fluka (Buchs, Switzerland).
Transmission electron microscopy (TEM)
Fibre segment preparation for TEM
Fibre segments, from the same fibres as used for contractile properties, were fixed with 2.5% glutaraldehyde in 0.1 m sodium cacodylate buffer (pH 7.3) for 24 h and afterwards rinsed four times in 0.1 m sodium cacodylate buffer. Then the fibre segments, tied with black twisted silk suture, were stained for 5 s with eosin under the stereomicroscope to enhance the visualization of the fibre segments. The main parts of the sutures were cut off, and the fibre segments, including a small piece of suture, were packed in lens-cleaning tissue (Assistent). The packed fibre segments were post-fixed and stained with 1% osmium tetroxide (OsO4) and 1.5% potassium ferrocyanide (K4Fe(CN)6) in 0.1 m sodium cacodylate buffer for 90 min at 4°C. The use of reduced osmium tetroxide containing potassium ferrocyanide favours a high electron density of glycogen particles (De Bruijn, 1973). After post-fixation the packed fibre segments were rinsed twice in 0.1 m sodium cacodylate buffer at 4°C, dehydrated through a graded series of alcohol at 4–20°C, infiltrated with graded mixtures of propylene oxide and Epon at 20°C, and embedded in 100% Epon at 30°C. Polymerization of the Epon was performed at 60°C. Ultra-thin sections (∼60 nm) were cut using a Leica Ultracut UCT ultramicrotome, and contrasted with uranyl acetate and lead citrate. The sections were examined and photographed in a pre-calibrated Philips EM 208 electron microscope and a Megaview III FW camera.
Number and location of images
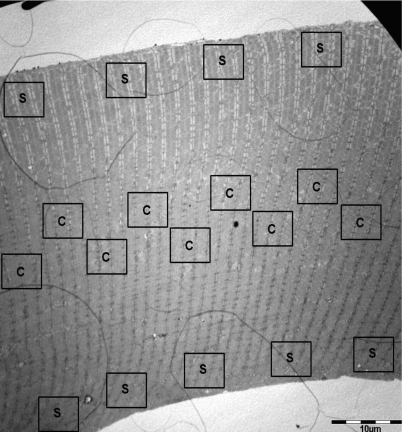
Images were obtained at ×20 000 and ×160 000 magnification in a randomized systematic order to ensure unbiased results (Fig. 1). Nine images were obtained from both the central and superficial regions (Fig. 1). Previous results indicate that glycogen stability is only present in the central region of the fibre (authors’ unpublished observations), thus the glycogen analysis was conducted using images obtained from the central region only. Analysis of six of the nine images indicated that the coefficient of variance (CV) between fibres was 0.66 and 0.84 in the estimates of inter- and intramyofibrillar glycogen volume, respectively. The coefficient of error (CE) for a ratio estimator (computed as proposed by Howard & Reed (2005)) was 0.11 ± 0.01 (range: 0.04–0.27) and 0.15 ± 0.02 (range: 0.07–0.38) in the estimate of inter- and intramyofibrillar glycogen volume, respectively. This 5–6 times lower value of CE compared with CV shows that the precision was highly adequate to detect differences between the fibres. Consequently, only six of the nine images were analysed.
Figure 1. TEM image of a skinned fibre segment.
TEM image of a skinned fibre segment (scale bar = 10 μm, original ×1600 magnification) showing the location of images representing the superficial region (S) and central region (C) of the myofibrillar space. Images were obtained at ×20 000 and ×160 000 magnification in a randomized systematic order to ensure unbiased results. Nine images were obtained from both the central and superficial regions.
Glycogen volume
Two localizations of glycogen in the skinned fibre segments were defined (Fig. 2A and B): (1) the intermyofibrillar space and (2) the intramyofibrillar space. In intact fibres glycogen is also localized in a subsarcolemmal region; however, in our setting with skinning of both segments to ensure comparable glycogen content, the subsarcolemmal region was removed. The glycogen volume fraction (VV) of each subpopulation was estimated as proposed by Weibel (1980, eqn (4.20)), where the effect of section thickness was taken into account: VV=AA−t((1/π)BA−NA(tH/(t+H))), where AA is the glycogen area fraction, t is the section thickness (60 nm), BA is the glycogen boundary length density, NA is the number of particles per area, and H is the average glycogen profile diameter. It was assumed that the particles were spheres (Meléndez-Hevia et al. 1993). The parameters can be computed from the estimate of the number of particles per area counted on images of ×20 000 magnification and the estimate of mean particle diameter directly measured on images of ×160 000 magnification using iTEM 5.0 (Soft Imaging System GmbH). The glycogen content based on paired segments is valid as shown by two studies where no significant difference was found between two segments (Stephenson et al. 1999; Goodman et al. 2005).
Estimation of reference volume
The glycogen volume located in the intermyofibrillar space was expressed relative to the intermyofibrillar volume, and the glycogen volume located in the intramyofibrillar space was expressed relative to the intramyofibrillar volume. Therefore, it is important to estimate the size of these reference spaces in every fibre avoiding differences in glycogen volume densities due to differences in the reference spaces. The intermyofibrillar volume fraction was estimated by point counting (e.g. Gundersen et al. 1988). The estimated CE was 0.10 ± 0.01, which was half the observed CV value between fibres of 0.21 indicating that the estimates of the intermyofibrillar volume fractions were adequately precise to detect differences between fibres. The average intermyofibrillar volume fraction was 0.17 ± 0.01; however, there was a broad range among fibres from 0.11 to 0.25. When estimating the intermyofibrillar glycogen volume fraction the intermyofibrillar volume fraction was fixed as 0.13 in all fibres. This was done because the broad range in the intermyofibrillar volume fraction of 0.11–0.25 was considered to be due to differences in myofibrillar mitochondria, SR, t-system and lipid volume fractions. Thus, expression of the intermyofibrillar glycogen relative to a fixed intermyofibrillar volume fraction controls for differences in other morphological parameters. The intramyofibrillar volume was estimated as the total myofibrillar volume minus the intermyofibrillar volume. Since the lattice spacing in skinned fibres is constant for different sarcomere lengths (Matsubara et al. 1984), indicating non-isovolumic behaviour, the estimate of intramyofibrillar space was normalized to a sarcomere length of 2 μm. In practice, this means that fibres with half-sarcomere lengths exhibit a higher density of glycogen, which is controlled for by normalizing the sarcomere lengths.
Reproducibility
The reproducibility of manually counting particles and directly measuring the particle diameter was investigated on images analysed twice by the same investigator interspaced by 2 months. The degree of reproducibility is expressed as a coefficient of variation (Bland & Altman, 1986): CV =√(∑(d2)/n)/mean, where d is the difference between the two measurements and n is the number of images analysed twice. The reproducibility test of manually counting particles and measuring particle diameter showed that the differences between two measurements were dispersed around zero unrelated to the average measurement size. The coefficient of variation between repeated measurements of the number of particles in 20 images was 7.7% in the intermyofibrillar space and 9.5% in the intramyofibrillar space. The particle diameter measurements had a coefficient of variation of 9.4%.
Statistics
All values are given as mean ±s.e.m., unless otherwise indicated. The degree of association between variables was assessed using linear regression analysis by STATA 9.2. Student's unpaired and paired t tests were used where appropriate. Significance level was set at P < 0.05.
Results
The contractile properties at rest and following a fatiguing protocol
The typical force responses of the fibre segment electrical stimulation protocol are shown in Fig. 3. The series of tetanic force responses (Fig. 3, upper panel, from B to C) were in most fibres identified by an initial phase of a rapid force decrement, where the tetanic force response was reduced to 90% and 77% of initial force after three and ten tetanic contractions, respectively, followed by a slower and almost linear decrease in force. The fibre segments (n= 17) showed a broad range of fatigue resistance capacity from 22 to 252 tetanic contractions with an average of 81 ± 16 tetanic contractions until exhaustion. After the initial rapid phase the maximal tetanic force was typically slowly decreased in a linear pattern. In the most fatigue-resistant fibre segments the maximal tetanic force decreased by 0.2% per tetanic contraction, and in the less fatigue-resistant fibre segments this decrement was increased to 2.1%. At exhaustion the fibre segments were exposed to a single twitch showing that the twitch force was reduced to 27 ± 3% of initial values and twitch force was partly recovered to 63 ± 7% after 1 min of recovery. This indicates the absence of any major structural impairment of the muscle fibre segments and that fatigue was rapidly reversible.
In a separate series fibre segments (n= 6) were exposed to a SR Ca2+ release solution (low Mg2++ caffeine solution) immediately after exhaustion, whereby the Ca2+ content of the SR was released inducing a force response of 83 ± 2% of maximal Ca2+-activated force and 99 ± 14% of the initial tetanic force response, demonstrating that fatigue was not due to lowered rapidly releasable SR Ca2+ content.
The first unfatigued tetanic contraction is shown on a larger scale in Fig. 3 (B) and the exhausted tetanic contraction in C. The unfatigued tetanic contraction is almost fused, whereas the exhausted tetanic contraction is unfused. The average diameter of the skinned fibres, measured by electron microscopy, was 48 ± 3 μm corresponding to a cross-sectional area of 1909 ± 250 μm2 assuming cylindrically shaped fibres. Since the average maximal tetanic force was 0.61 ± 0.06 mN the average maximal force per cross-sectional area was 320 mN mm−2.
Glycogen content and localization
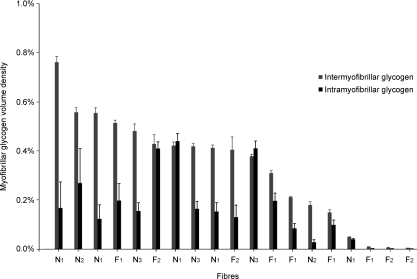
The average total myofibrillar glycogen volume percentage was 0.46 ± 0.07% (n= 19), which is an average of fibres from both 24 h fasted rats (0.33 ± 0.1%; n= 9) and normally fed rats (0.58 ± 0.1%; n= 10). The glycogen volume was distributed with 72 ± 3% in the intermyofibrillar space and 28 ± 3% in the intramyofibrillar space. This relative distribution was similar in fasted and normally fed rats. The intermyofibrillar glycogen occupied 0.33 ± 0.05% of the myofibrillar space and 2.5 ± 0.4% of the intermyofibrillar space. The intramyofibrillar glycogen occupied 0.13 ± 0.03% of the myofibrillar space and 0.16 ± 0.03% of the intramyofibrillar space. Thus, the density of the intermyofibrillar glycogen was 22 ± 3 times higher than intramyofibrillar glycogen. In Fig. 4, the inter- and intramyofibrillar glycogen volume percentages of all the single fibres are shown. There was no association between the two populations of glycogen in the 16 non-depleted fibres, indicating two independent subpopulations of glycogen.
Figure 4. Subpopulations of glycogen in the investigated 19 fibre segments.
The glycogen content is expressed as a volume percentage of the myofibrillar space. Identical letters and numbers indicate that the fibres originate from the same rat. N: from normal fed rat; F: from 24 h fasted rat. Bars represent stereologically estimated s.e.m. values (see Methods). The average total myofibrillar glycogen volume percentage was 0.46 ± 0.07%, with an average distribution of 72 ± 3% in the intermyofibrillar space and 28 ± 3% in the intramyofibrillar space. There was no association between the two populations of glycogen in the 16 non-depleted fibres, indicating that the two subpopulations of glycogen are independent.
Investigation of glycogen content and localization in skinned fibre segments immediately after exhaustion showed that the intramyofibrillar and intermyofibrillar glycogen was reduced to 7% and 23% of control values (n= 2). The immersion of skinned fibre segments in the standard solution for an equal time period showed no signs of glycogen reduction (n= 2). Thus, in spite of high and constant ATP and PCr the fatiguing protocol mediated a breakdown of glycogen.
Relation of fatigue resistance and contractile properties to glycogen localization
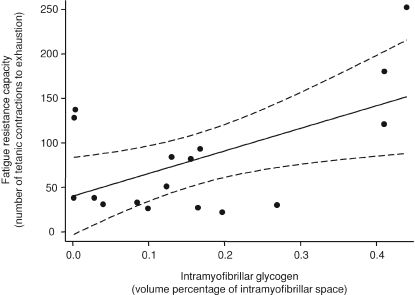
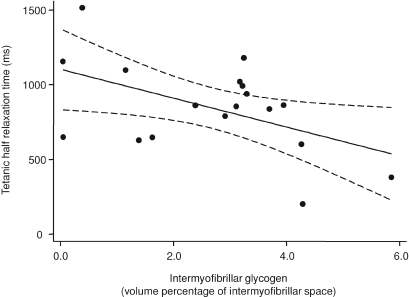
The fatigue resistance capacity was significantly related to the intramyofibrillar glycogen volume (r2= 0.32, P= 0.02, Fig. 5) and not related to the intermyofibrillar glycogen volume (P= 0.69). In the unfatigued tetanus the intermyofibrillar glycogen, constituting 72% of the total glycogen content, was related to the half-relaxation time (r2= 0.25, P= 0.03, Fig. 6). There was no relation between intramyofibrillar glycogen and half-relaxation time (P= 0.86). We observed two distinct phases of the relaxation: a slow linear and an exponential phase (B in Fig. 3). Post hoc analysis indicated that the intermyofibrillar glycogen volume was related to the slow linear phase (r2= 0.32, P= 0.02) and not the exponential phase (r2= 0.11, P= 0.19). None of the parameters measured were related to the half-contraction time, the maximal rate of force development relative to Fmax, or the maximal rate of relaxation relative to Fmax.
Figure 5. Linear regression of number of tetanic contractions to fatigue with intramyofibrillar glycogen volume percentage.
The relation is best fitted by the equation: y= 254x+ 39, r2= 0.32; P= 0.02. Dashed lines indicate 95% confidence intervals.
Figure 6. Linear regression of tetanic half-relaxation time with intermyofibrillar glycogen volume percentage.
The relation is best fitted by the equation: y=−96x+ 1103, r2= 0.25; P= 0.03. Dashed lines indicate 95% confidence intervals.
Discussion
The main findings in the present study were that under conditions where the myoplasmic concentration of ATP and PCr were maintained high and constant: (1) the glycogen located in the intramyofibrillar space between the contractile filaments constituting only a quarter of the total glycogen content was correlated with the fatigue resistance capacity, and (2) glycogen located in the intermyofibrillar space in close contact with the SR and mitochondria, constituting three-quarters of the total glycogen content, was correlated with the half-relaxation time in an unfatigued tetanic contraction. These results suggest that different subcellular populations of glycogen in the muscle have different roles in muscle contractility and reflect the greater relative importance of glycogen localization, as opposed to total content. The significance of glycogen localization is further supported by the high fibre-to-fibre variation in glycogen distribution between the two populations.
Fatigue resistance capacity
The subpopulation of glycogen located in the intramyofibrillar space was related to fatigue resistance capacity as measured by repeated tetanic contractions elicited by AP depolarizations. These results contribute to the hypothesis describing an essential role of glycogen in skeletal muscle E–C coupling (Chin & Allen, 1997; Stephenson et al. 1999; Kabbara et al. 2000; Barnes et al. 2001; Helander et al. 2002). Here we extend these studies by showing that only the glycogen particles located in the intramyofibrillar space are related to the fatigue resistance capacity. Importantly, with the skinned fibre, the myoplasmic concentrations of ATP and PCr were maintained at high and constant levels, indicating that the observed role of glycogen was most likely independent of myoplasmic energy status. This can be interpreted as glycogen having either a non-metabolic role or that compartmentalized energy transfer through the glycolysis is important for maintaining normal E–C coupling. However, a high and constant myoplasmic energy status does not imply that energy status is constant in the very restricted space in the triadic gap (Fig. 2B) with a high local energy turnover during repetitive contractions. Indeed, the very rapid recovery of the twitch force following the repeated tetanic contractions (63% within 1 min) implies that glycogen has a metabolically dependent role in the E–C coupling and that a non-metabolic role of glycogen is unlikely.
Several types of evidence indicate that the glycogen-linked depression in Fmax is at least partly due to an inability to keep the t-tubule membrane adequately polarized and that intramyofibrillar glycogen attenuates the t-tubule membrane depolarization. Thus, in fibres with low glycogen content we frequently observed spontaneous tetanic-like responses (often larger than the control twitch responses), or slower and smaller transient force responses, which decreased in size over several seconds and then normally disappeared. The responses are similar to responses when the control myoplasmic solution is replaced by lower [K+]-containing solutions causing partial depolarization of the t-system. Second, following the fatigue protocol, there was a relatively rapid recovery of twitch force (i.e. from 27 ± 3% to 63 ± 7% of initial force after 1 min of recovery), as would be expected if the fatigue was caused by t-tubule membrane depolarization. Third, the observations of a pronounced role of glycogen in excitability when the SR Ca2+ release is mediated by APs (present data) and no effect by direct stimulation of the voltage sensors by Na+ depolarizations (Goodman et al. 2005), would be expected if fatigue is at least partly due to t-system depolarization. This can be explained by the difference in mode of voltage sensor activation, as Na+ depolarizations only examine the activation and inactivation behaviour of the voltage sensor while the APs include the asymmetric charge movement, which are found to be inactivated at a less depolarized membrane potential compared to experiments using direct stimulation of the voltage sensors by Na+ depolarizations (Lamb, 2002; Ørtenblad & Stephenson, 2003). These transient alterations in membrane excitability could be due to accumulation of K+ in the t-system (for a review see Clausen, 2003). In skinned fibres the build-up of K+ in the t-system is potentially more pronounced than in intact fibres, because the t-system has no access to any extracellular space as in intact fibres (Posterino, 2001; Nielsen et al. 2004). Thus, the force response decrements in the present study are likely to be caused by t-system K+ accumulation reducing the concentration gradient of K+ resulting in reduced excitability. A protective mechanism against accumulation of K+ in the t-system and reduced excitability involves the Na+–K+ pumps, which during work are up to 20 times more active than at rest (Nielsen & Clausen, 1997). Several studies indicate that the Na+–K+ pumps preferentially use glycolytic ATP as noted by Clausen (2003), and that the degradation of glycogen induced by adrenaline (epinephrine) is reduced when the pump activity is inhibited by ouabain (James et al. 1999). Recently, it has been shown using skinned rat fibres with high and constant exogenous ATP and PCr, that the AP repriming period was shortened when phosphoenolpyruvate was added, demonstrating that glycolytic ATP preferentially supports the Na+–K+ pumps and moreover protects muscle excitability (Dutka & Lamb, 2007). Therefore, in the present study, it is likely that the ability to maintain excitability was enhanced by functional coupling of intramyofibrillar glycogen breakdown yielding glycolytic ATP to the t-system Na+–K+ pumps. It could be that access to the triadic gap is favoured from the intramyofibrillar space compared to the intermyofibrillar space, where access might be hindered by the SR (Fig. 2B).
Relaxation of the unfatigued tetanus
Another important observation was that, in the fresh muscle fibre, tetanic relaxation was related to intermyofibrillar glycogen. The prerequisite for relaxation is a lowering of the myoplasmic Ca2+ concentration primarily mediated by the SR Ca2+ pumps, which transfer two molecules of Ca2+ from the myoplasm into the SR for the use of one molecule of ATP. The relaxation period after a tetanic contraction in intact fibres is divided into three phases: (i) a short period of unchanged force, (ii) a slow linear decline of force, and (iii) an exponential decline of force (Allen et al. 1995). In our skinned fibres only the last two phases were observed. A post hoc discrimination between the two phases indicated that the role of intermyofibrillar glycogen was only related to the slow linear phase of relaxation. This phase of relaxation has been shown to be slowed and prolonged by inhibition of the SR Ca2+ pumps by 2,5-di(tert-butyl)-1,4-benzohydroquinone (Westerblad & Allen, 1994). Thus, the observed relation between intermyofibrillar glycogen and relaxation can be regarded as being related to SR Ca2+ pump function. Further, since we are using the mechanically skinned preparation, this relation is independent of myoplasmic energy status, i.e. a non-metabolic role exerted on the SR membrane and/or a compartmentalized energy transfer from the breakdown of intermyofibrillar glycogen to the SR Ca2+ pumps.
Since, glycogen and glycolytic enzymes are known to be associated with the SR membrane (Wanson & Drochmans, 1972; Entman et al. 1980; Xu & Becker, 1998), a decrease in intermyofibrillar glycogen could mediate a change in the SR membrane exerting a non-metabolic role on SR Ca2+ uptake. In line with this, Lees & Williams (2004) showed that an α-amylase-induced glycogen reduction to 6% of control was accompanied by a reduction in Ca2+ uptake, only when exogenously added ADP was combined with pyruvate kinase and not when ATP was added exogenously. This suggests that the SR Ca2+ pumps preferentially use glycolytically produced ATP. However, recently these results could not be reproduced (Mishima et al. 2006). In isolated SR vesicles the complexity of the SR Ca2+ pumps are likely to be altered, hampering investigations of energetic compartmentalization. However, in the skinned fibre preparation, the function of the SR Ca2+ pumps reflects the in vivo situation regarding both structural assembling and energetic pathways. Presently no studies have been performed on skinned skeletal muscle fibres; however, in skinned cardiac muscle fibres the addition of ATP and glycolytic intermediates enhance SR Ca2+ uptake compared with ATP alone (Boehm et al. 2000), suggesting that the SR Ca2+ pumps can be supported by glycolytic ATP. In the present study the relationship between intermyofibrillar glycogen and the relaxation rate could be explained by compartmentalized energy transfer which preferentially directs glycolytic ATP to the SR Ca2+ pumps, independent of exogenous ATP. This idea is further supported by the close localization of intermyofibrillar glycogen and SR Ca2+ pumps (Fig. 2B).
Conclusion
Since the pioneering work of Wanson & Drochmans published in 1968 it has been known that skeletal muscle glycogen is localized in distinct compartments. Now, almost 40 years later, using electrical stimulation of mechanically skinned muscle fibres, we demonstrate for the first time that two distinct subcellular populations of glycogen have different roles in muscle contractility.
Acknowledgments
This study was supported by grants from The Lundbeck Foundation, Team Denmark elite association and the Ministry of Culture Committee on Sports Research.
References
- Allen DG, Lännergren J, Westerblad H. Muscle cell function during prolonged activity: cellular mechanisms of fatigue. Exp Physiol. 1995;80:497–527. doi: 10.1113/expphysiol.1995.sp003864. [DOI] [PubMed] [Google Scholar]
- Bangsbo J, Graham TE, Kiens B, Saltin B. Elevated muscle glycogen and anaerobic energy production during exhaustive exercise in man. J Physiol. 1992;451:205–227. doi: 10.1113/jphysiol.1992.sp019161. [DOI] [PMC free article] [PubMed] [Google Scholar]
- Barnes M, Gibson LM, Stephenson DG. Increased muscle glycogen content is associated with increased capacity to respond to T-system depolarization in mechanically skinned skeletal muscle fibres from the rat. Pflugers Arch. 2001;442:101–106. doi: 10.1007/s004240000510. [DOI] [PubMed] [Google Scholar]
- Bergström J, Hermansen L, Hultman E, Saltin B. Diet, muscle glycogen and physical performance. Acta Physiol Scand. 1967;71:140–150. doi: 10.1111/j.1748-1716.1967.tb03720.x. [DOI] [PubMed] [Google Scholar]
- Bland JM, Altman DG. Statistical methods for assessing agreement between two methods of clinical measurement. Lancet. 1986;8:307–310. [PubMed] [Google Scholar]
- Boehm E, Ventura-Clapier R, Mateo P, Lechène P, Veksler V. Glycolysis supports calcium uptake by the sarcoplasmic reticulum in skinned ventricular fibres of mice deficient in mitochondrial and cytosolic creatine kinase. J Mol Cell Cardiol. 2000;32:891–902. doi: 10.1006/jmcc.2000.1130. [DOI] [PubMed] [Google Scholar]
- Chin ER, Allen DG. Effects of reduced muscle glycogen concentration on force, Ca2+ release and contractile protein function in intact mouse skeletal muscle. J Physiol. 1997;498:17–29. doi: 10.1113/jphysiol.1997.sp021838. [DOI] [PMC free article] [PubMed] [Google Scholar]
- Clausen T. Na+-K+ pump regulation and skeletal muscle contractility. Physiol Rev. 2003;83:1269–1324. doi: 10.1152/physrev.00011.2003. [DOI] [PubMed] [Google Scholar]
- De Bruijn WC. Glycogen, its chemistry and morphologic appearance in the electron microscope. J Ultrastructure Res. 1973;42:29–50. doi: 10.1016/s0022-5320(73)80004-8. [DOI] [PubMed] [Google Scholar]
- Dutka TL, Lamb GD. Na+-K+ pumps in the transverse tubular system of skeletal muscle fibres preferentially use ATP from glycolysis. Am J Physiol Cell Physiol. 2007;293:C967–C977. doi: 10.1152/ajpcell.00132.2007. [DOI] [PubMed] [Google Scholar]
- Entman ML, Keslensky SS, Chu A, Van Winkle B. The sarcoplasmic reticulum–glycogenolytic complex in mammalian fast twitch skeletal muscle. J Biol Chem. 1980;255:6245–6252. [PubMed] [Google Scholar]
- Fridén J, Seger J, Ekblom B. Implementation of periodic acid-thiosemicarbazide-silver proteinate staining for ultrastructural assessment of muscle glycogen utilization during exercise. Cell Tissue Res. 1985;242:229–232. doi: 10.1007/BF00225582. [DOI] [PubMed] [Google Scholar]
- Fridén J, Seger J, Ekblom B. Topographical localization of muscle glycogen: An ultrahistochemical study in human vastus lateralis. Acta Physiol Scand. 1989;135:381–391. doi: 10.1111/j.1748-1716.1989.tb08591.x. [DOI] [PubMed] [Google Scholar]
- Goodman C, Blazev R, Stephenson DG. Glycogen content and contractile responsiveness to t-system depolarization in skinned muscle fibres of the rat. Clin Exp Pharm Physiol. 2005;32:749–756. doi: 10.1111/j.1440-1681.2005.04260.x. [DOI] [PubMed] [Google Scholar]
- Gundersen HJ, Bendtsen TF, Korbo L, Marcussen N, Møller A, Nielsen K, Nyengaard JR, Pakkenberg B, Sørensen FB, Vesterby A, West MJ. Some new, simple and efficient stereological methods and their use in pathological research and diagnosis. APMIS. 1988;96:379–394. doi: 10.1111/j.1699-0463.1988.tb05320.x. [DOI] [PubMed] [Google Scholar]
- Helander I, Westerblad H, Katz A. Effects of glucose on contractile function, [Ca2+]i, and glycogen in isolated mouse skeletal muscle. Am J Physiol Cell Physiol. 2002;282:C1306–C1312. doi: 10.1152/ajpcell.00490.2001. [DOI] [PubMed] [Google Scholar]
- Hermansen L, Hultman E, Saltin B. Muscle glycogen during prolonged severe exercise. Acta Physiol Scand. 1967;71:129–139. doi: 10.1111/j.1748-1716.1967.tb03719.x. [DOI] [PubMed] [Google Scholar]
- Howard CV, Reed MG. Unbiased Stereology. Three-dimensional Measurement in Microscopy. Oxford, UK: Bios Scientific Publishers; 2005. [Google Scholar]
- James JH, Wagner KR, King J-K, Leffler RE, Upputuri RK, Balasubramanian A, Friend LA, Shelly DA, Paul RJ, Fischer JE. Stimulation of both aerobic glycolysis and Na+-K+-ATPase activity in skeletal muscle by epinephrine or amylin. Am J Physiol Endocrinol Metab. 1999;277:E176–E186. doi: 10.1152/ajpendo.1999.277.1.E176. [DOI] [PubMed] [Google Scholar]
- Kabbara AA, Nguyen LT, Stephenson GM, Allen DG. Intracellular calcium during fatigue of cane toad skeletal muscle in the absence of glucose. J Muscle Res Cell Motil. 2000;21:481–489. doi: 10.1023/a:1005650425513. [DOI] [PubMed] [Google Scholar]
- Lamb GD. Excitation-contraction coupling and fatigue mechanisms in skeletal muscle: studies with mechanically skinned fibres. J Muscle Res Cell Motil. 2002;23:81–91. doi: 10.1023/a:1019932730457. [DOI] [PubMed] [Google Scholar]
- Lamb GD, Stephenson DG. Effects of intracellular pH and [Mg2+] on excitation–contraction coupling in skeletal muscle fibres of the rat. J Physiol. 1994;478:331–339. doi: 10.1113/jphysiol.1994.sp020253. [DOI] [PMC free article] [PubMed] [Google Scholar]
- Lees SJ, Williams JH. Skeletal muscle sarcoplasmic reticulum glycogen status influences Ca2+ uptake supported by endogenously synthesized ATP. Am J Physiol Cell Physiol. 2004;286:C97–C104. doi: 10.1152/ajpcell.00188.2003. [DOI] [PubMed] [Google Scholar]
- Marchand I, Chorneyko K, Tarnopolsky M, Hamilton S, Shearer J, Potvin J, Graham TE. Quantification of subcellular glycogen in resting human muscle: granule size, number, and location. J Appl Physiol. 2002;93:1598–607. doi: 10.1152/japplphysiol.00585.2001. [DOI] [PubMed] [Google Scholar]
- Marchand I, Tarnopolsky M, Adamo KB, Bourgeois JM, Chorneyko K, Graham TE. Quantitative assessment of human muscle glycogen granules size and number in subcellular locations during recovery from prolonged exercise. J Physiol. 2007;580:617–628. doi: 10.1113/jphysiol.2006.122457. [DOI] [PMC free article] [PubMed] [Google Scholar]
- Matsubara I, Goldman YE, Simmons RM. Changes in the lateral filament spacing of skinned muscle fibres when cross-bridges attach. J Mol Biol. 1984;173:15–33. doi: 10.1016/0022-2836(84)90401-7. [DOI] [PubMed] [Google Scholar]
- Meléndez-Hevia E, Waddell TG, Shelton ED. Optimization of molecular design in the evolution of metabolism: the glycogen molecule. Biochem J. 1993;295:477–483. doi: 10.1042/bj2950477. [DOI] [PMC free article] [PubMed] [Google Scholar]
- Mishima T, Sugiyama M, Yamada Y, Sakamoto M, Wada M. Effects of reduced glycogen on structure and in vitro function of rat sarcoplasmic reticulum Ca2+-ATPase. Pflugers Arch. 2006;452:117–123. doi: 10.1007/s00424-005-0018-5. [DOI] [PubMed] [Google Scholar]
- Nielsen OB, Clausen T. Regulation of Na+–K+ pump activity in contracting rat muscle. J Physiol. 1997;503:571–581. doi: 10.1111/j.1469-7793.1997.571bg.x. [DOI] [PMC free article] [PubMed] [Google Scholar]
- Nielsen OB, Ørtenblad N, Lamb GD, Stephenson DG. Excitability of the T-tubular system in rat skeletal muscle: roles of K+ and Na+ gradients and Na+–K+ pump activity. J Physiol. 2004;15:133–146. doi: 10.1113/jphysiol.2003.059014. [DOI] [PMC free article] [PubMed] [Google Scholar]
- Ørtenblad N, Stephenson DG. A novel signalling pathway originating in mitochondria modulates rat skeletal muscle membrane excitability. J Physiol. 2003;548:139–145. doi: 10.1113/jphysiol.2002.036657. [DOI] [PMC free article] [PubMed] [Google Scholar]
- Posterino GS. ‘Current’ advances in mechanically skinned skeletal muscle fibres. Clin Exp Pharma Physiol. 2001;28:668–674. doi: 10.1046/j.1440-1681.2001.03502.x. [DOI] [PubMed] [Google Scholar]
- Posterino GS, Lamb GD, Stephenson DG. Twitch and tetanic force responses and longitudinal propagation of action potentials in skinned skeletal muscle fibres of the rat. J Physiol. 2000;527:131–137. doi: 10.1111/j.1469-7793.2000.t01-2-00131.x. [DOI] [PMC free article] [PubMed] [Google Scholar]
- Sjöström M, Fridén J, Ekblom B. Fine structural details of human muscle fibres after fibre type specific glycogen depletion. Histochemistry. 1982;76:425–438. doi: 10.1007/BF00489899. [DOI] [PubMed] [Google Scholar]
- Stephenson DG, Nguyen LT, Stephenson GMM. Glycogen content and excitation–contraction coupling in mechanically skinned muscle fibres of the cane toad. J Physiol. 1999;519:177–187. doi: 10.1111/j.1469-7793.1999.0177o.x. [DOI] [PMC free article] [PubMed] [Google Scholar]
- Wanson JC, Drochmans P. A morphological and biochemical study of glycogen β-particles isolated by the precipitation-centrifugation method. J Cell Biol. 1968;38:130–150. doi: 10.1083/jcb.38.1.130. [DOI] [PMC free article] [PubMed] [Google Scholar]
- Wanson JC, Drochmans P. Role of the sarcoplasmic reticulum in glycogen metabolism. J Cell Biol. 1972;54:206–224. doi: 10.1083/jcb.54.2.206. [DOI] [PMC free article] [PubMed] [Google Scholar]
- Weibel ER. Stereological Methods. Vol. 2: Theoretical Foundations. London: Academic Press; 1980. [Google Scholar]
- Westerblad H, Allen DG. The role of sarcoplasmic reticulum in relaxation of mouse muscle; effects of 2,5- di(tert-butyl)-1,4-benzohydroquinone. J Physiol. 1994;474:291–301. doi: 10.1113/jphysiol.1994.sp020022. [DOI] [PMC free article] [PubMed] [Google Scholar]
- Westerblad H, Allen DG. Changes of myoplasmic calcium concentration during fatigue in single mouse muscle fibres. J Gen Physiol. 1991;98:615–635. doi: 10.1085/jgp.98.3.615. [DOI] [PMC free article] [PubMed] [Google Scholar]
- Xu KY, Becker LC. Ultrastructural localization of glycolytic enzymes on sarcoplasmic reticulum vesicles. J Histochem Cytochem. 1998;46:419–427. doi: 10.1177/002215549804600401. [DOI] [PubMed] [Google Scholar]


