

Abstract
Tonic activation of neurokinin-3 (NK3) receptors in dopamine neurons of the ventral tegmental area (VTA) has been implicated in the pathophysiology of schizophrenia. This psychiatric disorder is associated with a dysfunctional activity in VTA projection neurons that can affect cognitive function at the level of the medial prefrontal cortex (mPFC) as well as motor and motivational states controlled in part by mesolimbic output to the nucleus accumbens (Acb). To determine the relevant sites for NK3 receptor activation within this neuronal network, we used confocal and electron microscopy to examine NK3 receptors (Cy5; immunogold) and retrograde labeling of fluorogold (FG, FITC; immunoperoxidase) in the VTA of rats receiving either Acb or mPFC injections of FG. Comparison was made with neurokinin-1 (NK1) receptors, which are also present, but less abundant then NK3 receptors, in dopaminergic and GABAergic VTA neurons. There were no observable differences between NK3 and NK1 receptors in their primary locations in the cytoplasm and on the plasma membrane of VTA somata and dendrites with or without FG. Dendrites labeled with FG retrogradely transported from mPFC, however, contained more NK3 or less NK1 immunogold particles (plasmalemmal + cytoplasmic) then those retrogradely labeled following FG injection in the Acb. Moreover, only the NK3 receptors were detected in neuronal nuclei in the VTA and in the nuclei of human HEK-293T NK3-transfected cells. The enrichment of NK3 receptors in mesocortical projection neurons and nuclear distribution of these receptors may provide insight for understanding the selective antipsychotic effectiveness of NK3 antagonists.
Keywords: peptide receptors, midbrain, schizophrenia, tract tracing, dopamine, substance P
Endogenous tachykinins released into the ventral tegmental area (VTA) activate both the neurokinin-1 (NK1) and neurokinin-3 (NK3) receptors, the latter of which is thought to be involved in the pathophysiology of schizophrenia (Spooren et al., 2005). This is suggested, in part, by the clinical efficacy of two non-peptidic NK3 receptor antagonists (osanetant and talnetant) on the positive symptoms in schizophrenic patients (Meltzer et al., 2004; Spooren et al., 2005). The underlying mechanism for this antipsychotic effect is largely unknown, but may reflect blockade of NK3 receptor-dependent activation of dopaminergic transmission in either 1) the mesocortical pathway from the ventral tegmental area (VTA) to the medial prefrontal cortex (mPFC), or, 2) the mesolimbic pathway from the VTA to the nucleus accumbens (Acb) (Oades and Halliday, 1987; Gerfen and Wilson, 1996; Tzschentke, 2001). Both the mPFC and Acb receive a major input from dopaminergic, and a more minor input from GABAergic projection neurons in the VTA (Koob and Swerdlow, 1988; Carr and Sesack, 2000a). A specific involvement of the mesocortical dopaminergic pathway is suggested by the major role of the mPFC in normal cognitive functions and in the cognitive abnormalities in schizophrenia (Bannon and Roth, 1983; Koob and Swerdlow, 1988; Abi-Dargham and Moore, 2003). The mesolimbic dopaminergic pathway to the Acb, however, potentially modulates corticostriatal transmission affected by the motivated behaviors that are also impaired in schizophrenia (Wightman and Robinson, 2002; Wise, 2002).
NK3 receptors are present in VTA dopaminergic and non-dopaminergic neurons (Chen et al., 1998; Lessard et al., 2007). Microinjection of the selective NK3 receptor agonist senktide in the VTA also increases dopamine release locally and in both the Acb and mPFC (Overton et al., 1992; Bannon et al., 1995; Marco et al., 1998; Seabrook et al., 1995). The enhanced dopamine release is consistent with the coupling of NK3 receptors to stimulatory Gq proteins, and with the abnormal activity of VTA dopaminergic neurons in schizophrenia (Regoli et al., 1994; Farde, 1997). Presently however, the subcellular location and comparative distribution of the NK1 or NK3 receptors in either the mPFC or Acb projection neurons of the VTA is not known.
We have shown previously that dopaminergic and non-dopaminergic somatodendritic profiles of the rat VTA contained twice as less NK1 immunogold particles, as compared to NK3 immunogold particle density (Lessard and Pickel, 2005; Lessard et al., 2007). Despite this sparse distribution, NK1 receptor activation in the VTA is known to evoke significant cardiovascular and behavioral changes in awake rats (Deschamps and Couture, 2005) that may be mediated, in part, through altered output of neurons that project to the mPFC or Acb.
In the present study, we sought to compare cellular and subcellular distributions of NK3 and NK1 receptors in neurons of the VTA that were identified by retrograde transport of Fluorogold (FG) from either the Acb or mPFC of rat brain. Electron and confocal microscopy showed pathway-specific differences in abundance of these neurokinin receptors in mesolimbic and mesocortical projection neurons. Moreover, only the NK3 receptors were targeted to the nucleus in neurons of the rat VTA or NK3-transfected human HEK-293T cells. The cellular and subcellular location of NK3 and NK1 receptors within the subpopulations of VTA neurons is critical for understanding their normal function and the unique antipsychotic effect of NK3 receptor antagonists.
Material and Methods
Animal source and care
Male Sprague-Dawley rats (280-350 g, n=10; Taconic Farms, Germantown, NY) were housed two per cage in a colony room under a 12h light/dark cycle. Food and water were available ad libitum. Experiments were conducted in accordance with the NIH regulations of animal care and were approved by the Institutional Animal Care and Use Committee of Weill Medical College of Cornell University. Every effort was made to minimize the number of animals used and their suffering.
Surgery and retrograde transport
Animals were anesthetized by intraperitoneal (i.p.) injection of 65 mg/kg sodium pentobarbital. The head of the anesthetized rat was mounted in a stereotaxic frame with the incisor bar set at 3.3 mm below the interaural line. The skull was exposed, cleaned, and a hole was drilled unilaterally above the Acb or mPFC area at coordinates: A.P. 1.7mm (Acb) or 3.3 mm (mPFC) anterior to Bregma and, L. 1.5 mm (Acb) or 1.0 mm (mPFC) lateral to midline (Paxinos and Watson, 1986). The retrograde tracer Fluorogold (FG: Fluorochrome, Englewood, CO) was injected using a glass micropipette filled with 1% FG in 0.1 M sodium acetate buffer. The tip of the FG filled micropipette ranged from 25-30 μm (Van Bockstaele and Pickel, 1995). The pipette tip was lowered into the brain at V. 6.5 mm (Acb) or 2.00-4.0 mm (mPFC) below the pial surface. A metallic wire (tip: 10-15 μm) was inserted into the glass pipette for iontophoretic infusion of FG. Injection of FG in Acb was achieved by applying a 10-50 μA current pulse for 5 seconds on and off, for a total period of 20 minutes. The mesocortical pathway is comprised of substantially fewer projection neurons, as compared to the mesolimbic pathway (Swanson, 1982). Thus, two FG injections were performed in the mPFC of five rats, in order to increase the number of retrogradely labeled neurons in the VTA. Similar on and off currents were applied for two consecutive 10 minutes for microinjection of FG in the mPFC at V. 4.00 mm and 2.00 mm from the brain surface. The micropipette was removed slowly, and the hole in the skull was filled with bone wax (Ethicon, Somerville, NJ). The incisions were closed with sutures and covered with Lidocaine ointment (5%; Fougera, Melville, NY). Recovery from anesthesia was closely monitored while maintaining body temperature. The fully awake rats were housed individually in polyethylene cages in the animal facility.
Tissue preparation
One week after surgery, the rats were deeply anesthetized by i.p. injection of 150 mg/kg sodium pentobarbital, and then perfused through the aortic arch with 5-10 ml of heparin-saline, 50 ml of 3.75% acrolein in 2% paraformaldehyde and 200 ml of 2% paraformaldehyde in 0.1 M phosphate buffer (PB), pH 7.4. The brains were removed and post-fixed in 2% paraformaldehyde for 30 minutes. Rostrocaudal brain sections (40 μm) were prepared using a Vibratome (Leica Microsystems®, Bannockburn, IL) and then placed in 1% sodium borohydride in PB for 30 minutes to neutralize reactive aldehydes as described in prior studies using acrolein fixation (Leranth and Pickel, 1889). To minimize penetration problems inherent to the pre-embedding methodology, sections used for light and electron microscopy were cryoprotected in 25% sucrose and 3.5% glycerol in PB, rapidly frozen in Freon followed by liquid nitrogen, and thawed in room temperature PB. This rapid freeze-thaw method produces minute holes in the tissue allowing greater penetration of immunoreagents. The sections were then rinsed in 0.1 M Tris-buffered saline (TS). Prior to incubation in primary antisera, the free-floating sections were placed in 0.5% bovine serum albumin (BSA) in 0.1 M TBS for 30 min to block non-specific binding of antisera. Sections processed for confocal fluorescence were incubated in a solution of 0.1% BSA in TBS including 0.25% of the detergent Triton X-100, without prior freeze-thaw manipulation.
Antisera
Detection of FG was achieved using a polyclonal antiserum against FG that was commercially obtained from Protos Biotech Corp (New York, NY). This antiserum previously showed selective labeling in retrogradely labeled neurons of the rat VTA (Van Bockstaele et al., 1994a, b; Van Bockstaele and Pickel, 1995; Carr and Sesack, 2000a, b). This marker provides a sensitivity/specificity suitable for electron microscopy using either immunoperoxidase or immunogold labeling, as well as ultraviolet epi-fluorescent illumination (Schmued et al., 1989; Van Bockstaele et al., 1994b; Van Bockstaele and Pickel, 1995; Carr and Sesack, 2000). Fluorescence evoked by FG is highly correlated with the presence of FG-labeled lysosomes within the same cell when examine by electron microscopy (Schmued et al., 1989).
NK1 receptor localization was achieved by using a rabbit polyclonal antiserum (Novus Biologicals®, Littleton, CO) against a peptide sequence at the carboxy C-terminus of rat NK1 receptor (residues 393-407: KTMTESSSFYSNMLA). This antiserum was previously tested for specificity by techniques of transfection and radioimmunoassay (Vigna et al., 1994). In addition, the antiserum is selectively localized to neurons that express NK1 receptor binding in the dorsal horn of the rat spinal cord and in the myenteric plexus of the rat ileum, two regions that are known to show high levels of autoradiographic binding sites for the NK1 receptor (Bartho and Holzer, 1985; Burcher et al., 1986; Mantyh et al., 1989; Helke et al., 1990). The specificity of the NK1 receptor antiserum was validated for detecting the rat NK1 receptor by Western blotting, radioimmunoassay and immunocytochemistry (Liu et al., 1994; Mantyh et al., 1995a; Mantyh et al., 1995b). The antiserum recognizes a protein band of 80-90 kDa on Western blot in rat tissue, and the immunostaining is absent in sections incubated with the immunogenic peptide (Liu et al., 1994). The antiserum was also characterized in human brain tissue by Western blot (Mounir and Parent, 2002), and showed no immunostaining in the dorsal mesencephalon in NK1 knock-out mice (Lacoste et al., 2006).
A polyclonal antiserum raised against a peptide sequence at the C-terminus of rat NK3 receptor (residues 438-452: SSFISSPYTSVDEYS) was commercially obtained from Novus Biologicals® (Littleton, CO). This antiserum shows a light microscopic distribution comparable to NK3 receptor binding in the human prefrontal cortex (Tooney et al., 2000), and rat spinal cord (Seybold et al., 1997) as well as in myenteric and submucosal neurons of the rat gastrointestinal tract (Grady et al., 1996). The NK3 immunoreactivity seen in sections of spinal cord or in NK3 tranfected cells was absent when the antiserum was preadsorbed with the antigenic peptide (Grady et al., 1996; Seybold et al., 1997; Oyamada et al., 1999). The antiserum recognizes a protein band of 70-90 kDa in transfected CHO cells (Grady et al., 1996) or 65-67 kDa in human and rat tissue (Mileusnic et al., 1999), and shows no cross-reactivity with other neurokinin receptors (Grady et al., 1996).
Thus, the detected immunoreactivities are believed to be representative of FG as well as the NK1 and NK3 receptors, although unknown homologous proteins might also be recognized.
NK3 receptor location in HEK-293T transfected cell lines
To test the specificity of the NK3 antisera and confirm nuclear localization of the NK3 receptor, HEK-293T cells were transfected with cDNA encoding NK3 receptor sequence. HEK 293T cells were seeded on day one in 6-wells culture plates (3 × 10⁵ cells / well) and cultured in DMEM medium supplemented with 10% FBS (2ml / well). On day two, cells were transfected or not (NT) with 3 μg by well of the pcDNA3.1-based NK3R expression vector (UMR cDNA Resource center, Rolla, MO) or the control vector pcDNA3.1 (Invitrogen, Carlsbad, CA) using the Exgen 500 tranfection reagent (MBI Fermantas, Burlington, ON) according to the manufacturer protocol. HEK were cultured at 37°C for an additional 48 hours, washed with PBS and scraped in 100μl of RIPA buffer + protease inhibitor cocktail (Roche). Proteins were quantified using the BCA protein assay reagent (Pierces, Pittsburg, PA). For Western blot analysis, 10 μg of proteins resuspended in 1X Laemmli buffer were loaded without boiling on a 12% SDS-PAGE and transblotted onto PVDF membranes. The membranes were blocked 1 hour at room temperature in TBST + 5% dry milk. These were then incubated overnight at 4°C with either a 1) rabbit anti-NK3 receptor polyclonal antiserum (Novus Biological, Littleton, CO) at dilution 1:1000 in TBST + 5% dry milk, or 2) a mouse anti-β-actin monoclonal antibody (Sigma) at a dilution of 1:10,000 in TBST + 5% dry milk. Subsequently the membranes were incubated with HRP-conjugated secondary antibodies (1:15,000 in TBST + 5% dry milk, Amersham), and the proteins were visualized using the Western lightning chemiluminescence plus reagent (Perkin Elmer).
HEK-293T cells transfected or not with the NK3 receptor expression vector or the control plasmid pcDNA3.1 were processed for confocal immunofluorescence forty-eight hours post-transfection. For this, the cells were washed twice with PBS (3ml), fixed with 4% paraformaldehyde/PBS 10 minutes at room temperature and rinsed several times with PBS. Cells were blocked and permeabilized in PBS containing 0.1% (w/v) saponin and 5% fetal bovine serum for 30 minutes at room temperature, then successively incubated 2 hours at room temperature with a rabbit polyclonal anti-NK3 receptor antiserum (Novus; 1:500) diluted in blocking solution, washed 3 times with PBS (3ml), and further incubated for an additional hour at room temperature with a goat anti-rabbit Alexa Fluor568-conjugated IgG (1:500). Nuclear labeling was achieved with Hoechst 33342 (30μg/ml; Molecular Probe) added in conjunction with the secondary antibody. As a negative control, the primary antibody was omitted. Afterwards, coverslipped cells were washed in PBS and flat-mounted on microscope slides using Gel/Mount medium containing anti-fading agents (Biomeda corp). Samples were examined with a Bio-Rad confocal krypton/argon and UV laser system. For all experiments, the settings of the confocal microscope were the same and kept constant. Images were collected by using the same Z values and analyzed using a Silicone Graphic (SGI) software. The image size was 512 × 512 pixels with a pixel size of 0.34 μm (Gobeil et al., 2006b).
Single and dual immunolabeling
Sections for single immunoperoxidase, dual fluorescence and dual electron microscopic labeling were incubated in the primary antisera for 24 hours at room temperature. For electron microscopic dual labeling, sections were incubated in these antisera at 4°C for another 12 hours. The incubation solution contained guinea pig anti-FG antiserum (single and dual labeling; 1:5000) and rabbit anti-NK1 antiserum (single labeling 1:1000; fluorescence labeling 1:1000; dual labeling 1:400) or rabbit anti-NK3 receptor antiserum (single labeling 1:5000; fluorescence labeling 1:5000; dual labeling; 1:400).
Controls for cross-reactivity of FG with NK1 or NK3 antiserum were performed by immunoperoxidase and immunofluorescence microscopy (n= 1 rat). For this, the sections were processed either 1) without primary antiserum (including all secondary antibodies); 2) FG only (including anti-rabbit only or all secondary antibodies; 3) NK1 only (including anti-guinea pig only or all secondary antibodies), or 4) NK3 primary antiserum only (including anti-guinea pig only or all secondary antibodies). Additional sections were processed for immunolabeling of antiserum raised against either NK1 or NK3 alone or combination with 1 μgr/ml of the respective angiogenic peptides.
For confocal immunofluorescence, the free-floating Vibratome sections were rinsed several times in TS after the incubation with primary antisera. These sections were then incubated 1 hour in a solution containing fluorescein-conjugated (FITC) donkey anti-guinea pig (FG) and Cy5-conjugated donkey anti-rabbit (NK1 and NK3; Jackson Immunoresearch laboratories Inc., Baltimore, PA) secondary antiserum at dilution 1:200 in 0.1% BSA in TS that also contained Triton (0.25%). After washes in TS and PB, the sections were mounted in 0.05 M PB onto superfrost VWR microslides (VWR International, West Chester, PA), coverslipped in mounting fluid (Light Diagnostics, Temecula, CA), and sealed with nail polish to prevent dehydration. These sections were then observed on a confocal microscope (Leica TCS SP5; Mannheim, Germany) using sequential laser analysis with emission intensities of 488 nm (Argon, FITC) and 633 nm (Helium, Cy5). Images were produced by LAS AF software (Leica; Mannheim, Germany), imported to Photoshop software (version 4.0, Adobe System, Mountain View, CA) and adjusted for brightness and contrast.
For immunoperoxidase labeling, sections were rinsed in TS after the incubation with the primary antiserum, and then incubated for 30 minutes in biotinylated secondary donkey anti-guinea pig IgG (1:400, Incstar) or goat anti-rabbit (1:400, Incstar) followed by the ABC complex (ABC; Vector, Burlingame, CA) for detection of FG, NK1- or NK3-receptor antisera. The bound peroxidase was identified by reaction of the sections for 6 minutes in 3,3′-diaminobenzidine (Aldrich Chemicals, Milwaukee, WI) and hydrogen peroxide.
Sections incubated with two antisera including FG, which was detected by the peroxidase reaction product, were rinsed in Tris buffer (0.1 M, pH 7.6) and placed for two hours in a 1:50 dilution of donkey anti-rabbit IgG with bound 1 nm colloidal gold (Amersham, Arlington, IL) for immunogold detection of the rabbit NK1 or NK3 receptor antiserum. The gold particles were fixed to the tissue by incubation of the sections in 2% glutaraldehyde in 0.01 M phosphate buffered saline for ten minutes. The particles were enlarged for microscopic examination by reaction in a silver solution from the IntenS-EM kit (Amersham) for seven minutes at room temperature (Chan et al., 1990). The sections were then postfixed in 2% osmium tetroxide in 0.1 M phosphate buffer, dehydrated and flat-embedded in epon (19% EM Bed-812; 36% DDSA; 44% NMA; 1% BDMA; Electron Microscopy Sciences, Fort Washington, PA) between two pieces of Aclar plastic (Allied Signal, Pottsville, PA).
Ultrathin sections from the outer surface of each Vibratome section in the region of the paranigral and parabrachial portions of the VTA, at 5.2 mm posterior to the bregma, (Paxinos and Watson, 1986) were collected onto grids by using an ultramicrotome (Nova, Bromma, Sweden). The sections on grids were counterstained with Reynold’s lead citrate and uranyl acetate. The thin sections were examined by using a Philips CM-10 electron microscope. Images were captured using an AMT digital camera, imported to Photoshop software (version 4.0, Adobe Systems, Mountain View, CA), adjusted for sharpness, and then imported to Power Point software (Microsoft Windows ® 2000) for assembly and labeling composite figures.
For light microscopy, immunoperoxidase-labeled sections were mounted onto gelatin-coated slides, air dried, dehydrated through alcohols and xylenes, and coverslipped with DPX mounting medium (Aldrich; Milwaukee, WI). VTA sections were examined using a Nikon light microscope (Tokyo, Japan).
Electron microscopic analysis
To assess the distribution of NK1 and NK3 receptor immunogold particles, data analysis was performed on ultra-thin sections exclusively obtained from the outer surface (0.1-2 μm) of the flat-embedded tissue, where there was optimal penetration of immunoreagents. The profiles containing FG and/or NK1 and NK3 immunoreactivity were classified as either neuronal (somata, dendrites, axon terminals) or glial based on criteria from Peters et.al. (1991). Peroxidase immunoreactive profiles had an electron density considerably greater than that seen in comparable structures in the surrounding neuropil that were considered unlabeled.
The profiles classified as immunogold-labeled contained two or more gold-silver deposits. The validity of the approach depends on a minimal number of spurious deposits seen on portions of tissue not known to express neurokinin receptors (eg myelin). In our study, myelin rarely showed even one gold particle, representative of non-specific background labeling. In 11,429 μm2 of paranigral and parabrachial VTA examined, there were 1299 myelinated axons, of which only 5 had a single NK1 (n=2) or NK3 (n=3) immunogold particle on the myelin. In comparison, this indicates a 0.4% false-positive labeling with immunogold on identified structures.
At least 50 electron micrographs (magnifications from 13,500X to 34,000X) were obtained from each animal (one or two vibratome sections from each of the nine rats), in one of the two regions (paranigral VTA for Acb-injected rats; parabrachial VTA for mPFC-injected rats at Bregma -5.2 mm). A total area of 6,876 μm2 was examined in the paranigral and 7,489 μm2 in the parabrachial VTA. The profile diameter, area and perimeter were measured by using the Microcomputer Imaging Device software (MCID; Imaging Research, St. Catharines, Ontario, Canada). Parameters used for statistical comparisons were: 1) the number of gold particles on the plasma membrane/perimeter of individual profiles and, 2) the total number (plasmalemmal + non-plasmalemmal) gold particles/ profile area. Results are expressed as means ± s.e. mean of (n) rats. Results were analyzed for statistical significance by unpaired Student t-test (between group comparisons) and one-way ANOVA (within group comparisons) using SPSS for Windows ® Lead Technologies Inc (Chicago, IL).
To determine whether immunogold particles which contacted the plasma membrane were selectively associated with the membrane, the percentage of particles that would contact the membrane if the particles were randomly distributed within the neuronal profile was first calculated, and these values were then statistically compared to actual observed values. The probability that an immunogold particle would randomly contact the plasma membrane of a neuronal profile depends on factors such as the membrane length, profile area, and average immunogold particle size. If particles were distributed randomly within a given profile, then the percentage that would contact the membrane, on average, would equal the percentage of the total profile area occupied by a ‘ring’ of area along the inner surface of the membrane, with a width equal to the radius of the average particle, since the frequency of membrane contact would equal the frequency with which the center of a particle fell within that ring area. Thus, the predicted percentage of random contact (%RC) of NK1 and NK3 receptor immunogold particles for each FG-labeled dendrite can be calculated using the equation: %RC = [(profile perimeter × average immunogold particle radius)/ profile area] × 100. These calculated values were then statistically compared (paired Student t-test, SPSS for Windows ® Lead Technologies Inc) with the actual percentages of contact observed for NK1 and NK3 receptors. Only probability values (P) less than 0.05 were considered to be statistically significant.
All comparisons were performed using FG immunoperoxidase and NK1 or NK3 receptor immunogold labeling. Additional sections were examined using a reversal of secondary immunomarkers (immunogold for FG and immunoperoxidase for the NK1 or NK3 receptors) and confirmed that the distributions of FG and NK receptors are similar with each protocol. Absence of non-specific cross-reactions of secondary immunoreagents with rat brain is shown in the present study by absence of labeling when each primary antiserum was omitted from the labeling protocol.
Results
Iontophoretic injection of FG in Acb and mPFC
Iontophoretic injections of FG in either the Acb or mPFC resulted in successful FG labeling in the paranigral and parabrachial subdivisions of the VTA. Light microscopy showed that the microinjection sites in the Acb were mainly located in the dorsomedial Acb core, but the Acb shell and the ventromedial caudate-putamen nucleus were also within the sphere of the FG injection (Fig 1A). Consistent with this, FG retrogradely labeled neurons were prominently observed throughout the ipsilateral paranigral VTA; and some were located in the lateral portion of the substantia nigra (Fig 1A). A few retrogradely labeled neurons also were seen in the parabrachial VTA. A similar distribution has been previously described, also using iontophoretic application of FG in the Acb (Van Bockstaele et al., 1994b; Van Bockstaele and Pickel, 1995). The area sampled for electron microscopy (shown by the trapezoid, Fig 1A) comprised the paranigral portion of the VTA; which contains the greatest number of mesolimbic projection neurons (Swanson, 1982).
Figure 1.
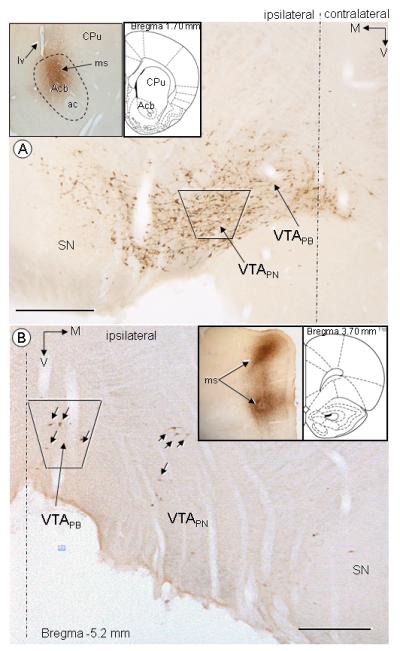
Light microscopic immunoperoxidase distribution of retrogradely transported FG in the rat VTA following FG injection in the ventral striatum (A) or mPFC (B). A) Abundant immunoperoxidase labeling is seen ipsilateral to Acb FG injection in either the paranigral (VTAPN) or parabrachial (VTAPB) portions of the VTA, and to a less extent, the lateral portion of the substantia nigra (SN). A representative FG microinjection site (ms) is shown in inserts, comprising mainly the Acb core and shell as well as the lower portion of the caudate putamen (CPu). B) Sparse immunoperoxidase labeling (black arrows) is seen ipsilateral to mPFC FG injection, mostly in the parabrachial (VTAPB), but also in the paranigral (VTAPN) portions of the VTA. Inserts shows two representative FG microinjection sites (ms) in dorsal and ventral portions of the mPFC (V.: 2.0 mm and 4.0 mm from the brain surface), covering all layers of the mPFC. The area sampled for electron microscopic analysis of the distribution of NK1 and NK3 receptors respectively comprise the VTAPN (A) or VTAPB (B), showed by the trapezoids ( ). Filled corner arrows point medially (M) and ventrally (V). Inserts in the upper left field shows representative FG microinjection at levels 1.7 mm (A) or 3.7 mm (B) from the Bregma (Paxinos, 1986). Ac, anterior commisure; lv, lateral ventricule. Scale bars: 500 μm.
The cortical FG microinjection sites were centered in deep cortical layers (V, VI), but also included all layers of the mPFC. Following the mPFC injection, retrogradely transported FG was mainly observed in the ipsilateral parabrachial VTA (Fig 1B), which is consistent with previous tract tracing studies (Swanson, 1982; Carr and Sesack, 2000a; Svingos et al., 2001). The area sampled for electron microscopy comprised the parabrachial portion of the VTA (shown by the trapezoid, Fig 1B), a region that generally contained more retrogradely labeled neurons than the paranigral VTA of rats receiving FG injection in the mPFC.
Following either Acb or mPFC injection of FG, the immunoperoxidase reaction product identifying retrogradely transported FG was seen in soma as well as large (cross-sectional diameter >2 μm) or small (cross-sectional diameter <1 μm) dendrites. The somatodendritic distribution of FG was confirmed by confocal and electron microscopy. Ultrastructural analysis revealed cytoplasmic and plasmalemmal NK1 and NK3 labeling in FG-containing profiles. Control studies showed absence of cross-reactivity between antisera raised against FG and NK1 or NK3 receptors as seen by either fluorescence or immunoperoxidase labeling (data not shown). Consistently with previous characterization studies (Vigna et al., 1994; Grady et al., 1996; Seybold et al., 1997; Oyamada et al., 1999), omission of the NK1 or the NK3 receptor primary antisera, as well as adsorption of the NK1 and NK3 antiserum with their respective angiogenic peptide result in absence of immunoreactivity (data not shown).
Confocal localization of NK1 and NK3 receptors in VTA projection neurons
Following microinjection of FG in the Acb, retrogradely transported FG fluorescence labeling was seen in somata and in thick, branched processes presumed to be dendrites of the paranigral VTA (Fig 2A,D). In contrast, rats receiving mPFC-injection of FG showed more diffuse, but recognizable retrograde labeling for FG in neuronal somata located in the parabrachial VTA (Fig 2G). Immunofluorescence detection of NK1 receptors was substantially less abundant then FG labeling in either the paranigral or parabrachial VTA (Fig 2 B,E,H), however, the NK1-labeled neurons were clearly recognized in both area. The merged images confirmed the presence of NK1 receptors in VTA neurons retrogradely labeled with FG following either the mPFC or Acb injections (Fig 2 C,F,I). In addition, FG and NK1 labeling were seen in pairs of somata (Fig 2 D,E,F) resembling those of dopaminergic neurons in the VTA (Bayer and Pickel, 1990).
Figure 2.
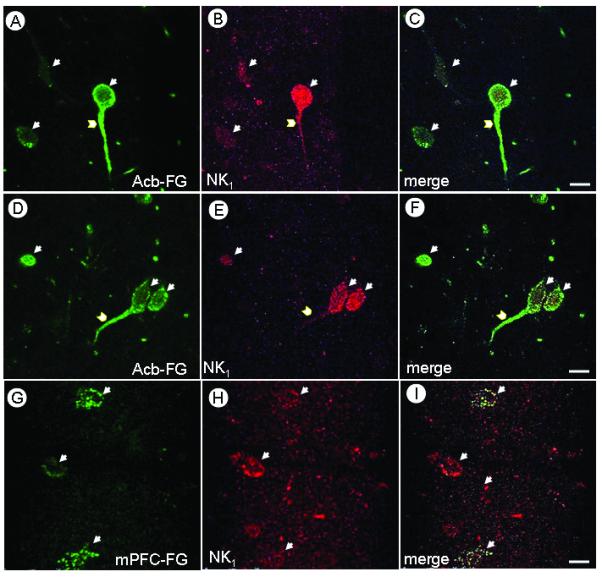
Confocal micrographs illustrating the co-localization of FG and NK1 receptor in the VTA of rats after Acb or mPFC injection of FG. Immunofluorescence labeling of FG (Green; A,D,G) and NK1 (Magenta; B,E,H) is seen either in soma (arrows) or dendrites (chevrons). Merged images (C,F,I) show both FG and NK1 immunofluorescence (white), mainly in somata but also in dendrites of neurons receiving FG in Acb (C,F) or mPFC (I). Scale bars: 10 μm.
Immunofluorescence labeling of retrogradely transported FG was evident in both somata and putative dendrites of the paranigral (Fig 3 A,D) and parabrachial (Fig 3G) portions of the VTA. Immunolabeling for the NK3 receptor was markedly greater then that of the NK1 receptor (Fig 3 B,E,H). Neurons immunoreactive for either FG or NK3 receptor are observed in the paranigral (Fig 3 A-C, yellow arrows) or parabrachial VTA (data not shown), however merged images also revealed colocalization of the NK3 immunolabeling and the retrogradely transported FG (white arrows) from the Acb (Fig 3 C,F) or mPFC (Fig 3, I). While FG, NK1 and NK3 immunolabeling were observed in cytoplasmic compartments of somatodendritic profiles, only NK3 immunoreactivity was seen inside the nucleus in projection or non-projection neurons of both paranigral and parabrachial VTA. The nuclear NK3 labeling was usually seen in aggregates, and seems to be located at a distance from the nuclear membrane (Fig 3).
Figure 3.
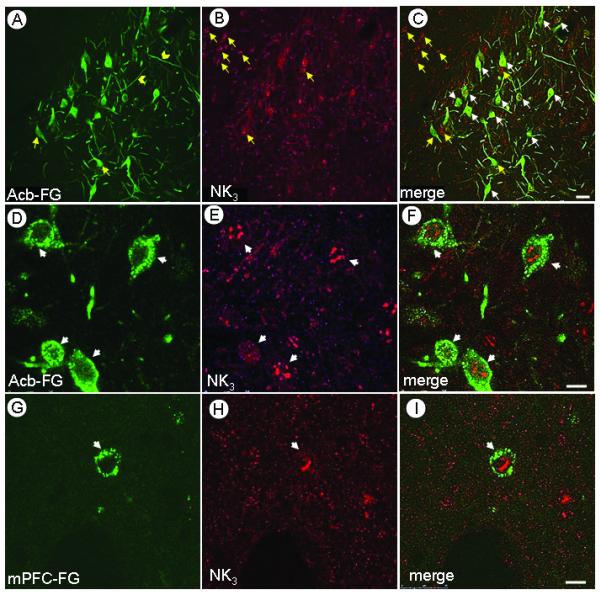
Confocal images showing co-localization of FG and the NK3 receptor in the VTA of rats receiving FG in either the Acb or mPFC. A-C. Low magnification micrograph showing single FG (A) or NK3 (B) immunolabeling (yellow arrows), and overlay of both markers (C, white arrows). DI Immunofluorescence labeling of FG (Green; D,G) and NK3 (Magenta; E,H) is seen either in soma (arrows) or dendrites (chevrons). When merged (F,I), the nuclear labeling of NK3 is apparent in either the VTA neurons providing inputs to the Acb (F) or mPFC (I). NK3 receptor immunofluorescence aggregated in the region of the nucleus. Scale bars: A-C, 30 μm; D-I,10 μm.
Nuclear localization of NK3 receptors in human HEK-293T NK3 transfected cells and VTA neurons
To test the specificity of the NK3 antisera and confirm nuclear localization of the NK3 receptor, HEK-293T cells were transfected with cDNA encoding NK3 receptor sequence. The immunoblot of the NK3 antiserum revealed a specific band, correlating to a molecular mass around 70 kDa (Fig 4). This band was absent in non-transfected cells or cells transfected with the empty vector DNA (Fig 4). This result is consistent with previous characterization studies showing a similar-ranged single band by Western blot in transfected CHO cells (Grady et al., 1996) or in rat and human tissue (Mileusnic et al., 1999). The positive control, β—actin, confirms the uniformity of protein load in all columns (Fig 4). Moreover, transfected HEK-293T cells were used in live cell confocal microscopy, where the nuclear labeling was achieved with Hoechst 33342 (Fig 5A,D), and detection of NK3 antiserum revealed by using an antiserum in combination with an Alexa Fluor568-conjugated IgG (Fig 5B,E). The percentage of tranfected cells was ∼50%; 10 to 20% of these positive cells exhibited NK3 receptor nuclear immunostaining. Merged images showed a superimposition of the labeling for the NK3 receptor and the nucleus marker (Fig 5C,F). Immunoreactivity was absent when the primary antiserum was omitted, or when cells were transfected with the empty vector DNA (data not shown).
Figure 4.
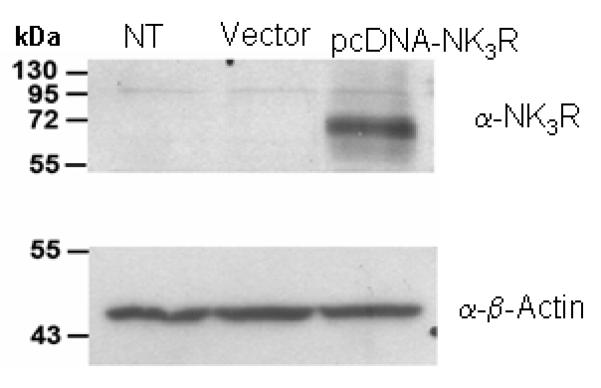
Immunoblot of the NK3 receptor antiserum in HEK-293T NK3 transfected cells. Cultured HEK-293T cells were transfected or not (NT) with either the empty vector pcDNA3.1 (Vector) or the pcDNA3.1-based NK3R expression vector (pcDNA-NK3R). Only the pcDNA-NK3R cells (third column) display a single immunoblot band around 70 kDa. The positive control α-β-Actin shows a single band in NT, Vector and pcDNA-NK3R cells.
Figure 5.
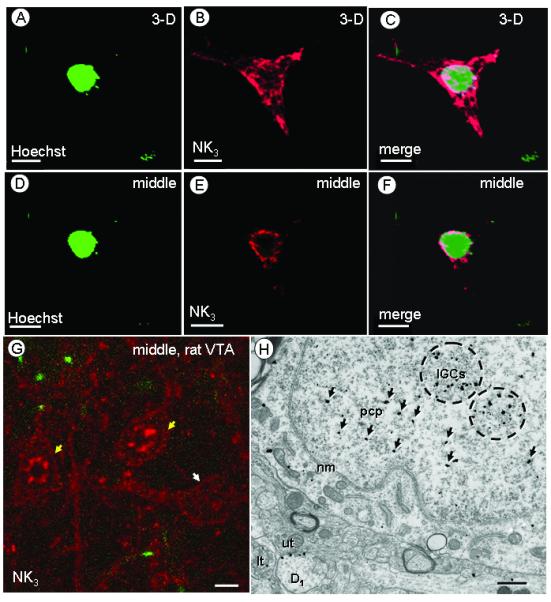
Nuclear location of NK3 receptors in human HEK-293T NK3 transfected cells or rat VTA neurons. Confocal 3-D reconstruction (A-C) or single, middle section (D-F) of images of a nuclear marker (Hoechst 33342) (A, D) or NK3-transfected HEK-293T cells (B, E). The merged images (C,F) show overlay of both markers. G. Confocal image of a single, middle section of rat VTA showing two cell bodies (yellow arrows) in which NK3 labeling is most evident along the perimeter and in both the cytoplasm and the nucleus. Another NK3-labeled cell body (white arrow) without nuclear NK3 labeling is located in the vicinity. H. Electron micrograph of tissue processed for dual labeling showing NK3 receptor immunogold labeling in a cell body without FG labeling. In the cell nucleus, the NK3 labeling is aggregated over dense chromatin masses and distant from the nuclear membrane (nm). NK3 immunogold particles are concentrated around interchromatin granule clusters (IGCs, encircled), but some (arrows) are located near suspended perichromatin particles (pcp). An NK3-labeled dendrites (D1) receiving input from an unlabeled terminal (ut) and a NK3-labeled terminal (lt) are also visible. Scale bars: 1 (A-F), 10 (G) or 0.5 (H) μm.
In the rat VTA, aggregates of nuclear NK3 immunofluorescence was also seen by confocal microscopy (Fig 5G, yellow arrows). While all NK3-labeled cells showed NK3-labeling in the cytoplasm and in contact with the plasma membrane, some of them had no clear affiliation with the nucleus (Fig 5G, white arrow). By electron microscopy, the nuclear NK3 immunogold labeling in the rat VTA (Fig 5H) was seen in a rosette-like arrangement, which is characteristic of chromatin masses or interchromatin granule clusters as previously described (Pederson, 2002; Peters et al., 1991). Immunogold particles were located inside or near these chromatin masses (IGCs; encircled), at a distance from the nuclear membrane (nm) or the nucleolus (ncl). The nuclear NK3 immunogold was present only in somata that also showed cytoplasmic or plasmalemmal labeling for the receptor. These somata were located within a neuropil in which NK3 immunogold particles were also prevalent in dendrites (Fig 5 H). By light and electron microscopy, an identical nuclear arrangement was seen using immunoperoxidase labeling of the NK3 antiserum (data not shown).
Electron microscopic distribution of retrogradely transported FG and NK1 and NK3 receptors in somatodendritic profiles of the VTA
As compared to VTA neurons containing FG injected in the mPFC, VTA somata and dendrites labeled with retrogradely transported FG injected in the Acb showed apparently a higher density of immunoperoxidase reaction products in the cytosol (Figs 6,7 A,B). In both VTA projection neurons, however, immunoperoxidase labeling was concentrated in endosome-like structures or lysosomes in somatodendritic profiles of the VTA (Figs 6, 7 C,D, block arrows). A similar distribution has been reported in the VTA following injection of FG in Acb or mPFC (Schmued and Fallon, 1986; Schmued et al., 1989; Carr and Sesack, 2000a).
Figure 6.
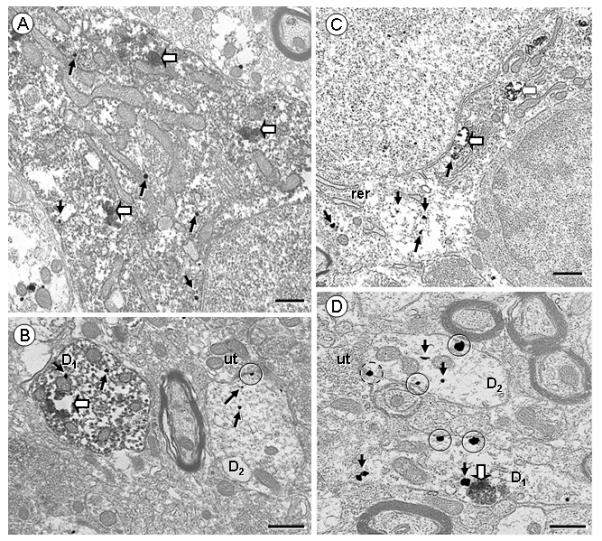
Electron micrographs displaying NK1 receptor (immunogold) and retrogradely transported FG (immunoperoxidase) in VTA somata (A,C) and dendrites (B,D) of rats receiving FG injection in the Acb (A,B) or mPFC (C,D). A,B. NK1 Immunogold particles are seen throughout the cytosol (arrows) in a soma (A) and a dendrite (D1; B) showing intense diffuse or aggregated (block arrows) FG peroxidase reaction product. In B, an NK1—labeled dendrite without retrogradely transported FG (D2) exhibits immunogold particles located within the cytoplasm (arrows), or on the plasma membrane (encircled), near an unlabeled terminal (ut). C,D. Retrograde transport of FG from the mPFC (C,D) leads to selective endosome-like aggregates (block arrows). C. The cell body doubly labeled with NK1 and retrogradely transported FG injected in mPFC contains immunogold particles in the cytosol, near organelles as rough endoplasmic reticulum (rer). D. NK1-labeled dendrites are seen with (D1) or without (D2) immunoperoxidase labeling of retrogradely transported FG, some of which receiving inputs from unlabeled terminals (ut). The D1 dendrite shows one immunogold particle in contact with the cortical FG aggregate. Plasmalemmal NK1 (encircled) are located mostly on extrasynaptic portions of the plasma membrane, or near a synapse which appears to be symmetric (dashed circle). Scale bar: 0.5 μm.
Figure 7.
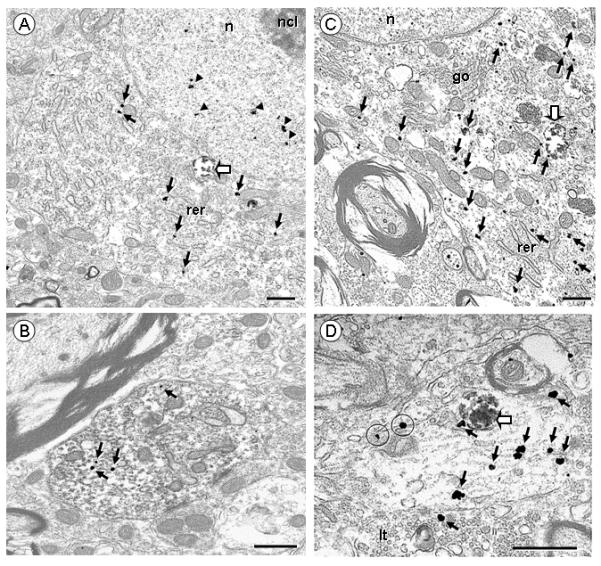
Electron micrographs showing NK3 receptor (immunogold) in VTA somata (A,C) and dendrites (B,D) of rats receiving FG injections in the Acb (A,B) or mPFC (C,D). A. A soma display NK3 immunogold particles in the cytosol (arrows), at distance from the plasma membrane, and in the nucleus (arrow heads), near but not in contact with the nucleolus (ncl). One aggregate of retrogradely transported FG from Acb is located in the cytosol (block arrow). B. A NK3-labeled dendrite contains a few immunogold particles (arrows) on the cytosol and dense immunoperoxidase labeling of retrogradely transported FG from the Acb. C. This soma shows one aggregate of retrogradely transported FG from mPFC (block arrow) and many NK3 immunogold particles in the cytosol, located near organelles as rough endoplasmic reticulum (rer) or Golgi apparatus (go). D. This dendrite contains many NK3 immunogold particles in the cytosol (arrows), one of which is in contact with an aggregate of retrogradely transported FG from mPFC (block arrow). Two NK3 immunogold particles are in contact with extrasynaptic portions of the plasma membrane (encircled). The dendrite receives an input from a NK3-labeled terminal (lt). Scale bar: 0.5 μm.
In somata containing retrogradely transported FG, NK1 immunogold particles were prominently located at a distance from the plasma membrane, often associated with endomembrane resembling endoplasmic reticulum (Fig 6, A,C). A more pronounced plasmalemmal labeling was observed in dendrites containing or not FG immunolabeling (Fig 6, B,and D). Most of these dendrites had a cross-sectional diameter between 1-2 μm (57% of total, n=78). Plasmalemmal NK1 immunogold particles were occasionally (15% of total, n= 51) located near a synapse (Fig 6,B); however the vast majority of them (at least 60% of all plasmalemmal NK1 immunogold particles, n=36; Fig 6,D) were located on non-synaptic portions of the plasma membrane. No qualitative differences in the total density or plasma membrane distribution of NK1 immunogold labeling was seen in neurons that were retrogradely labeled following either Acb or mPFC injection of FG.
NK3 immunogold particles in somata and large dendrites also were usually located intracellularly within the cytosol or the nucleus, in retrogradely transported neurons following injection of FG in either Acb or mPFC (Fig 7 A,C). In VTA dendrites containing retrogradely transported FG (Fig 7 B,D), NK3 receptor labeling was located predominantly (50% of all dual-labeled dendrites, n=69) in small size profiles (cross-sectional diameter < 1 μm). NK3 immunogold particles were often located in the cytosol, and occasionally on the plasma membrane (15% of dendrites containing FG from mPFC, n=25; 17% of them from Acb, n= 44). In these dendrites, the surface NK3 immunogold particles were usually seen at extrasynaptic portions of the plasma membrane (over 65% of all plasmalemmal NK3 receptor, n=48 dendrites from mPFC and Acb). As compared to neurons containing retrogradely transported FG following injection in the Acb, those that were retrogradely labeled following mPFC injections showed qualitatively more total NK3 immunogold particles. The NK3 plasmalemmal density, however, did not show visual differences between the two populations of VTA neurons.
The qualitative dichotomy in NK3 receptor localization in VTA neurons retrogradely labeled following microinjection of FG in Acb or mPFC were confirmed by a quantitative analysis of the immunogold particle distribution in somata and transversely cut dendrites (Fig 8). Significantly more total (plasmalemmal + intracellular) NK3 immunogold particles were seen in VTA somata containing FG following mPFC FG injections, as compared to Acb injections (Fig 8 A). In dendrites, there were significantly fewer (NK1) or more (NK3) immunogold particles in dendrites containing retrogradely transported FG from the mPFC, as compared to Acb-injected rats (Fig 8 B). There was also a significant increase (unpaired Student t-test, P< 0.05) in the average number of NK3 immunogold particle/dendrite in dendrites labeled with FG injected in mPFC (11 ± 1.9, n=25), as compared with dendrites containing FG that was injected in Acb (6 ± 0.5, n=44). No significant differences were seen, however, in plasmalemmal density of NK1 and NK3 receptors. Although immunocytochemical processing of sections in the nine rats have not been carried out simultaneously, the ultrastructural distribution of each receptor was consistently similar in each group of animal. This is further confirmed by a one-way ANOVA statistical analysis showing no significant differences in labeling within animals of the same group, including the mean number of NK1 (Acb somata, P= 0.731 and dendrites, P= 0.366; mPFC somata, P= 0.613 and dendrites, P= 0.225) or NK3 (Acb somata, P= 0.721 and dendrites, P= 0.251; mPFC somata, P= 0.147 and dendrites, P= 0.269) immunogold particles in profiles labeled with FG (Table 1).
Figure 8.
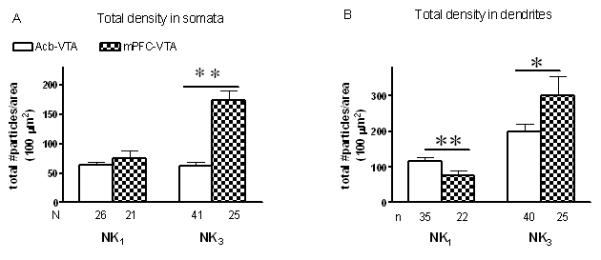
Quantitative assessment of the subcellular distribution of total (plasmalemmal and cytoplasmic) NK1 or NK3 receptors in VTA somata (A) and transversely cut dendrites (B) containing retrogradely transported FG which was injected in the Acb (empty bars) or mPFC (dark bars). Data were obtained from 24 vibratome sections (6 sections for each of the four groups) of nine rats, each of the sections covering an area ranging from 600 to 1000 μm2. A. Ratio of the total number of gold particles/area of somata profiles containing retrogradely transported FG injected in the Acb (NK1: N= 4 rats, n=6-8 profiles/rat; NK3: N= 3 rats, n= 7-19 profiles/rat) or the mPFC (NK1: N= 3 rats, n=6-8 profiles/rat; NK3: N= 3 rats, n= 8-9 profiles/rat). NK3 gold particles located in the nucleus were excluded from the analysis. B. Ratio of the total number of gold particles/area of dendritic profiles containing retrogradely transported FG injected in the Acb (NK1: N= 4 rats, n= 8-11 dendrites/rat; NK3: N= 4 rats, n= 8-15 dendrites/rat) or the mPFC (NK1: N= 3 rats, n= 7-8 dendrites/rat; NK3: N= 3 rats, n= 7-10 dendrites/rat). Vertical bars represent the mean ± S.E. mean of (n) profiles in each group. The statistical comparisons were made between Acb- or mPFC-injected FG and calculated using an Unpaired Student t-test. **P<0.01, *P<0.05.
Table 1.
Average number of NK1 or NK3 immunogold particles in somata or dendrites of rats receiving retrogradely labeled FG injected in the Acb or mPFC.
| Rat | NK1 | NK3 | |||
|---|---|---|---|---|---|
| soma | dendrite | soma | dendrite | ||
| Acb-VTA | 1 | 11.1 ± 2.1, n= 8 |
4.5 ± 0.9, n= 21 |
13.6 ± 2, n= 19 |
6.7 ± 0.8, n= 19 |
|
|
|||||
| 2 | 14.2 ± 4, n= 6 |
6.7 ± 1.4, n= 13 |
10.6 ± 2.9, n= 8 |
4.7 ± 0.9, n= 9 |
|
|
|
|||||
| 3 | 10.8 ± 1.2, n= 6 |
5.7 ± 0.9, n= 9 |
14.7 ± 2.1, n= 7 |
7.1 ± 1.8, n= 8 |
|
|
|
|||||
| 4 | 14.3 ± 3.5, n= 6 |
4.1 ± 1.2, n= 8 |
15.3 ± 4, n= 7 |
4.6 ± 0.8, n= 8 |
|
|
| |||||
| mPFC-VTA | 5 | 15.6 ± 2.4, n= 8 |
3.7 ± 0.4, n= 10 |
36.6 ± 5.8, n= 8 |
6.4 ± 1.2, n= 8 |
|
|
|||||
| 6 or 7 | 17 ± 8.7, n= 6 |
3.6 ± 1, n= 9 |
19.2 ± 7.3, n= 9 |
12.4 ± 4.7, n= 7 |
|
|
|
|||||
| 8 or 9 | 10.4 ± 1.7, n= 7 |
5.8 ± 1.3, n= 8 |
28.8 ± 4.6, n= 8 |
11.7 ± 2.8, n= 10 |
|
Average number includes transversely cut and longitudinal dendrites. One-way ANOVA showed no significant differences within animals of the same group.
The theoretical plasmalemmal random distribution of NK1 and NK3 immunogold particles (%) was calculated in each FG-labeled dendrite. The results showed a random plasmalemmal distribution around 3-4 % for the NK1 or NK3 receptor (Table 2). These results of random plasmalemmal distribution were significantly different (paired Student t-test, P< 0.01) from the observed plasmalemmal distribution of immunogold particles for each of the receptors (Table 2). These results suggest a non-random distribution of NK1 and NK3 immunogold particles in VTA dendrites retrogradely labeled when FG is injected into either in Acb or mPFC.
Table 2.
Random-calculated (%RC) and observed plasmalemmal distribution of NK1 and NK3 immunogold particles in VTA dendrites retrogradely labeled with FG injected in the Acb or mPFC.
| Plasmalemmal distribution (%) | |||
|---|---|---|---|
| Random (%RC) | Observed | ||
| NK1 | Acb-VTA | 4.2 ± 0.2 n= 51 |
15.4 ± 3.3 ** n= 51 |
|
|
|||
| mPFC-VTA | 3.2 ± 0.2 n= 27 |
15.4 ± 4.7** n= 27 |
|
|
| |||
| NK3 | Acb-VTA | 4.3 ± 0.3 n= 44 |
17.5 ± 3.4** n= 44 |
|
|
|||
| mPFC-VTA | 3.9 ± 0.2 n= 25 |
12.6 ± 2.9** n= 25 |
|
P< 0.01; Paired Student t-test, random vs actual plasmalemmal distribution. The statistical analysis includes longitudinal and transversely cut dendrites.
Discussion
We have shown that both NK1 and NK3 receptors are located in mesolimbic and mesocortical pathways of the VTA; which are known to be involved in motivated behaviors and cognitive functions, as well as in the pathophysiology of schizophrenia (Bannon and Roth, 1983; Koob and Swerdlow, 1988; Wightman and Robinson, 2002; Wise, 2002; Abi-Dargham and Moore, 2003). In addition, however, major differences were observed in the dendritic content and nuclear localization of these receptor subtypes. First, VTA neurons providing inputs to mPFC had a greater (NK3) or lower (NK1) receptor-immunogold particle density in their dendrites as compared to those neurons projecting to the Acb. Second, in addition to the subcellular location in the cytosol or on the plasma membrane of somatodendritic profiles, NK3 receptors were distributed in the nucleus in both the rat VTA and human HEK-293T NK3 transfected cells. These results suggest that NK1 and NK3 receptors in the rat VTA have distributions conducive to predominant modulation of either mesocortical (NK3) or mesolimbic (NK1) pathways of the VTA. The nuclear location of NK3 receptors, which was also recently reported in neurons of the hypothalamus (Jensen et al., 2008), may suggest a new involvement in gene transcription. Together these observations provide a cellular substrate for understanding the modulatory function of NK3 receptors in the rat VTA, and may provide new clues on the antipsychotic effect of NK3 receptor antagonists in schizophrenia (Spooren et al., 2005; Smith and Dawson, 2008).
Methodological considerations
The immunogold labeling used to define the subcellular location of NK1 and NK3 receptors is now well recognized as having the high sensitivity and resolution needed to determine the basal distribution and trafficking of both G protein-coupled or ionotropic receptors in many brain regions (Boudin et al., 1998; Glass et al., 2004; Lessard and Pickel, 2005; Hara and Pickel, 2007; Lessard et al., 2007; Mengual et al., 2008). The quantitative analysis of immunogold particles provides results that have direct correspondence with functional ligand-binding sites identified by autoradiography (Boudin et al., 1998).
Our results are consistent with evidences that FG is able to detect dendrites up to the 4th or 5th branching orders of retrogradely labeled neurons (Schmued and Fallon, 1986; Pieribone and Aston-Jones, 1988; Van Bockstaele et al., 1994b). Moreover, iontophoretic application of FG has previously been shown to result in selective labeling of the tracer, with minimal labeling in fibers of passage (Pieribone and Aston-Jones, 1988; Schmued and Heimer, 1990). We have shown that injection of FG in either Acb or mPFC results in retrogradely labeled somata and large as well as many of the smaller dendrites in the paranigral and parabrachial portions of the VTA. The observed distribution is similar to that reported in previous tract tracing studies using FG (Van Bockstaele et al., 1994b; Van Bockstaele and Pickel, 1995; Carr and Sesack, 2000a; Garzon and Pickel, 2004).
All antisera used in the present study are well characterized and shown to have high specificities for their respective antigens (Vigna et al., 1994; Grady et al., 1996; Schmued and Heimer, 1990). The NK1 and NK3 antisera were shown to be selectively localized in the rat brain (Carpentier and Baude, 1996; Zerari et al., 1997), in the myenteric plexus of the rat ileum (NK1, Vigna et al., 1994), or in human prefrontal and visual cortex (NK3, Tooney et al., 2000). In the present and previous studies, the NK3 immunoreactivity seen in sections of spinal cord and the VTA, as well as in NK3 tranfected cells was absent when the antiserum was preadsorbed with the antigenic peptide (Grady et al., 1996; Oyamada et al., 1999; Seybold et al., 1997). In addition, we also tested the specificity of the NK3 antiserum in HEK-293T NK3 transfected cells, where we identified a protein corresponding in molecular weight to that of the NK3 receptor by Western blot. This result is consistent with previous NK3 receptor antiserum characterization studies using Western blot in transfected CHO cells (Grady et al., 1996) or in rat and human tissue (Mileusnic et al., 1999). By confocal microscopy, we have shown selective labeling in the cytosol and plasma membrane of somatodendritic profiles in rat VTA (FG, NK1 and NK3) or human transfected HEK-293 T cells (NK3 receptor). By electron microscopy, a similar distribution of NK1 and NK3 immunolabeling was observed using immunoperoxidase or immunogold techniques, and both methods presented minimal background.
The apparent discrepancy between the cytoplasmic electron microscopic immunogold labeling and confocal plasmalemmal labeling of NK1 and NK3 receptors in VTA soma may largely reflect methodological differences. The pre-embedding immunogold technique, which has limited penetration of immunoreagent, is visualized in 40-50 nm ultrathin sections (Adams et al., 2002). In contrast, scans of 20-30 μm section were performed by confocal microscopy, using a diffusible fluorescence product that was enhanced by the detergent Triton. These differences suggest that the plasmalemmal labeling may have been under estimated by electron microscopy. It is conceivable, however, that confocal microscopy lacks the resolution to distinguish between the plasma membrane and surface membrane of smooth endoplasmic reticulum.
Subcellular distribution of NK1 and NK3 receptors in somatodendritic profiles containing retrogradely transported FG from mPFC and Acb
In the present study, both NK1 and NK3 receptors were located in VTA neurons retrogradely labeled with FG injected either in mPFC or Acb. These projection neurons provide dopaminergic as well as GABAergic inputs to cortical and limbic associated brain regions (Carr and Sesack, 2000a). We have previously shown, by electron microscopy, that these receptors are located in dopaminergic and non-dopaminergic, presumably GABAergic, somatodendritic profiles in the rat VTA (Lessard and Pickel, 2005; Lessard et al., 2007). The receptors are potentially activated by the endogenous tachykinins, substance P and neurokinin A, which are expressed in striatal GABAergic inputs that are presynaptic to dopaminergic and GABAergic neurons in the VTA (Deutch et al., 1985; Kalivas et al., 1985; Tamiya et al., 1990; Gerfen and Wilson, 1996). Together, these results suggest that NK1 and NK3 receptors have locations conducive to tachykinin modulation of both GABAergic and dopaminergic mesocorticolimbic pathways in the rat VTA. The independent detection of NK1 and NK3 receptors in each of the two primary output from VTA neurons also suggests that at least some of these neurons may co-express both tachykinin receptor subtypes; as previously described in enteric neurons (Schmidlin et al., 2002) or primate substantia nigra (Levesque et al., 2007).
Dendrites of retrogradely labeled neurons from the mPFC showed a higher (NK3), or a lower (NK1) content of immunogold particles, as compared to dendrites retrogradely labeled following FG injection into the Acb. The enrichment of NK3 receptor immunogold particles may reflect greater dendritic trafficking or expression of NK3 receptors in mesocortical, as compared to mesolimbic VTA neurons. A heightened availability of NK3 receptors in mesocortical projection neurons may contribute, in part, to the faster firing rates and higher action potential bursts in mesocortical dopaminergic neurons, as compared to mesolimbic dopaminergic neurons (Bannon and Roth, 1983; Tzschentke, 2001; Sesack and Carr, 2002). It is also possible, however, that the lower amount of NK3 immunogold labeling in the mesolimbic pathway is a reflection of greater axonal transport of these receptors to terminals in the Acb or to region-specific differences in axonal collaterization of VTA projection neurons (Fallon, 1981; Pinto and Sesack, 2000). A major presynaptic locations of NK3 receptors in the mesolimbic dopamine projection neurons is consistent with evidence that activation of NK3 receptors in the Acb potently releases dopamine (Tremblay et al., 1992; Glowinski et al., 1993; ; Beaujouan et al., 2004). Further studies are needed to distinguish between these possibilities.
Nuclear NK3 receptor distribution
In contrast to FG or NK1 immunolabeling, NK3 receptor immunoreactivity was observed in neuronal nuclei of the rat VTA as well as in human HEK-293T NK3-transfected cells. This is consistent with a recent study showing trafficking of the NK3 receptor in the nuclei of hypothalamus neurons following an osmotic challenge (Jensen et al., 2008). Tachykinin receptors are among several other members of the G-protein-coupled receptor (GPCR) family that have been recently localized in the nucleus. These include angiotensin I receptor in rat brain (Lu et al., 1998; Lee et al., 2004), endothelin-1 receptor in rat cardiomyocytes and human aortic smooth muscle cell (Bkaily et al., 2000; Boivin et al., 2003), bradykinin B2 receptor in human HEK-293T cells (Lee et al., 2004), and neuropeptide Y receptor in human endothelial cells (Jacques et al., 2003). These receptors, along with the NK3, but not the NK1 receptor, display a putative peptide sequence referred to “nuclear localization signal motif” located at the C-terminal portion of the receptor (Lee et al., 2004; Gobeil et al., 2006a). Although the mechanism of action is still unclear, it is suggested that nuclear GPCRs could be either translocated from the cytosol to the nucleus or activated at the nuclear membrane by nonsecreted ligands (Gobeil et al., 2006a). The present location of NK3 receptors within nuclei and on the plasma membrane, as well as throughout the cytosol of VTA neurons is consistent with a cytosolic translocation of NK3 receptors to nuclear sites. Nuclear GPCRs are part of a novel paradigm, which targets them as new candidates in gene transcription regulation (Gobeil et al., 2006a). The present detection of NK3 nuclear immunoreactivity in neurons of the rat VTA and in NK3 transfected cells provides important new insight to the involvement of NK3 receptors in transcriptional mechanisms that could play a role in the antipsychotic effectiveness of NK3 receptor antagonists in schizophrenia.
Conclusion and significance
There is emerging evidences that the therapeutic effectiveness of NK3 antagonists in treating schizophrenia symptoms is ascribed to opposition of the NK3 mediated stimulation of tonic release of dopamine in the Acb (Spooren et al., 2005). This idea is consistent with the demonstrated hyperactivity of mesolimbic dopamine neurons in schizophrenia and the effectiveness of typical antipsychotic drugs that block dopamine D2 receptors (Carlsson and Lindqvist, 1963; Abi-Dargham et al., 1998; Laruelle et al., 2003).
While our present and previous results do not rule out this hypothesis, they reveal alternative possibilities that could also divulge atypical antipsychotic activity of NK3 receptor antagonists that are dictated by the cellular and subcellular locations of NK3 receptors in VTA neurons that project to the mPFC. We previously observed that in the rat paranigral portion of the VTA, NK3 receptors are located in dopaminergic, but more prominently in non-dopaminergic, presumably GABAergic neurons (Lessard et al., 2007). This suggests that NK3 receptors could also have a modulatory role in the inhibitory transmission through local VTA interneurons or GABAergic parallel projection neurons to the Acb (Sesack and Carr, 2002). Results of the present study are summarized in Fig 9, where we diagrammatically show that NK3 receptors are highly expressed in neurons of the VTA that send projections to mPFC. The majority of these neurons may be dopaminergic, since dopaminergic neurons provide major input to the mPFC (Carr and Sesack, 2000a). Alteration of dopaminergic activity in this neuronal pathway is associated with cognitive impairments observed in schizophrenia (Abi-Dargham and Moore, 2003). Thus, our results in rats have implications for understanding the cellular function of NK3 receptors in the VTA and the mechanism underlying the antipsychotic effectiveness of NK3 antagonists. They also suggest that at least some of the NK3 receptor-mediated effects of tachykinins can be augmented or opposed through NK1 receptor activation.
Figure 9.
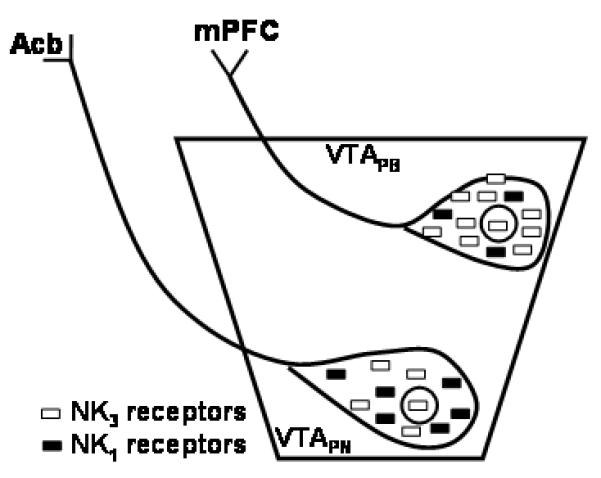
Schematic representation of subcellular localization of NK3 and NK1 receptors in the paranigral (VTAPN) and parabrachial (VTA PB) neurons of the rat VTA. The parabrachial VTA contains significantly more NK3 or less NK1 immunoreactivity as compared to neurons of the paranigral VTA. In addition, we observed NK3 immunoreactivity in the nucleus (circle) of both paranigral and parabrachial VTA. Acb, nucleus accumbens. mPFC, medial prefrontal cortex.
Acknowledgements
Authors are grateful to Cesar Porrero for technical assistance and to Drs. G. Bkaily and J. Anrather for assistance in confocal microscope.
This research was supported by grants from NIDA (DA04600, DA005130), NIMH (MH40342) and NIH (HL18974) to V.M. Pickel; CIHR (MOP-66998) to F. Gobeil Jr. M. Savard is a recipient of a fellowship award from the FRSQ. F. Gobeil is a recipient of a Junior 1 scholarship from the FRSQ and a researcher of the CFI.
Footnotes
Editor-in-Chief: John E. Johnson Jr., Ph.D.
References
- Abi-Dargham A, Gil R, Krystal J, Baldwin RM, Seibyl JP, Bowers M, van Dyck CH, Charney DS, Innis RB, Laruelle M. Increased striatal dopamine transmission in schizophrenia: confirmation in a second cohort. Am J Psychiatry. 1998;155(6):761–767. doi: 10.1176/ajp.155.6.761. [DOI] [PubMed] [Google Scholar]
- Abi-Dargham A, Moore H. Prefrontal DA transmission at D1 receptors and the pathology of schizophrenia. Neuroscientist. 2003;9(5):404–416. doi: 10.1177/1073858403252674. [DOI] [PubMed] [Google Scholar]
- Adams MM, Fink SE, Shah RA, Janssen WG, Hayashi S, Milner TA, McEwen BS, Morrison JH. Estrogen and aging affect the subcellular distribution of estrogen receptor-alpha in the hippocampus of female rats. J Neurosci. 2002;22:3608–3614. doi: 10.1523/JNEUROSCI.22-09-03608.2002. [DOI] [PMC free article] [PubMed] [Google Scholar]
- Bannon MJ, Brownschidle LA, Tian Y, Whitty CJ, Poosch MS, D’sa C, Moody CA. Neurokinin-3 receptors modulate dopamine cell function and alter the effects of 6-hydroxydopamine. Brain Res. 1995;695(1):19–24. doi: 10.1016/0006-8993(95)00791-n. [DOI] [PubMed] [Google Scholar]
- Bannon MJ, Roth RH. Pharmacology of mesocortical dopamine neurons. Pharmacol Rev. 1983;35(1):53–68. [PubMed] [Google Scholar]
- Bartho L, Holzer P. Search for a physiological role of substance P in gastrointestinal motility. Neuroscience. 1985;16:1–32. doi: 10.1016/0306-4522(85)90043-0. [DOI] [PubMed] [Google Scholar]
- Bayer VE, Pickel VM. Ultrastructural localization of tyrosine hydroxylase in the rat ventral tegmental area: relationship between immunolabeling density and neuronal associations. J Neurosci. 1990;10(9):2996–3013. doi: 10.1523/JNEUROSCI.10-09-02996.1990. [DOI] [PMC free article] [PubMed] [Google Scholar]
- Beaujouan JC, Torrens Y, Saffroy M, Kemel ML, Glowinski J. A 25 year adventure in the field of tachykinins. Peptides. 2004;25(3):339–357. doi: 10.1016/j.peptides.2004.02.011. [DOI] [PubMed] [Google Scholar]
- Bkaily G, Choufani S, Hassan G, El-Bizri N, Jacques D, D’Orleans-Juste P. Presence of functional endothelin-1 receptors in nuclear membranes of human aortic vascular smooth muscle cells. J Cardiovasc Pharmacol. 2000;36(5 Suppl 1):S414–417. doi: 10.1097/00005344-200036051-00121. [DOI] [PubMed] [Google Scholar]
- Boivin B, Chevalier D, Villeneuve LR, Rousseau E, Allen BG. Functional endothelin receptors are present on nuclei in cardiac ventricular myocytes. J Biol Chem. 2003;278(31):29153–29163. doi: 10.1074/jbc.M301738200. [DOI] [PubMed] [Google Scholar]
- Boudin H, Pelaprat D, Rostene W, Pickel VM, Beaudet A. Correlative ultrastructural distribution of neurotensin receptor proteins and binding sites in the rat substantia nigra. J Neurosci. 1998;18:8473–8484. doi: 10.1523/JNEUROSCI.18-20-08473.1998. [DOI] [PMC free article] [PubMed] [Google Scholar]
- Burcher E, Buck SH, Lovenberg W, O’Donohue TL. Characterization and autoradiographic localization of multiple tachykinin binding sites in gastrointestinal tract and bladder. J Pharmacol Exp Ther. 1986;236:819–831. [PubMed] [Google Scholar]
- Carlsson A, Lindqvist M. Effect of Chlorpromazine or Haloperidol on Formation of 3methoxytyramine and Normetanephrine in Mouse Brain. Acta Pharmacol Toxicol (Copenh) 1963;20:140–144. doi: 10.1111/j.1600-0773.1963.tb01730.x. [DOI] [PubMed] [Google Scholar]
- Carpentier C, Baude A. Immunocytochemical localisation of NK3 receptors in the dorsal vagal complex of rat. Brain Res. 1996;734:327–331. [PubMed] [Google Scholar]
- Carr DB, Sesack SR. GABA-containing neurons in the rat ventral tegmental area project to the prefrontal cortex. Synapse. 2000a;38:114–123. doi: 10.1002/1098-2396(200011)38:2<114::AID-SYN2>3.0.CO;2-R. [DOI] [PubMed] [Google Scholar]
- Carr DB, Sesack SR. Projections from the rat prefrontal cortex to the ventral tegmental area: target specificity in the synaptic associations with mesoaccumbens and mesocortical neurons. J Neurosci. 2000b;20:3864–3873. doi: 10.1523/JNEUROSCI.20-10-03864.2000. [DOI] [PMC free article] [PubMed] [Google Scholar]
- Chan J, Aoki C, Pickel VM. Optimization of differential immunogold-silver and peroxidase labeling with maintenance of ultrastructure in brain sections before plastic embedding. J Neurosci Methods. 1990;33(2-3):113–127. doi: 10.1016/0165-0270(90)90015-8. [DOI] [PMC free article] [PubMed] [Google Scholar]
- Chen LW, Guan ZL, Ding YQ. Mesencephalic dopaminergic neurons expressing neuromedin K receptor (NK3): a double immunocytochemical study in the rat. Brain Res. 1998;780(1):150–154. [PubMed] [Google Scholar]
- Deschamps K, Couture R. The ventral tegmental area as a putative target for tachykinins in cardiovascular regulation. Br J Pharmacol. 2005;145(6):712–727. doi: 10.1038/sj.bjp.0706249. [DOI] [PMC free article] [PubMed] [Google Scholar]
- Deutch AY, Maggio JE, Bannon MJ, Kalivas PW, Tam SY, Goldstein M, Roth RH. Substance K and substance P differentially modulate mesolimbic and mesocortical systems. Peptides. 1985;6(Suppl 2):113–122. doi: 10.1016/0196-9781(85)90143-3. [DOI] [PubMed] [Google Scholar]
- Fallon JH. Collateralization of monoamine neurons: mesotelencephalic dopamine projections to caudate, septum, and frontal cortex. J Neurosci. 1981;1(12):1361–1368. doi: 10.1523/JNEUROSCI.01-12-01361.1981. [DOI] [PMC free article] [PubMed] [Google Scholar]
- Farde L. Brain imaging of schizophrenia--the dopamine hypothesis. Schizophr Res. 1997;28(2-3):157–162. doi: 10.1016/s0920-9964(97)00121-7. [DOI] [PubMed] [Google Scholar]
- Garzon M, Pickel VM. Ultrastructural localization of Leu5-enkephalin immunoreactivity in mesocortical neurons and their input terminals in rat ventral tegmental area. Synapse. 2004;52(1):38–52. doi: 10.1002/syn.20000. [DOI] [PubMed] [Google Scholar]
- Gerfen CR, Wilson CJ. In: The basal ganglia. Swanson LW, editor. Elsevier Science. A.B.T.H.; New York: 1996. pp. 371–451. [Google Scholar]
- Glass MJ, Kruzich PJ, Kreek MJ, Pickel VM. Decreased plasma membrane targeting of NMDA-NR1 receptor subunit in dendrites of medial nucleus tractus solitarius neurons in rats self-administering morphine. Synapse. 2004;53:191–201. doi: 10.1002/syn.20049. [DOI] [PubMed] [Google Scholar]
- Glowinski J, Kemel ML, Desban M, Gauchy C, Lavielle S, Chassaing G, Beaujouan JC, Tremblay L. Distinct presynaptic control of dopamine release in striosomal- and matrix-enriched areas of the rat striatum by selective agonists of NK1, NK2 and NK3 tachykinin receptors. Regul Pept. 1993;46(1-2):124–128. doi: 10.1016/0167-0115(93)90022-z. [DOI] [PubMed] [Google Scholar]
- Gobeil F, Fortier A, Zhu T, Bossolasco M, Leduc M, Grandbois M, Heveker N, Bkaily G, Chemtob S, Barbaz D. G-protein-coupled receptors signalling at the cell nucleus: an emerging paradigm. Can J Physiol Pharmacol. 2006a;84(3-4):287–297. doi: 10.1139/y05-127. [DOI] [PubMed] [Google Scholar]
- Gobeil F, Jr., Zhu T, Brault S, Geha A, Vazquez-Tello A, Fortier A, Barbaz D, Checchin D, Hou X, Nader M, Bkaily G, Gratton JP, Heveker N, Ribeiro-da-Silva A, Peri K, Bard H, Chorvatova A, D’Orleans-Juste P, Goetzl EJ, Chemtob S. Nitric oxide signaling via nuclearized endothelial nitric-oxide synthase modulates expression of the immediate early genes iNOS and mPGES-1. J Biol Chem. 2006b;281(23):16058–16067. doi: 10.1074/jbc.M602219200. [DOI] [PubMed] [Google Scholar]
- Grady EF, Baluk P, Bohm S, Gamp PD, Wong H, Payan DG, Ansel J, Portbury AL, Furness JB, McDonald DM, Bunnett NW. Characterization of antisera specific to NK1, NK2, and NK3 neurokinin receptors and their utilization to localize receptors in the rat gastrointestinal tract. J Neurosci. 1996;16(21):6975–6986. doi: 10.1523/JNEUROSCI.16-21-06975.1996. [DOI] [PMC free article] [PubMed] [Google Scholar]
- Hara Y, Pickel VM. Dendritic distributions of dopamine D1 receptors in the rat nucleus accumbens are synergistically affected by startle-evoking auditory stimulation and apomorphine. Neuroscience. 2007;146:1593–1605. doi: 10.1016/j.neuroscience.2007.04.005. [DOI] [PMC free article] [PubMed] [Google Scholar]
- Helke CJ, Krause JE, Mantyh PW, Couture R, Bannon MJ. Diversity in mammalian tachykinin peptidergic neurons: multiple peptides, receptors, and regulatory mechanisms. Faseb J. 1990;4:1606–1615. [PubMed] [Google Scholar]
- Jacques D, Sader S, Perreault C, Fournier A, Pelletier G, Beck-Sickinger AG, Descorbeth M. Presence of neuropeptide Y and the Y1 receptor in the plasma membrane and nuclear envelope of human endocardial endothelial cells: modulation of intracellular calcium. Can J Physiol Pharmacol. 2003;81(3):288–300. doi: 10.1139/y02-165. [DOI] [PubMed] [Google Scholar]
- Jensen D, Zhang Z, Flynn FW. Trafficking of tachykinin neurokinin 3 receptor to nuclei of neurons in the paraventricular nucleus of the hypothalamus following osmotic challenge. Neuroscience. 2008;155:308–316. doi: 10.1016/j.neuroscience.2008.05.024. [DOI] [PMC free article] [PubMed] [Google Scholar]
- Kalivas PW, Deutch AY, Maggio JE, Mantyh PW, Roth RH. Substance K and substance P in the ventral tegmental area. Neurosci Lett. 1985;57(3):241–246. doi: 10.1016/0304-3940(85)90498-7. [DOI] [PubMed] [Google Scholar]
- Koob GF, Swerdlow NR. The functional output of the mesolimbic dopamine system. Ann N Y Acad Sci. 1988;537:216–227. doi: 10.1111/j.1749-6632.1988.tb42108.x. [DOI] [PubMed] [Google Scholar]
- Lacoste B, Riad M, Descarries L. Immunocytochemical evidence for the existence of substance P receptor (NK1) in serotonin neurons of rat and mouse dorsal raphe nucleus. Eur J Neurosci. 2006;23:2947–2958. doi: 10.1111/j.1460-9568.2006.04833.x. [DOI] [PubMed] [Google Scholar]
- Laruelle M, Kegeles LS, Abi-Dargham A. Glutamate, dopamine, and schizophrenia: from pathophysiology to treatment. Ann N Y Acad Sci. 2003;1003:138–158. doi: 10.1196/annals.1300.063. [DOI] [PubMed] [Google Scholar]
- Lee DK, Lanca AJ, Cheng R, Nguyen T, Ji XD, Gobeil F, Jr., Chemtob S, George SR, O’Dowd BF. Agonist-independent nuclear localization of the Apelin, angiotensin AT1, and bradykinin B2 receptors. J Biol Chem. 2004;279(9):7901–7908. doi: 10.1074/jbc.M306377200. [DOI] [PubMed] [Google Scholar]
- Leranth C, Pickel VM. Electron microscopic pre-embedding double immunostaining methods. In: L H, L Z, editors. Tract tracing methods 2, recent progress. Plenum; New York: 1889. pp. 129–172. [Google Scholar]
- Lessard A, Grady EF, Bunnett NW, Pickel VM. Predominant surface distribution of neurokinin-3 receptors in non-dopaminergic dendrites in the rat substantia nigra and ventral tegmental area. Neuroscience. 2007;144(4):1393–1408. doi: 10.1016/j.neuroscience.2006.10.058. [DOI] [PubMed] [Google Scholar]
- Lessard A, Pickel VM. Subcellular distribution and plasticity of neurokinin-1 receptors in the rat substantia nigra and ventral tegmental area. Neuroscience. 2005;135(4):1309–1323. doi: 10.1016/j.neuroscience.2005.07.025. [DOI] [PubMed] [Google Scholar]
- Levesque M, Wallman MJ, Parent R, Sik A, Parent A. Neurokinin-1 and neurokinin-3 receptors in primate substantia nigra. Neurosci Res. 2007;57(3):362–371. doi: 10.1016/j.neures.2006.11.002. [DOI] [PubMed] [Google Scholar]
- Liu H, Brown JL, Jasmin L, Maggio JE, Vigna SR, Mantyh PW, Basbaum AI. Synaptic relationship between substance P and the substance P receptor: light and electron microscopic characterization of the mismatch between neuropeptides and their receptors. Proc Natl Acad Sci U S A. 1994;91:1009–1013. doi: 10.1073/pnas.91.3.1009. [DOI] [PMC free article] [PubMed] [Google Scholar]
- Lu D, Yang H, Shaw G, Raizada MK. Angiotensin II-induced nuclear targeting of the angiotensin type 1 (AT1) receptor in brain neurons. Endocrinology. 1998;139(1):365–375. doi: 10.1210/endo.139.1.5679. [DOI] [PubMed] [Google Scholar]
- Mantyh PW, Gates T, Mantyh CR, Maggio JE. Autoradiographic localization and characterization of tachykinin receptor binding sites in the rat brain and peripheral tissues. J Neurosci. 1989;9:258–279. doi: 10.1523/JNEUROSCI.09-01-00258.1989. [DOI] [PMC free article] [PubMed] [Google Scholar]
- Mantyh PW, Allen CJ, Ghilardi JR, Rogers SD, Mantyh CR, Liu H, Basbaum AI, Vigna SR, Maggio JE. Rapid endocytosis of a G protein-coupled receptor: substance P evoked internalization of its receptor in the rat striatum in vivo. Proc Natl Acad Sci U S A. 1995a;92:2622–2626. doi: 10.1073/pnas.92.7.2622. [DOI] [PMC free article] [PubMed] [Google Scholar]
- Mantyh PW, DeMaster E, Malhotra A, Ghilardi JR, Rogers SD, Mantyh CR, Liu H, Basbaum AI, Vigna SR, Maggio JE. Receptor endocytosis and dendrite reshaping in spinal neurons after somatosensory stimulation. Science. 1995b;268:1629–1632. doi: 10.1126/science.7539937. [DOI] [PubMed] [Google Scholar]
- Marco N, Thirion A, Mons G, Bougault I, Le Fur G, Soubrie P, Steinberg R. Activation of dopaminergic and cholinergic neurotransmission by tachykinin NK3 receptor stimulation: an in vivo microdialysis approach in guinea pig. Neuropeptides. 1998;32(5):481–488. doi: 10.1016/s0143-4179(98)90075-0. [DOI] [PubMed] [Google Scholar]
- Meltzer HY, Arvanitis L, Bauer D, Rein W. Placebo-controlled evaluation of four novel compounds for the treatment of schizophrenia and schizoaffective disorder. Am J Psychiatry. 2004;161(6):975–984. doi: 10.1176/appi.ajp.161.6.975. [DOI] [PubMed] [Google Scholar]
- Mengual E, Chan J, Lane D, San Luciano Palenzuela M, Hara Y, Lessard A, Pickel VM. Neurokinin-1 receptors in cholinergic neurons of the rat ventral pallidum have a predominantly dendritic distribution that is affected by apomorphine when combined with startle-evoking auditory stimulation. Neuroscience. 2008;151:711–724. doi: 10.1016/j.neuroscience.2007.08.039. [DOI] [PMC free article] [PubMed] [Google Scholar]
- Mileusnic D, Lee JM, Magnuson DJ, Hejna MJ, Krause JE, Lorens JB, Lorens SA. Neurokinin-3 receptor distribution in rat and human brain: an immunohistochemical study. Neuroscience. 1999;89(4):1269–1290. doi: 10.1016/s0306-4522(98)00349-2. [DOI] [PubMed] [Google Scholar]
- Mounir S, Parent A. The expression of neurokinin-1 receptor at striatal and pallidal levels in normal human brain. Neurosci Res. 2002;44:71–81. doi: 10.1016/s0168-0102(02)00087-1. [DOI] [PubMed] [Google Scholar]
- Oades RD, Halliday GM. Ventral tegmental (A10) system: neurobiology. 1. Anatomy and connectivity. Brain Res. 1987;434(2):117–165. doi: 10.1016/0165-0173(87)90011-7. [DOI] [PubMed] [Google Scholar]
- Overton P, Elliott PJ, Hagan RM, Clark D. Neurokinin agonists differentially affect A9 and A10 dopamine cells in the rat. Eur J Pharmacol. 1992;213(1):165–166. doi: 10.1016/0014-2999(92)90251-x. [DOI] [PubMed] [Google Scholar]
- Oyamada H, Takatsuji K, Senba E, Mantyh PW, Tohyama M. Postnatal development of NK1, NK2, and NK3 neurokinin receptors expression in the rat retina. Brain Res Dev Brain Res. 1999;117(1):59–70. doi: 10.1016/s0165-3806(99)00099-1. [DOI] [PubMed] [Google Scholar]
- Paxinos G, Watson C. The rat brain in stereotaxic coordinates. Academic Press; Toronto: 1986. [DOI] [PubMed] [Google Scholar]
- Pederson T. Dynamics and genome-centricity of interchromatin domains in the nucleus. Nature cell biology. 2002;4:E287–E291. doi: 10.1038/ncb1202-e287. [DOI] [PubMed] [Google Scholar]
- Peters A, Palay SL, Webster HD. The fine structure of the nervous system. Oxford University Press; New York: 1991. [Google Scholar]
- Pieribone VA, Aston-Jones G. The iontophoretic application of Fluoro-Gold for the study of afferents to deep brain nuclei. Brain Res. 1988;475(2):259–271. doi: 10.1016/0006-8993(88)90614-2. [DOI] [PubMed] [Google Scholar]
- Pinto A, Sesack SR. Limited collateralization of neurons in the rat prefrontal cortex that project to the nucleus accumbens. Neuroscience. 2000;97(4):635–642. doi: 10.1016/s0306-4522(00)00042-7. [DOI] [PubMed] [Google Scholar]
- Regoli D, Boudon A, Fauchere JL. Receptors and antagonists for substance P and related peptides. Pharmacol Rev. 1994;46(4):551–599. [PubMed] [Google Scholar]
- Schmidlin F, Dery O, Bunnett NW, Grady EF. Heterologous regulation of trafficking and signaling of G protein-coupled receptors: beta-arrestin-dependent interactions between neurokinin receptors. Proc Natl Acad Sci U S A. 2002;99(5):3324–3329. doi: 10.1073/pnas.052161299. [DOI] [PMC free article] [PubMed] [Google Scholar]
- Schmued LC, Fallon JH. Fluoro-Gold: a new fluorescent retrograde axonal tracer with numerous unique properties. Brain Res. 1986;377(1):147–154. doi: 10.1016/0006-8993(86)91199-6. [DOI] [PubMed] [Google Scholar]
- Schmued LC, Heimer L. Iontophoretic injection of fluoro-gold and other fluorescent tracers. J Histochem Cytochem. 1990;38(5):721–723. doi: 10.1177/38.5.2332627. [DOI] [PubMed] [Google Scholar]
- Schmued LC, Kyriakidis K, Fallon JH, Ribak CE. Neurons containing retrogradely transported Fluoro-Gold exhibit a variety of lysosomal profiles: a combined brightfield, fluorescence, and electron microscopic study. J Neurocytol. 1989;18(3):333–343. doi: 10.1007/BF01190836. [DOI] [PubMed] [Google Scholar]
- Seabrook GR, Bowery BJ, Hill RG. Pharmacology of tachykinin receptors on neurones in the ventral tegmental area of rat brain slices. Eur J Pharmacol. 1995;273(1-2):113–119. doi: 10.1016/0014-2999(94)00681-v. [DOI] [PubMed] [Google Scholar]
- Sesack SR, Carr DB. Selective prefrontal cortex inputs to dopamine cells: implications for schizophrenia. Physiol Behav. 2002;77(4-5):513–517. doi: 10.1016/s0031-9384(02)00931-9. [DOI] [PubMed] [Google Scholar]
- Seybold VS, Grkovic I, Portbury AL, Ding YQ, Shigemoto R, Mizuno N, Furness JB, Southwell BR. Relationship of NK3 receptor-immunoreactivity to subpopulations of neurons in rat spinal cord. J Comp Neurol. 1997;381(4):439–448. doi: 10.1002/(sici)1096-9861(19970519)381:4<439::aid-cne4>3.0.co;2-3. [DOI] [PubMed] [Google Scholar]
- Smith PW, Dawson LA. Neurokinin 3 (NK3) receptor modulators for the treatment of psychiatric disorders. Recent Patents CNS drug Discov. 2008;3(1):1–15. doi: 10.2174/157488908783421447. [DOI] [PubMed] [Google Scholar]
- Spooren W, Riemer C, Meltzer H. Opinion: NK3 receptor antagonists: the next generation of antipsychotics? Nat Rev Drug Discov. 2005;4(12):967–975. doi: 10.1038/nrd1905. [DOI] [PubMed] [Google Scholar]
- Svingos AL, Garzon M, Colago EE, Pickel VM. Mu-opioid receptors in the ventral tegmental area are targeted to presynaptically and directly modulate mesocortical projection neurons. Synapse. 2001;41(3):221–229. doi: 10.1002/syn.1079. [DOI] [PubMed] [Google Scholar]
- Swanson LW. The projections of the ventral tegmental area and adjacent regions: a combined fluorescent retrograde tracer and immunofluorescence study in the rat. Brain Res Bull. 1982;9(1-6):321–353. doi: 10.1016/0361-9230(82)90145-9. [DOI] [PubMed] [Google Scholar]
- Tamiya R, Hanada M, Kawai Y, Inagaki S, Takagi H. Substance P afferents have synaptic contacts with dopaminergic neurons in the ventral tegmental area of the rat. Neurosci Lett. 1990;110(1-2):11–15. doi: 10.1016/0304-3940(90)90779-9. [DOI] [PubMed] [Google Scholar]
- Tooney PA, Au GG, Chahl LA. Tachykinin NK1 and NK3 receptors in the prefrontal cortex of the human brain. Clin Exp Pharmacol Physiol. 2000;27(11):947–949. doi: 10.1046/j.1440-1681.2000.03367.x. [DOI] [PubMed] [Google Scholar]
- Tremblay L, Kemel ML, Desban M, Gauchy C, Glowinski J. Distinct presynaptic control of dopamine release in striosomal- and matrix-enriched areas of the rat striatum by selective agonists of NK1, NK2, and NK3 tachykinin receptors. Proc Natl Acad Sci U S A. 1992;89(23):11214–11218. doi: 10.1073/pnas.89.23.11214. [DOI] [PMC free article] [PubMed] [Google Scholar]
- Tzschentke TM. Pharmacology and behavioral pharmacology of the mesocortical dopamine system. Prog Neurobiol. 2001;63(3):241–320. doi: 10.1016/s0301-0082(00)00033-2. [DOI] [PubMed] [Google Scholar]
- Van Bockstaele EJ, Pickel VM. GABA-containing neurons in the ventral tegmental area project to the nucleus accumbens in rat brain. Brain Res. 1995;682(1-2):215–221. doi: 10.1016/0006-8993(95)00334-m. [DOI] [PubMed] [Google Scholar]
- Van Bockstaele EJ, Cestari DM, Pickel VM. Synaptic structure and connectivity of serotonin terminals in the ventral tegmental area: potential sites for modulation of mesolimbic dopamine neurons. Brain Res. 1994a;647:307–322. doi: 10.1016/0006-8993(94)91330-7. [DOI] [PubMed] [Google Scholar]
- Van Bockstaele EJ, Wright AM, Cestari DM, Pickel VM. Immunolabeling of retrogradely transported Fluoro-Gold: sensitivity and application to ultrastructural analysis of transmitter-specific mesolimbic circuitry. J Neurosci Methods. 1994b;55:65–78. doi: 10.1016/0165-0270(94)90042-6. [DOI] [PubMed] [Google Scholar]
- Vigna SR, Bowden JJ, McDonald DM, Fisher J, Okamoto A, McVey DC, Payan DG, Bunnett NW. Characterization of antibodies to the rat substance P (NK-1) receptor and to a chimeric substance P receptor expressed in mammalian cells. J Neurosci. 1994;14(2):834–845. doi: 10.1523/JNEUROSCI.14-02-00834.1994. [DOI] [PMC free article] [PubMed] [Google Scholar]
- Wightman RM, Robinson DL. Transient changes in mesolimbic dopamine and their association with ‘reward’. J Neurochem. 2002;82(4):721–735. doi: 10.1046/j.1471-4159.2002.01005.x. [DOI] [PubMed] [Google Scholar]
- Wise RA. Brain reward circuitry: insights from unsensed incentives. Neuron. 2002;36(2):229–240. doi: 10.1016/s0896-6273(02)00965-0. [DOI] [PubMed] [Google Scholar]
- Zerari F, Karpitskiy V, Krause J, Descarries L, Couture R. Immunoelectron microscopic localization of NK-3 receptor in the rat spinal cord. Neuroreport. 1997;8:2661–2664. doi: 10.1097/00001756-199708180-00005. [DOI] [PubMed] [Google Scholar]