

Summary
The kidney and vasculature are intimately linked functionally and during development, where nephric and blood/vascular progenitor cells occupy adjacent bands of mesoderm in zebrafish and frog embryos. Developmental mechanisms underlying the differentiation of kidney vs. blood/vascular lineages remain unknown. The odd skipped related1 (osr1) gene encodes a zinc finger transcription factor that is expressed in the germ ring mesendoderm and subsequently in the endoderm and intermediate mesoderm, prior to the expression of definitive kidney or blood/vascular markers. Knockdown of osr1 in zebrafish embryos resulted in a complete, segment-specific loss of anterior kidney progenitors and a compensatory increase in the number of angioblast cells in the same trunk region. Histology revealed a subsequent absence of kidney tubules, enlarged cardinal vein, and expansion of the posterior venous plexus. Altered kidney vs. vascular development correlated with expanded endoderm development in osr1 knockdowns. Combined osr1 loss of function and blockade of endoderm development by knockdown of sox32/casanova rescued anterior kidney development. The results indicate that osr1 activity is required to limit endoderm differentiation from mesendoderm and, in the absence of osr1, excess endoderm alters mesoderm differentiation, shifting the balance from kidney toward vascular development.
Keywords: odd-skipped related, endoderm, pronephros, vasculature, glomerulus, kidney development
Introduction
The kidney and vasculature are mesodermal derivatives that originate from adjacent regions of gastrulating fish and frog embryos (Iraha et al., 2002; Kimelman, 2006; Kimmel et al., 1990; Walmsley et al., 2002). Soon after gastrulation is complete, zebrafish kidney progenitors, marked by the expression of transcriptional regulators such as pax2a (Krauss et al., 1991; Majumdar et al., 2000) and lim1 (Toyama and Dawid, 1997), and blood/vascular progenitors, marked by expression of scl (Gering et al., 1998) and gata1 (Detrich et al., 1995) are found in adjacent stripes of mesoderm lateral to the somites. These tissues, referred to as intermediate mesoderm (IM) in nephric development and lateral plate mesoderm (LPM) in blood vascular development, serve as the source of all pronephric cells, the posterior blood islands, and the main vessels of the trunk, the dorsal aorta and the cardinal vein. Analysis of mesoderm patterning in frog embryos has demonstrated overlapping expression of the vascular marker fli1 and the kidney marker lim1 in intermediate mesoderm (Walmsley et al., 2002), suggesting that prior to cell differentiation, kidney and blood/vascular cells may share a common progenitor cell population. The close association of kidney and vascular progenitor cells during development is ultimately manifested as a functional relationship in the mature organs, where arterial blood is filtered by the kidney glomerulus and metabolites recovered by kidney tubules are delivered directly back to the venous blood supply. This relationship between kidney and vascular tissues raises the idea that the specification of kidney and vascular progenitor cells in early embryos may be influenced by common developmental regulatory factors.
Both kidney and vascular patterning is strongly influenced by bone morphogenetic proteins (BMPs) during gastrulation (Kimelman, 2006; Kimelman and Griffin, 2000; Pyati et al., 2005; Stickney et al., 2007; Szeto and Kimelman, 2004). Zebrafish mutants defective in BMP signaling such as swirl/bmp2b (Kishimoto et al., 1997; Nguyen et al., 1998), snailhouse/bmp7 (Dick et al., 2000; Schmid et al., 2000), and somitabun/smad5 (Hild et al., 1999) show a reduced number of both kidney and blood cell progenitors and an expansion of dorsal somites, while ventralized/posteriorized mutants lacking BMP inhibitors such as chordino/chordin and the tolloid antagonist ogon/sizzled show an enlargement of kidney and blood precursor cell populations and a loss of anterior somites (Hammerschmidt et al., 1996; Leung et al., 2005; Miller-Bertoglio et al., 1999). Signaling events occurring later in development may also affect kidney vs. blood/vascular fates. Post-gastrulation expression of a dominant-negative BMP receptor expands the gata1-positive blood progenitor cell population and reduces the number of pax2a-positive kidney progenitor cells in the ventro-posterior mesoderm (Gupta et al., 2006). Mutations in BMP4 affect ventro-lateral mesoderm at post-gastrulation stages, favoring blood and kidney development at the expense of vascular development (Stickney et al., 2007). Evidence has also been presented that blood/vascular and kidney fates may be mutually exclusive in the mesoderm. Ectopic over-expression of the blood/vascular transcriptional regulators scl and lmo2 during early development results in expansion of the blood/vascular progenitor cell population at the expense of kidney progenitors, indicating that intermediate mesoderm can be transfated to blood/vasculature mesoderm (Gering et al., 2003). These findings suggest that the differentiation of the blood/vascular and kidney lineages are linked at multiple stages of development. It is likely that in addition to BMP signaling, other morphogens and transcriptional circuitry is required to ultimately define lateral mesoderm cell lineages.
The zinc-finger transcription factor odd-skipped related 1 (osr1) is initially expressed in the mesendoderm in gastrulating zebrafish embryos and later, in a broad domain of lateral plate/intermediate mesoderm that encompasses both kidney and vascular mesoderm in chick, mouse, and zebrafish embryos (James et al., 2006; Tena et al., 2007; Wang et al., 2005). Mouse embryos lacking a functional Osr1 gene show cardiac defects and kidney agenesis (James et al., 2006; Wang et al., 2005). Knockdown experiments in zebrafish have also revealed a role for osr1 in pronephric development (Tena et al., 2007). We present here evidence that osr1 is not only required for zebrafish kidney development but that it also controls the commitment of mesoderm to the angioblast cell fate. Surprisingly, we find that the function of osr1 in post-gastrulation mesoderm differentiation is linked to an early role in regulating mesoderm vs. endoderm differentiation during gastrulation. Our findings reveal a novel role for endoderm in determining the balance of kidney vs. angioblast cell differentiation during somitogenesis.
Materials and Methods
Plasmid Constructs
The zebrafish osr1 gene was identified by tblastn search of zebrafish genomic DNA sequence (Sanger Center zebrafish genome project; http://www.sanger.ac.uk/Projects/D_rerio/) using mouse Osr1 protein sequence as query. Reverse blastx using zebrafish osr1 coding sequence as query against genbank confirmed the zebrafish gene as the closest osr1 ortholog. Full length osr1 was amplified by RTPCR from RNA obtained from 24hpf wild-type Tü/AB embryos and cloned into pCR4 vector. Additional plasmid probes (lim1, pax2a, pax8, nbc1, nephrin, wt1a, ae2, myoD, ret1, scl, gata1, flk1, nkx2.5, etsrp1, pu.1, trpm7) have been previously described. Synthetic capped mRNAs for rescue experiments were synthesized from linearized full-length plasmid constructs using mMessage Machine kit (Ambion©, USA). Specifically, pax2a mRNA and osr1 mRNA was obtained by in vitro transcription with sp6 polymerase from a NotI-linearized and a KpnI-linearized full length construct respectively.
Zebrafish embryos
Wild type zebrafish were maintained according to established protocols (Westerfield, 1995). The embryos for experiments were collected from crosses of wild-type Tü/AB adults, grown at 28°C and fixed at the indicated developmental stages. bonnie and clyde homozygous mutant embryos were obtained from an incross of bonm425/+ heterozygotes .
Morpholino antisense oligonucleotides
Morpholino oligonucleotides were designed to either target the translation start site or the splice donor site of target mRNAs. The following morpholino oligonucleotides were used:
osr1 ex2d (osr1MO): ATCTCATCCTTACCTGTGGTCTCTC
osr1 ATG: GGAGCGTCTTACTACCCATGACTAA
osr1CoMO: AATCAGTACCCATCATTCTGCGAGG
scl ATG: GCTCGGATTTCAGTTTTTCCATCAT (Sumanas and Lin, 2006)
pax2a E2: TATGTGCTTTTTCTTACCTTCCGAG
pax8 E5: TTTCTGCACTCACTGTCATCGTGTC (Hans et al., 2004)
pax8 E9: ACCGGCGGCAGCTCACCTGATACCA (Hans et al., 2004)
sox32 ATG: CAGGGAGCATCCGGTCGAGATACAT (Dickmeis et al., 2001)
Microinjections and molecular analysis
Morpholino oligonucleotides were diluted in 100mM KCl and 10mM HEPES and injections were performed using a nanoliter2000 microinjector (World Precision Instruments, Inc.). Injection concentrations ranged from 0.05mM to 0.2mM and injection volume was set at 4.6 nl/embryo (1.4−7.4ng /embryo). Efficiency of morpholino splicing was confirmed by RTPCR. Total RNA from single embryos at different stages was isolated using Trizol® according to the manufacturer's instructions. RT followed by nested PCR was performed with gene-specific nested forward and reverse primers and purified for sequencing. Full length mRNAs were injected into 1−2 cell embryos and grown at 28°C for further analysis.
Whole-mount in situ hybridization and Immunohistochemistry
Whole-mount in situ hybridization on embryos of different stages was performed using antisense RNA probes labeled with digoxigenin or fluorescein (Boehringer Mannheim, Germany) as described previously (Thisse et al., 2004). Stained embryos were fixed, cleared with Dimethylformamide, transferred into PBS:Glycerol (1:1) and photographed on a Leitz MZ12 or Nikon E800 microscope equipped with Spot Image digital camera. Whole-mount immunohistochemistry for NaK ATPase (alpha6F monoclonal) was performed as described in Drummond et al. (1998). Whole-mount double fluorescent in situ hybridization was performed as described previously (S. Holley, Yale University, CT, personal communication, (Julich et al., 2005; Liu et al., 2007)). Stained embryos were dehydrated in methanol, cleared with 2:1 benzyl benzoate:benzyl alcohol, and examined with a Zeiss LSM5 Pascal-confocal microscope. For sections of in situs, embryos were sectioned in JB-4 to a thickness of 10 μm and examined using a Nikon E800 microscope.
Histochemistry
Embryos for histological analysis were fixed with 4% paraformaldehyde (PFA) in PBS overnight, followed by dehydration and embedding in JB-4 (Polysciences) and sectioned at 5−7 μm. Slides were stained in methylene blue/azure II (Humphrey and Pittman, 1974).
Acridine orange and Tunel staining
Apoptosis in the embryos was assessed by Acridine orange and TUNEL (terminal transferase mediated dUTP nick end-labeling). Live embryos were used for apoptotic cell staining with the vital dye Acridine orange as described (Barrallo-Gimeno et al., 2004). Embryos were incubated in the dark in a 5μg/ml acridine orange solution (diluted from a 5mg/ml stock) for 30 minutes, washed with egg water and analyzed under a fluorescent Nikon E800 microscope. TUNEL staining was performed on embryos fixed with 4% PFA-PBS overnight at 4°C as described (Chi et al., 2003). The fixed embryos were dechorionated, washed and transferred through a graded series of methanol:PBT to 100% methanol. The embryos were rehydrated and permeabilized by proteinase K, re-fixed in 4% PFA-PBS, washed with PBT and incubated in blocking solution (3% H2O2 in methanol) for 1 hour at room temperature. The embryos were then washed in PBT and incubated in permeabilization solution (0.1% TritonX-100 in 0.1% sodium citrate) for 5 minutes on ice. The permeabilized embryos were then incubated for 1−3 hours with terminal transferase (Roche) and fluorescein-labeled ddUTP at 37°C. The embryos were washed with PBT several times, incubated in converter POD for 30 minutes at 37°C and detected using DAB.
Microangiography and vascular cell counts
48 hpf embryos were anaesthetized with Tricaine (16mg/100ml egg water), mounted in 3% methylcellulose and injected with a 5% solution of 2,000,000 Dalton Rhodamine dextran in Hank's buffer into the sinus venosus. After 5 minutes the injected embryos were imaged on a Zeiss LSM5 Pascal confocal microscope. To quantify vascular cell number, nuclei were visualized in 15 μm plastic sections by DAPI staining. Endothelial cell nuclei were identified by tissue morphology using DIC optics to identify the cardinal vein and aorta in trunk cross sections.
Results
osr1 expression during gastrulation and somitogenesis
osr1 is expressed the germ ring at 30% epiboly (Figure1 A; (Tena et al., 2007)) and, at 75% epiboly, in cells dispersed over the yolk in a pattern similar to endoderm progenitors (Kikuchi et al., 2000). Two color in situ hybridization using osr1 and no tail (ntl) probes revealed that osr1 expression is restricted to vegetal tiers of mesendodermal cells closest to the margin and not present in more animal cells that express ntl. osr1 expression overlapped with sox32 expression in the most vegetal tiers of germ ring mesendoderm but not in cells of the Yolk Syncytial Layer (Figure 1 E,F) To discern whether osr1 was expressed in both mesoderm and endoderm progenitors, we used double fluorescent in situ hybridization and confocal microscopy. Double fluorescent in situ with osr1 and ntl probes reveal that osr1 and ntl expression overlapped in a subset of cells at 60% epiboly while other more dispersed cells were positive for osr1 but not ntl (Figure 1, G-I). To determine if these cells were endodermal progenitors we assayed expression of the endodermal markers sox17 and sox32. Double fluorescent in situ revealed that dispersed osr1-expressing cells also expressed sox17 (Figure 1 J-L) and sox32 (Figure 1 M-O). The data indicate that osr1 is expressed in mesendoderm closest to the YSL at 30% epiboly and later, as epiboly progresses, osr1 is expressed in endoderm progenitors as well as mesodermal cells that express ntl.
Figure 1. osr1 expression during early gastrulation.

osr1 expression in the germ ring at 30% epiboly (A) and in the gastrulating cells at 75% epiboly (B). (C) Two color in situ of osr1 (blue) and ntl (red) mRNA transcripts at 30% epiboly. (D) Cross section of (C) at the level indicated shows that osr1 is not expressed in the ntl-positive mesodermal cells farther from the margin (red arrowhead) and restricted to mesendoderm cells closest to the margin (blue arrowhead). (E) Co-localization of osr1 (blue) and sox32 (red) mRNA transcripts at 30% epiboly. (F) Cross section of (E) at the level indicated shows osr1 expression in the mesendoderm cells with some overlap with sox32-positive endodermal cells (blue arrowhead) but absent from the sox32-positive YSL cells (red arrowhead). (G-I) Double fluorescent in situ hybridization of osr1 (red) and ntl (green) probes at 60% epiboly. The images represent a maximum intensity projection of a confocal z-series stack (4 slices, 1.9μm each). (I) merge of (G) and (H) showing distinct expression of osr1 (G) in endoderm cells (red arrowhead, G, I) that do not express ntl (H). osr1 (G) is co-expressed with ntl (H) in mesendoderm cells (green arrowhead, H, I). (J-L) Double fluorescent in situ hybridization of osr1 (red) and sox17 (green) at 60% epiboly. Images represent a single confocal slice of 1.9 μm. (L) merge of (J) and (L) showing co-expression of osr1 and sox17 in endoderm cells. (M-O) Double fluorescent in situ hybridization of osr1 (red) and sox32 (green) at 60% epiboly. Images represent a single confocal slice of 1.9 μm. (O) merge of (M) and (N) showing co-expression of osr1 and sox32 in endoderm cells. Scale bars in I, L, and O = 10μm.
Previous studies reported that zebrafish osr1 was co-expressed with the nephric markers pax2a and lim1 in the intermediate mesoderm during somitogenesis (Tena et al., 2007). To discern the osr1 expression pattern at higher resolution, we assayed its expression relative to known IM/LPM markers using single and two-color in situ hybridization. At the tailbud stage (10 hpf), lim1 is expressed in bilateral stripes of IM adjacent to presomitic mesoderm and in adaxial cells (Figure 2 A,B). In contrast, osr1 was expressed in cells displaced laterally and ventrally from the lim1 expression domain (Figure 2 C,D). During somitogenesis, this pattern persisted and osr1 was detected in bands of cells that superficially appear to be the intermediate mesoderm, however histological sections of 18 hpf embryos show that these osr1 expressing cells lie ventral and lateral to the pronephros and are excluded from the forming pronephros (Figure 2 E, F). This is also clear at 24 hpf (Figure 2 G,H) where sections of the trunk show osr1 expression in ventrolateral tissues, but not in the pronephros. Sections of 18 and 24 hpf embryos also revealed that osr1 was expressed in the endoderm at the midline. Endoderm expression was confirmed by examining older embryos where osr1 was shown to be expressed in the liver and gut at 48 hpf (supplemental Figure S1). Two color in situs revealed that osr1-expressing cells were lateral to pax2a (Figure 2 I,J), scl (Figure 2 L-M) and etsrp1 (Figure 2 O-Q) expressing cells. Sections of embryos double-stained for pax2a and osr1 confirmed that osr1 is expressed ventrally and laterally to the forming kidney (Figure 2 K). We conclude that osr1 is not expressed in the IM during somitogenesis as previously reported. The lateral and ventral position of osr1-positive cells and the early expression osr1 in both mesoderm and endoderm suggests that this tissue is likely to be the zebrafish equivalent of the splanchnopleure (Funayama et al., 1999). In light of previous reports on osr1 function in nephrogenesis and our results that osr1 is not expressed in kidney tissue, we re-examined the osr1 loss of function phenotype.
Figure 2. osr1 expression during zebrafish development.

(A) Cross section of a tailbud stage embryo showing expression of lim1 in cells of the IM (A, inset) adjacent to presomitic mesoderm (arrowhead) and myoD in adaxial cells adjacent to the notochord (nc,). (B) Magnification of A showing proximity of lim1 positive IM to the border of presomitic mesoderm (arrowhead). (C) Cross section of a tailbud stage embryo showing expression of osr1 in bilateral stripes (inset, C) in cells lateral and ventral to the expression of lim1 (C, D) (arrowheads mark the anatomical border of presomitic mesoderm. (E) At 18 somites osr1 is expressed in bilateral stripes just anterior to the somites and in lateral mesoderm of the trunk and tail. (F) Cross section of embryo in (E) at the level indicated by a dotted line in E showing osr1 expression ventral and lateral to the pronephros (dotted circles in F) and endodermal cells (arrowhead, F). (G) osr1 expression at 24 hpf in cells overlying the yolk extension. (H) Cross section of the embryo in (G) at the level indicated shows osr1 expression in the ventrolateral mesoderm distinct from the pronephric ducts (dotted circles) and in endoderm (arrowhead, H). (I-K) Expression of osr1 (blue) and pax2a (red). (J) Magnified views of boxed region in (I) show non-overlapping expression of osr1 (blue arrowhead) and pax2a (red arrowhead) in the intermediate mesoderm. (K) Cross section at the same level shows expression of osr1 (blue arrowhead) in cells ventral and lateral to the cells expressing pax2a (red arrowhead). (L-N) Expression of osr1 (blue) and scl (red) at 12 somites. Magnified views of boxed regions in (L) show non-overlapping expression of osr1 and scl in the posterior (M) and anterior (N) regions of the PLM. (O-Q) Expression of osr1 (blue) and etsrp1 (red) at 12 somites. Magnified views of boxed regions in (O) show non-overlapping expression of osr1 and etsrp1 in the posterior (P, P’) and anterior (Q) regions of the PLM. (P, P’) Magnified view of the boxed region in (O) at different focal planes showing osr1 and etsrp1 positive cells at different dorso-ventral positions with osr1 in more ventral (P) and etsrp1 in the more dorsal cells (P’) with reference to yolk cells.
osr1 is specifically required for proximal pronephric nephron development
Previous studies suggested that osr1 loss of function resulted in the complete absence of kidney tissue and gross edema (Tena et al., 2007). In contrast, we found that osr1 loss of function by morpholino knockdown (Figure 3 A,B) resulted in a segment-specific defect in the proximal nephron while the distal nephron was relatively unaffected (Figure 3 C-F). The chloride-bicarbonate exchanger ae2 is expressed highly in the proximal nephron and at a lower level in the distal nephron at 24 hpf (figure 3C; (Shmukler et al., 2005). In osr1 morphants, ae2 expression is specifically missing in the proximal nephron while expression in the distal nephron is unchanged (Figure 3D; 90% of injected embryos; n=10). Expression of the NaK ATPase alpha subunit marks the full length of the nephron at 72hpf (Drummond et al., 1998) (Figure 3E). In confocal images of osr1 morphants, NaK ATPase-positive tubules were truncated, with proximal tubule segments missing (100% of injected embryos, n=15; Figure 3F). Both NaK ATPase staining and ae2 in situ often revealed an asymmetric loss of the proximal nephron (Figure 3D). In one experiment 9 of 17 embryos showed asymmetric loss of the proximal nephron while the remaining 8 showed a symmetric loss (as shown in Figure 4H). Similar proximal segment-specific loss was observed using in situ probes for lim1, pax8, osr2, and nbc1 (data not shown). Expression of more distal nephron segment markers trpM7 (Elizondo et al., 2005; Liu et al., 2007; Wingert et al., 2007) and ret1 (Bisgrove et al., 1997; Marcos-Gutierrez et al., 1997) were unaffected by osr1 loss of function (supplemental Figure S2). Similar results were obtained with both an osr1 ATG initiation codon blocking morpholino and the exon2 splice donor morpholino; all subsequent experiments were performed with the exon2 donor morpholino since we could more rigorously determine the efficacy of osr1 knockdown using RTPCR. Apoptosis assays also revealed that loss of the proximal nephron was not due to cell death (supplemental Figure S3). These results indicate that kidney defects in osr1 morphants are specific to the proximal nephron and also that osr1 loss of function does not result in a general re-patterning of nephron segments.
Figure 3. osr1 knockdown results in segment-specific kidney defects.

(A) osr1 gene structure and morpholino oligo targeting exon 2 (ex2d). (B) RTPCR analysis of morpholino-induced osr1 mis-splicing. Blocking the exon 2 splice donor sequence resulted in the complete deletion of exon 2, which contains the ATG start codon as well as the entire coding sequence for the osr1 transcriptional regulatory domain and the first zinc finger. In embryos injected with 7.4 ng morpholino, no wild-type mRNA was detectable at 24 hpf, indicating that these morphant embryos were functionally null for osr1. A 5-base pair mismatch control morpholino did not cause any molecular or phenotypic defects. Co-injection of osr1 synthetic mRNA along with the exon 2 donor morpholino rescued the osr1 phenotype in 53% (9/17) of embryos as determined by pax2a expression (see results), demonstrating specificity of the morpholino knockdown. (C) Expression of ae2 in the proximal pronephros (white arrowhead) is absent in osr1 morphants (D) while the distal pronephros is unaffected. Immunofluorescence using anti-NaK ATPase alpha6F monoclonal antibody labels the entire pronephros in wild type embryos (E) while expression is specifically lost in the proximal nephron of osr1 morphants (white arrowhead, F) while the distal pronephros was unaffected (red arrowhead, F) .
Figure 4. osr1 is required for glomerular morphogenesis.

Expression of wt1a in control (A) and osr1 morphants (B) at 26 hpf. Histological cross-sections of the 26 hpf glomerular progenitors in wild-type (C) and osr1 morphants (D) shows equivalent expression of wt1a (arrows). Cross section of wild-type glomerulus at 48hpf (E) shows wt1a expression in the midline vascularized glomerulus (arrow) while in osr1 morphants (F) wt1a-positive podocytes remain in an immature state (arrows) and fail to coalesce to the midline. Expression of the podocyte marker nephrin is lost in osr1 morphants (arrowhead, H) when compared to the control embryos (arrowhead, G). Segment specific loss of ae2 expression in the proximal pronephros is evident in the osr1 morphants (H) when compared to controls (G) at 48 hpf.
osr1 is required for glomerular morphogenesis
To determine whether pronephric glomerular development was affected by osr1 knockdown, we assayed expression of the Wilms tumor suppressor gene, wt1a, a marker of podocyte specification (Bollig et al., 2006; Drummond et al., 1998; Majumdar and Drummond, 1999; Perner et al., 2007; Serluca and Fishman, 2001). In wild-type embryos wt1a is expressed in anterior lateral mesoderm (Serluca and Fishman, 2001) and strongly in prospective pronephric podocytes at 24 hpf (Figure 4 A,C). At 48hpf, wt1a-positive podocytes surround a compact glomerular vascular tuft derived from the aorta (Figure 4E and (Drummond et al., 1998; Majumdar and Drummond, 1999). In osr1 morphants wt1a was expressed at 26 hpf although in a somewhat more dispersed pattern (Figure 4B). Histological sections showed bilateral groups of podocyte progenitors ventral to the somites in all osr1 morphant embryos (Figure 4D). However, these progenitors failed to coalesce into a compact structure at the midline, and a mature, vascularized glomerulus is never formed. nephrin is an essential component of the pronephric glomerulus and is expressed in podocytes in wild-type embryos (Figure 4G; (Kramer-Zucker et al., 2005). osr1 loss of function eliminated nephrin expression in podocytes (91% of injected embryos, n=12; Figure 4H). Similarly, expression of podocin, another podocyte specific marker, was absent from the glomerulus in osr1 morphants (data not shown). The data suggest that osr1 is not required for podocyte specification but rather functions at a later step in glomerular maturation associated with integration of blood vessels with podoctyes and the expression of the podocyte cell adhesion molecules nephrin and podocin.
osr1 loss of function expands the angioblast cell lineage
Since derivatives of the IM/LPM also include the vasculature, blood, and the heart, we analyzed the expression of vascular and blood markers in wild-type and osr1 morphant embryos. The transcription factor scl is expressed in both vascular and hematopoietic progenitor cells (Gering et al., 1998). In zebrafish, scl is first expressed during somitogenesis in cells occupying bilateral stripes in the trunk IM/LPM (Gering et al., 1998) (Figure 5 A,C). Strikingly, the number of scl-expressing cells in the IM/LPM was significantly expanded in osr1 morphants at the 12 somite stage (89% of injected embryos, n=19; arrows, Figure 5 B). This expansion was most obvious in the anterior IM/LPM adjacent to somites 1−8 and to the domain of proximal nephron pax2a expression in wild-type embryos (Figure 5 A). Embryo staging was confirmed by double color in situ with myoD and scl (Supplemental figure S4). Expanded scl expression could also be seen in the posterior IM at 12 somites (Figure 5 D) and was evident in the region of the forming veinous plexus at 26 hpf (100% of injected embryos, n=17; Figure 5 G, H). Since scl-expressing cells could represent progenitors of either vascular or hematopoietic lineages (Gering et al., 1998), we next asked whether a specific lineage was affected by loss of osr1. flk1, the endothelial cell-specific receptor for VEGF is initially expressed in hemangioblasts and subsequently maintained in endothelial cells during vessel formation (Habeck et al., 2002; Liao et al., 1997; Thompson et al., 1998). Similar to scl, flk1 is expressed during early somitogenesis in bilateral stripes of IM/LPM cells (Liao et al., 1997) (Figure 5C) that subsequently contribute to the main trunk vessels (Liao et al., 1997). In 12 somite osr1 morphants, expression of flk1 is significantly upregulated in the anterior trunk, similar to what we observed for scl expression (86% of injected embryos, n=35; arrows, Figure 5D). etsrp1is the earliest expressed transcription factor that controls vascular development without affecting hematopoietic development (Sumanas and Lin, 2006). Similar to scl and flk1, etsrp1is expressed in bilateral stripes in the head and trunk of wild-type embryos during somitogenesis (Sumanas and Lin, 2006) (Figure 5E). In 12 somite osr1 morphants, etsrp1expressing cells are significantly expanded in the anterior trunk IM/LPM (90% of injected embryos, n=11; arrows, Figure 5F).
Figure 5. osr1 knockdown expands vascular progenitor tissue.

(A) scl (blue) and pax2a (red) expression in wild-type embryos labels adjacent bands of intermediate mesoderm in 12 somite stage wild-type embryos. (B) osr1 knockdown results in expansion of scl-positive tissue, most prominently in anterior LPM (black arrowheads) and loss of pax2a expressing cells. (C) flk1 (blue) and scl (red) expression in 12 somite wild-type embryos. (D) osr1 knockdown increases the number of flk1 expressing cells (arrowheads). (E) etsrp1 expression in control 12 somite embryos. (F) etsrp1 expression is expanded in 12 somite stage osr1 morphants (arrowheads). (G) At 26hpf, scl is expressed in the blood islands and forming veinous plexus (arrowhead). (H) 26hpf osr1 morphants show an expansion of scl-positive tissue in the region of the forming veinous plexus (arrowhead). Expression of the monocyte lineage marker pu.1 in wild-type embryos (I) and osr1 morphants (J) shows a reduction of expression in the anterior aspect of its LPM expression domain (arrow). Similarly, expression of the erythrocyte marker gata1 in wild-type embryos (K) and osr1 morphants (L) shows a reduction of expression in its most anterior expression domain (arrow).
The effect of osr1 on hematopoietic lineages was evaluated with the markers pu.1 for the monocytic lineage, (Lieschke et al., 2002) and gata1 for the erythropoietic lineage (Detrich et al., 1995). In wild-type embryos, pu.1-positive myeloid progenitors are expressed in both the rostral blood island and the posterior intermediate mesoderm or caudal blood island (Figure 5I). Contrary to what we observe for scl, flk and etsrp, in osr1 morphants, pu.1 expression was not expanded and in fact showed reduced expression in the anterior IM/LPM (87% of injected embryos, n=16; Figure 5J). We also note that migration of pu.1 expressing ALM macrophages appears advanced compared to controls (Figure 5J). Similarly, gata1 positive erythrocyte progenitors (Figure 4K) were not expanded (arrow, Figure 5L) and in fact were reduced in the anterior IM/LPM (74% of injected embryos, n=35). Analysis of the cardiac specific homeobox gene, nkx2.5 (Chen and Fishman, 1996) showed normal expression in osr1 morphants indicating that osr1 does not affect the specification of cardiac progenitors (data not shown). These results indicate that osr1 is not only required for proximal nephron development but also acts to limit angioblast cell differentiation, most notably in the anterior IM/LPM.
osr1 over-expression expands kidney progenitors at the expense of angioblast cell number
To confirm results on osr1 loss of function, we tested whether osr1 gain of function would have opposite effects on patterning the anterior IM/LPM. By the 13 somite stage, pax2a is normally down-regulated in the mid portion of the IM in wild-type embryos (Figure 6A). Ectopic expression of osr1 by synthetic osr1 mRNA injection at the one-cell stage resulted in enhanced expression of pax2a throughout the IM and specifically prevented the down-regulation of pax2a in the mid portion of the IM (78% of injected embryos, n=32; Figure 6B). In a complementary fashion, scl expression in the anterior LPM (Figure 6C) was specifically lost in osr1 morphants (70% of injected embryos, n=27) (Figure 6D). No ectopic expression of either lineage marker was induced outside of their respective expression domains by osr1 over-expression. The results indicate that over-expression of osr1 is sufficient to re-pattern the anterior IM/LPM, adjacent to somites 1−8.
Figure 6. Overexpression of osr1 causes expansion of pronephric progenitors and a reduction in angioblasts.
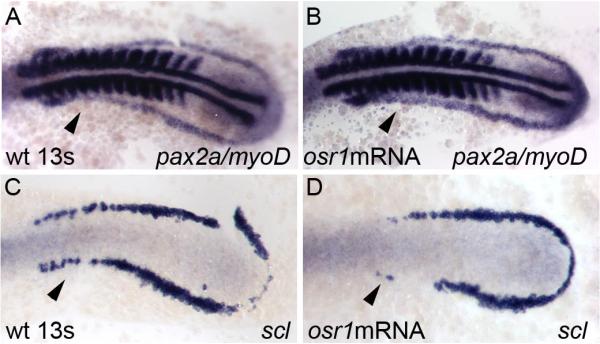
Control (A, C) and embryos injected with 100pg of osr1 mRNA (B, D). (A) Control expression of pax2a is expanded after injection of osr1 mRNA (B), specifically in the mid portion of the IM (arrowhead, B) which is normally downregulated in the control embryos at the 13 somite stage (arrowhead, A). myoD is used as an internal control for somite staging in these embryos (A, B). (C, D) Expression of scl is lost in the anterior lateral plate mesoderm (arrowhead, D) in the embryos injected with osr1 mRNA when compared to the uninjected controls (arrowhead, C).
osr1 is required for pronephric epithelial differentiation and to limit the size of the axial vein
To assess whether a re-specification of mesoderm occurs in osr1 morphants, we sectioned control (Figure 7A) and osr1 morphants (Figure 7B) at 52 hpf, prior to the development of gross edema, to examine the morphology of the glomerulus, pronephric ducts and vasculature. At the level of pectoral fin in control embryos (Figure 7C inset), the glomerulus was visible ventral to the aorta as a compact structure (arrowhead, Figure 7C). However in osr1 morphants, all sectioned embryos lacked a vascularized glomerulus and pronephric tubules at the level of the pectoral fin (Figure 7D, inset; n=4). Instead, all sectioned embryos showed prominent profiles of the cardinal veins (Figure 7D, n=4), which in serial sections, could be distinguished from the pronephros by the presence of red blood cells in the lumen. In more posterior sections of wild-type embryos (Figure 7E) the pronephros was visible as bilateral epithelial tubules (arrowhead Figure 7E) that flank the medial aorta and vein, here filled with nucleated red blood cells. In osr1 morphants, the pronephric tubules in the trunk were present but appeared smaller (arrowhead, Figure 7F) compared to controls. Strikingly, the size of the medial vein was significantly enlarged in osr1 morphants (Figure 7F, v) at all the A-P levels examined (Figure 7D, F; v). To determine whether the increase in vein lumen size was associated with a corresponding increase in vein endothelial cell number and to rule out the possibility that vein expansion was secondary to edema, we counted DAPI stained endothelial cell nuclei in 15 μm sections (from the trunk region as in Figure 7 E,F) of 36 hpf osr1 morphants that showed no pericardial expansion or other evidence of edema. osr1 morphants showed a significant increase in the number of vein endothelial cell nuclei (5.11 +/− 0.19 SEM / section; n=26 vs. 3.04 +/− 0.09 SEM / section; n=25) in control. Arterial size and endothelial cell number was not affected (2.6 +/− 0.1 SEM; n=25 in control vs. 2.8 +/− 0.14 SEM; n=26 in morphants) in osr1 morphants. To further analyse the enlargement of veins in osr1 morphants, we performed microangiography on control and osr1 morphants at 48 hpf. Control embryos and osr1 morphants showed normal circulation in the dorsal aorta and intersomitic vessels. However, the venous plexus region distal to the yolk extension was dramatically expanded in all osr1 morphants examined (Figure 7H, v; n=5) when compared to the control embryos (Figure 7G; v). Taken together, the histology, cell counting, and microangiography data strongly suggest that the veinous cell fate is expanded in osr1 morphants.
Figure 7. Loss of pronephric epithelial differentiation and vascular expansion in osr1 morphants.

Control (A,C,E,G) and osr1 morphants (B,D,F,H) at 52hpf. (A) Wild-type 52hpf embryo showing position of histological sections in C and E. (B) osr1 morphant embryo showing position of histological sections in D and F. (C) Cross section at the level of the fin buds (C; inset) shows normal glomerular structure (arrowhead) and connecting pronephric tubules. (D) Cross section at the level of the fin buds in an osr1 morphant (D; inset) shows absence of pronephric tubules and glomerulus and expansion of cardinal vein (v). (E) In more posterior sections of wild-type embryos, the pronephric epithelial tubules (arrowhead) and cardinal vein (v) are of roughly similar dimensions. In osr1 morphants (F), pronephric tubules are reduced in diameter compared to wild-type (arrowhead) and the cardinal vein (v) is significantly expanded. Angiogram of wild-type embryo trunk and tail region (G) highlights the aorta (a) and the common tail vein (v). Angiogram of an osr1 morphant (H) highlights a grossly expanded veinous plexus in the tail (v). Intersomitic vessels were present in osr1 morphants but are not shown in the confocal sections used in this projection.
osr1 acts upstream of pax2a in kidney development
Pax-2 and Pax-8 are known to function partially redundantly to control kidney development in the mouse (Bouchard et al., 2002). In zebrafish pax2a is specifically required for proximal tubule cell differentiation in the pronephros (Majumdar et al., 2000). We therefore tested whether ectopic expression of pax2a in osr1 morphants would be sufficient to bypass a requirement for osr1 and revert the osr1 morphant phenotype to wild-type patterning of kidney and vascular tissues. We used the expression of ae2 as a measure of the proximal nephron length in control and experimental embryos. The length of ae2-positive proximal tubules in control embryos ranged from 300−500 μm (mean of 378 μm; 14/14, 100%) (Figure 8A,G). In osr1 morphants, ae2 segment length was reduced (Figure 8B) with 42% of embryos (11/26) in the 100−200 μm range and 50% of embryos in the 200−300 μm range and only 8% of the embryos (2/26) exhibiting wild-type segment length (Figure 8G). The overall mean ae2-positive tubule length for osr1 morphants was 214 μm compared with 378 μm for controls. Injection of pax2a mRNA into osr1 morphants restored 60% of the embryos (18/28) to the wild-type proximal tubule length of 300−500 μm (mean of 331 μm) (Figure 8C). In a complementary fashion, pax2a expression reverted the expanded domain of scl expression (compare Figure 8D and 8E) to a wild-type pattern (Figure 8F). The data indicate that in the absence of osr1 function, ectopic expression of pax2a is sufficient to specify proximal pronephric tubule differentiation. In addition, ectopic expression of pax2a is sufficient to limit angioblast differentiation in the intermediate mesoderm.
Figure 8. Ectopic expression of pax2a rescues intermediate mesoderm patterning in osr1 morphants.

Expression of ae2 in the pronephros of 24 hpf control (A), osr1 morphant (B) and osr1 morphant coinjected with pax2a mRNA (C). Horizontal lines denote length of the wild-type, ae2-positive proximal nephron segment. Expression of scl in the anterior lateral mesoderm of 24 hpf control (D), osr1 morphant (E) and osr1 morphant coinjected with pax2a mRNA (F). Horizontal lines denote length of the wild-type, scl-positive anterior lateral mesoderm. (G) Quantification of pax2a rescue of ae2-positive proximal pronephric nephron cells (see text for details).
osr1 effects on mesoderm patterning are mediated by the endoderm
The simplest interpretation of our results so far would be that osr1 functions early in the IM/LPM upstream of pax2a and scl to drive kidney development while repressing angioblast differentiation. However, several inconsistencies with this model were evident in our data. First, our finding that the anterior IM/LPM was preferentially affected in osr1 morphants was not consistent with the broad posterior expression of osr1 in the IM that extended to the tailbud (Figure 2C, inset). We were also surprised to find that the re-patterning of the IM/LPM by osr1 loss of function occurred progressively during somitogenesis and was not evident at the earliest stages of pax2a and scl expression. The early expression pattern of pax2a at the 5 somite stage in osr1 morphants (Figure 9B) was, in fact, similar to the wild-type pattern (Figure 9A). However the anterior IM pax2a expression domain at the 14 somite stage (Figure 9C) was reduced in osr1 morphants (89% of injected embryos, n=37; Figure 9D) and, by 24 hpf, completely absent (96% of injected embryos, n=53) (compare Figure 9E and 9F). Similarly, scl expression was normal at the 8 somite stage in osr1 morphants (Figure 9G, H) and only later, at the 14 somite stage, was found to be expanded in osr1 morphants (89% of injected embryos, n=19) (Figure 9I, J). We could also rule out that the intermediate mesoderm was patterned by an antagonistic relationship between genes downstream of osr1 (pax2a and scl) since loss of function in these genes alone, or in combination with osr1 loss of function did not result in expansion of the opposing lineage (Figure S5). These results, together with our finding that ectopic expression of osr1 only affected cell differentiation within the anterior IM/LPM, suggested that osr1 might act indirectly to pattern the mesoderm.
Figure 9. osr1 knockdown does not affect specification of pronephric and angioblast mesoderm but their subsequent maintenance.

Expression of pax2a and myoD in control (A) and osr1 morphants (B) is similar at 5 somites (arrowheads in A and B). myoD is used as a internal somite staging control. Expression of pax2a in 14 somite control (C) and osr1 morphants (D) reveals a substantial reduction in pax2a positive cells in the anterior IM (arrowheads, C, D). Expression of pax2a in 24 hpf control (E) and osr1 morphants (F) shows a complete loss of pax2a positive cells in the proximal pronephros (arrowheads, E, F). Expression of scl in osr1 morphants (H) is similar to that of control embryos at 8 somites (G). However, by the 14 somite stage, the number of scl-expressing cells is significantly upregulated in the anterior lateral plate mesoderm of osr1 morphants (arrowhead, J) when compared to control embryos at the same stage (arrowhead, I).
In addition to its expression in the IM/LPM, osr1 is expressed in the germ ring mesendoderm at the shield stage (Figure 1 and (Tena et al., 2007)). We examined whether osr1 might function in mesendoderm patterning by assessing expression of the endoderm specific markers, foxa2 and sox17. Strikingly, we found that endoderm differentiation was strongly enhanced in osr1 morphants. The number of sox17-positive cells at the shield stage (Figure 10 A-C) was significantly increased in osr1 morphants (100% of injected embryos, n=14; Figure 10 D-F). Similarly, the number of foxa2-positive cells (Figure 10 G-I) was increased in osr1 morphants (71% of injected embryos, n=21; Figure 10 J-L). Intensified expression of foxa2 at the 18 somite stage (86% of injected embryos, n=15; Figure 10 M,N) confirmed that development of the pharyngeal endoderm was enhanced by osr1 loss of function. sox32/casanova is a transcription factor that is required for all endodermal development (Alexander et al., 1999). As previously reported (Dickmeis et al., 2001), knockdown of sox32 using an antisense morpholino (Dickmeis et al., 2001) specifically eliminated foxa2-expressing endoderm (93% of injected embryos, n=15) but did not affect foxa2 expression in axial mesoderm (Figure 10 O).
Figure 10. osr1 knockdown causes expansion of endoderm.

(A-F) Expression of endoderm marker, sox17 in control (A-C) and osr1 morphants (D-F) at the shield stage. (A, D) dorsal views; (B, E) side views with dorsal facing; (C) and (F) are magnified views of boxed regions in (B) and (E) respectively. The number of tiers of sox17-expressing cells was significantly increased in osr1 morphants at the blastoderm margin (C, bar, E) and in the ventral region of the embryo (arrowhead, D) when compared to control (A, C and bar, B). (G-L) Expression of mesendoderm marker, foxa2 in control (G-I) and osr1 morphants (J-L) at the shield stage. (G, J) dorsal views; (H, K) side views with dorsal facing; (I) and (L) are magnified views of boxed regions in (H) and (K) respectively. The number of tiers of foxa2-expressing cells were significantly increased in osr1 morphants with more layers of foxa2-expressing cells at the blastoderm margin (L, bar, K) and enhanced expression in the ventral region of the embryo (arrowhead, J) when compared to control (G, I and bar, H). (M-O). Expression of foxa2 at 18 somites in controls (M), osr1 morphants (N) and sox32 (cas) morphants (O). Development of foxa2-positive pharyngeal endoderm was enhanced in osr1 morphants (arrowheads, N) when compared to control embryos (arrowheads, M) and was completely blocked by sox32 knockdown (arrowheads, O).
The ability to block endoderm development by sox32/casanova knockdown allowed us to test whether expanded endoderm development was responsible for re-patterning the mesoderm in the context of osr1 loss of function. As expected, knockdown of osr1 alone resulted in a reduction in pax2a-positive cells (90% of injected embryos, n=43; Figure 11B) compared to control (Figure 11A) at 18 somites. Knockdown of sox32 alone did not have noticeable effects on pax2a expression (98% of injected embryos, n=30; Figure 11C). Remarkably, knockdown of sox32 and elimination of endoderm development in osr1 morphants restored pax2a expression to a normal wild-type pattern (74% of injected embryos, n=66). To confirm these results we tested whether reduction in endoderm development in the mutant bonnie and clyde/mixer (bon) would rescue the osr1 loss of function phenotype. All embryos in an incross of bon heterozygotes showed a normal pattern of pax2a expression (Figure 11E). Knockdown of osr1 in embryos of an incross of bon heterozygotes resulted in the expected osr1 phenotype in roughly three quarters of the embryos (73%; Figure 11F) while the remaining quarter (27%) of the clutch showed a normal, rescued pattern of pax2a expression (Figure 11G). Rescue of pax2a expression by sox32 knockdown and the Mendelian ratio of pax2a rescued embryos in a bon +/− incross indicate that re-patterning of kidney vs. vasculature in osr1 morphants can be accounted for by expanded development of endoderm. A primary function of osr1 may therefore be to pattern the mesendoderm during gastrulation.
Figure 11. Elimination of endoderm development in osr1 morphants rescues proximal pronephric phenotype.

Expression of pax2a in control (A), osr1 morphant (B), sox32 morphant (C) and osr1+sox32 double morphants (D). Loss of osr1 resulted in loss of proximal pax2a pronephric expression (arrowhead, B) when compared to control 18 somite stage embryos (arrowhead, A). sox32(cas) morphants lacking endoderm showed slightly enhanced expression of pax2a in the proximal nephron (arrowhead, C). The loss of pax2a expression in the proximal pronephros of osr1 morphants was rescued by elimination of endoderm in the osr1+ sox32 double morphants (arrowhead, D). Expression of pax2a in uninjected bon heterozygote incross embryos (E) and osr1 morpholino injected bon incross embryos (F, G) at 24hpf. pax2a expression was lost from the proximal pronephros in 47 out of 64 of the injected embryos (73%) (F). Loss of pax2a expression from the proximal pronephros was rescued in 17 out of 64 (27%) osr1 MO injected, bon heterozygote incross embryos.
Discussion
The derivation of kidney and blood/vasculature from adjacent areas of mesoderm in developmental fate maps and the continued close association of progenitor cells during organogenesis (Crosier et al., 2002; Davidson and Zon, 2004; Fujimoto et al., 2001; Iraha et al., 2002; Kimelman, 2006; Kimelman and Griffin, 2000; Kimmel et al., 1990; Lane and Sheets, 2006; Vogeli et al., 2006; Walmsley et al., 2002) prompted us to examine whether genes acting during early development might affect the fate of both tissues. Osr1 has been reported to be expressed in the intermediate mesoderm and required for mouse and zebrafish kidney development (James et al., 2006; So and Danielian, 1999; Wang et al., 2005). Our data indicate that osr1 is not simply required for kidney development but rather it acts early in development to pattern the mesendoderm which, in turn, has broader effects on development. Our results also show that in zebrafish, osr1 is not expressed in typical intermediate mesoderm but rather in more lateral and ventral cells that may represent the zebrafish splanchnopleure (Funayama et al., 1999). We find that osr1 expression in lateral cells (splanchnopleure) is not required for normal expression of pax2a since combined sox32/osr1 loss of function results in normal pax2a expression. Unexpectedly, the primary mechanism underlying osr1 loss of function phenotypes appears to be an increase in endoderm development which later acts to inhibit kidney and favor vascular cell differentiation in mesoderm.
A role for osr1 in mesendoderm patterning
Mesoderm and endoderm are derived from a mixed population of cells, the mesendoderm, that constitutes the germ ring in zebrafish embryos. Our results suggest that expression of osr1 in the germ ring plays an important role in mesendoderm patterning by acting as a repressor of endoderm formation. Both endoderm and mesoderm are induced by the Nodal related factors cyclops and squint in zebrafish (Schier and Talbot, 2005). High levels of Nodal signals induce endoderm in the most marginal blastomeres while in cells closer to the animal pole, induction of Tbox factors and FGF promote mesoderm development and antagonize endoderm development (Schier and Talbot, 2005). Ventral expression of BMPs has also been shown to antagonize endoderm development (Poulain et al., 2006). osr1 expression is known to respond to BMP signaling in chick embryo mesoderm (James and Schultheiss, 2005) and we have confirmed that early expression of osr1 in zebrafish requires the activity of a functional bmp2b gene (data not shown). One model of osr1 activity would be that after induction by bmp2b signaling, osr1 acts as a transcriptional repressor in mesendoderm cells (Tena et al., 2007), antagonizing transcriptional responses downstream of Nodal signaling (Schier and Talbot, 2005). However, the expression pattern of osr1 throughout the germ ring suggests that, in addition to BMP signaling, osr1 might also be responsive to FGF or nodal signaling (Rodaway et al., 1999). Further experiments examining signals upstream of osr1 expression will be required to better define osr1 function in the context of mesendoderm patterning.
Does altered mesendoderm patterning account for osr1 phenotypes?
In mouse embryos, disruption of the Osr1 gene causes severe defects in urogenital development (Wang et al., 2005). Mutant mice show no evidence of ureteric bud or metanephric kidney development and cellular defects in the Wolffian duct are evident at a very early stage (E8.5) (James et al., 2006; Wang et al., 2005). The nephrogenic mesenchyme shows reduced expression of Wt1 (Wang et al., 2005) and also fails to express many other genes that define this tissue (James et al., 2006). The absence of properly specified nephrogenic mesenchyme in the mouse Osr1 mutants taken together with our results in the zebrafish raise the possibility that Osr1 in the mouse may play additional roles outside of the nephrogenic mesoderm to ensure proper patterning of the intermediate mesoderm. Although Osr1 expression in endoderm has not been detected in the mouse by in situ hybridization, recent analysis of a mouse Osr1 (Osr1) bac transgenic shows that the Osr1 gene contains regulatory elements that drive reporter expression (Cre) in endodermal organs (Grieshammer et al., 2008). While suggestive of a function for osr1 in endoderm, further experiments will be required to critically assess this possibility.
Our results differ from a previous study of osr1 expression and function in zebrafish kidney development (Tena et al., 2007) where it was concluded that “knockdown of osr1 and osr2 results in the loss of all pronephric structures including the glomerulus”. We find that osr1 morphant kidney defects are restricted to the proximal nephron, and that glomerular morphogenesis is arrested in a stage-specific fashion, subsequent to podocyte wt1a expression. Our results are not due to a partial osr1 loss of function since we demonstrate that no wild-type osr1 mRNA can be detected by RTPCR in osr1 morphants at 24 hpf. These discrepancies are most likely due to the fact that Tena et al. did not examine osr1 morphants with markers of the distal pronephros or the specification of glomerular podocytes by wt1a expression. Also, in contrast to Tena et al., we show that zebrafish osr1 is not expressed in pax2a-positive pronephric kidney cells during somitogenesis, nor in mature glomeruli. We observe osr1 expression in cells adjacent to the forming pronephros at the 18 somite stage which could have been easily mis-identified as the pronephros by Tena et al. Also, we observe strong osr1 expression in the liver, next to the glomerulus, at 48 hpf which at low magnification may have been mistaken for glomerular expression in Tena et al. Our results agree with expression studies in the chick which show that Osr1 is not expressed in differentiated kidney cells. Ectopic expression studies in the chick also support the idea that osr1 expression may actually impede kidney epithelial differentiation (James et al., 2006).
Given the previous work on osr1 and its broad early expression in the intermediate mesoderm, the segment-specific loss of kidney tissue and the selective expansion of vascular tissue in the anterior trunk of osr1 morphants that we observed was unexpected. Also, the fact that patterning defects in pax2a-positive kidney progenitors and scl-positive angioblasts were observed relatively late in development, during somitogenesis, argues that osr1 plays a role in maintenance, but not specification of mesodermal lineages. The simplest interpretation of our results is that signals that repress kidney and enhance angioblast development emanate from anterior endoderm and thus most strongly affect the anterior intermediate/lateral plate mesoderm. A central role for endoderm in the context of osr1 loss of function may also help explain other phenotypes of osr1 mutants/morphants. Both mouse and zebrafish embryos lacking osr1 often show asymmetric loss of the Wolffian duct/pronephric duct on the left side (Wang et al., 2005) and our results) which has been interpreted to suggest the existence of a latent left-right asymmetry in the normally bilaterally symmetric kidney. Our results raise the alternate possibility that asymmetric loss of kidney tissue could be due to underlying asymmetries in endodermal tissues that negatively affect Wolffian/pronephric duct formation. Asymmetric defects in Wolffian duct development have also been reported in Gata3 knockout mice (Grote et al., 2006), which might be due to cell-autonomous effects of Gata3 loss of function in the Wolffian ducts. Interestingly however, Gata3 is also expressed in endodermal tissues (Caprioli et al., 2001; Debacker et al., 1999) which may indirectly affect kidney development.
While we observed an increase in vascular tissue in osr1 morphants, we did not observe a corresponding increase in blood cell development. This could be due to the fact that the most strongly affected tissue in osr1 morphants, the anterior intermediate mesoderm, is known to be enriched for flk-and scl-positive angioblasts in zebrafish, while more posterior mesoderm contains both angioblasts and hematopoietic precursors expressing gata1 (Dooley et al., 2005). Alternatively, signals from expanded endoderm in osr1 morphants may selectively favor angioblast development over erythropoiesis.
The role of the endoderm in mesodermal organogenesis
Our findings suggest that the effects of osr1 loss of function on kidney and vascular patterning are mediated by signals from the endoderm. The endoderm is known to regulate the development of other mesodermal derivatives such as the heart (Alexander et al., 1999; Dickmeis et al., 2001; Kikuchi et al., 2000; Reiter et al., 1999). In chick and frog, the anterior endoderm induces cardiogenesis by secreting a combination of BMPs and soluble inhibitors of Wnt signaling such as Cresent and Dkk-1 (Marvin et al., 2001; Schneider and Mercola, 2001). In addition to its potential role as an inducer of heart tissue, endoderm provides a matrix upon which cardiac progenitors and angioblasts migrate to form a fused heart tube (Jin et al., 2005; Trinh and Stainier, 2004). Interestingly, lack of endoderm in the one eyed pinhead zebrafish mutant has been associated with a specific loss of vein but not aorta development (Brown et al., 2000) which would be consistent with our results that an early expansion of endoderm expands vein but not aorta development. In the chick and mouse, sonic hedgehog signaling from endoderm is important for vasculogenesis (Vokes et al., 2004), however this is apparently not essential in zebrafish (Jin et al., 2005). A candidate signal for the effect of endoderm on kidney development might be sonic hedgehog since it is expressed in the endoderm and when expressed ectopically, hedgehog proteins can inhibit nephrogenesis (Urban et al., 2006). However we found that cyclopamine treatment did not reverse the effects of osr1 knockdown on kidney cell differentiation (Y.Liu and I. Drummond; data not shown), making it unlikely that hedgehog is the endoderm-derived signal. Thus, while these studies demonstrate that the endoderm is a rich source of soluble signaling molecules, it remains to be seen whether endoderm-derived soluble factors pattern kidney tissue in the IM.
In summary, our studies have uncovered a new role for osr1 in patterning mesendoderm. osr1 acts to inhibit endoderm differentiation during gastrulation. Our work has also uncovered a previously unknown role for endoderm in maintaining cell fate decisions in the intermediate mesoderm. Enhanced endoderm development favors the angioblast over kidney cell fate; presumably by non-cell autonomous signals. Further identification of osr1 primary target genes and the signals emanating from endoderm are likely to reveal important aspects of kidney and vascular progenitor cell differentiation.
Supplementary Material
Supplemental figures
Figure S1. osr1 expression in endodermal organs at 48 hpf. (A) Expression of osr1 mRNA in whole mount at 48 hpf, dorsal view. Lines represent plane of section in B and C. (B) Histological section just anterior to the fin bud shows osr1 expression in the forming liver (li). Arrowhead denotes the forming glomerulus, which is negative for osr1. (C) Histological section at the level of the fin shows osr1 expression in the gut (g).
Figure S2. osr1 loss of function does not cause general A-P patterning defects in the pronephros. Expression of trpM7 in control (A) and osr1 morphants (B) is restricted to the late proximal pronephric nephron segment. ret1 expression in control (C) and osr1 morphants (D) is unchanged in the most distal pronephric nephron segment.
Figure S3. osr1 loss of function does not affect mesoderm survival. Acridine orange staining for apoptotic cells in control (A) and osr1 morphant (B) 18 somite embryos. Arrowheads denote area affected in osr1 morphants. Tunel staining of control (C) and osr1 morphant (D) 18 somite embryos show unchanged patterns of apoptosis. Arrowheads point to the area anterior intermediate mesoderm most strongly affected in osr1 morphants.
Figure S4. Expanded vascular differentiation is not due to an altered rate of development. (A) scl (blue) and myoD (red) expression in wild-type embryos at the 12 somite stage. (B) osr1 knockdown results in expansion of scl-positive tissue, most prominently in anterior PLM. myoD is used as an internal staging control and demonstrates both control and osr1 morphants are at the 12 somite stage. (C) scl (blue) and pax2a (red) expression in wild-type embryos from the same clutch of embryos as A and B. (D) osr1 knockdown results in expansion of scl-positive tissue, most prominently in anterior PLM and loss of pax2a expressing cells. (C, D) are lower magnification views of panels (A) and (B) in Figure 5 respectively.
Figure S5. Intermediate mesoderm patterning in pax2/8 and scl morphants. Expression of scl (blue) and myoD (red) in control (A), and pax2a/pax8 double morphant (B) demonstrates that loss of pax gene expression does not cause scl upregulation. Arrowheads mark the area of strongest upregulation of scl seen in osr1 morphants. Expression of pax2a in control (C), scl morphant (D) similarly shows no large expansion of pax2a expression. Expression of pax2a in osr1 morphant (E) and osr1/scl double morphant (F) shows no rescue of pax2a expression. Arrowheads in C-F mark the proximal nephron segment lost in osr1 morphants. The data indicate that pax genes and scl are not involved in a mutual repression mechanism.
Acknowledgements
We thank personnel in the Fish facility at MGH for help with fish husbandry, Dr Alan Davidson for the swirl mutant and for comments on this work, Dr. Jing Wei Xiong for bonnie and clyde mutants and blood/vascular lineage markers, Randy Peterson and Chetana Sachidanandan for endoderm markers, Sasha Petrova for editing this manuscript, and Dr. Tom Schultheiss for critical review of the data. This work was funded by a National Institute of Health grant (DK071041) to I.A.D. and a postdoctoral fellowship from American Heart Association (0625923T) to S.P.M.
References
- Alexander J, Rothenberg M, Henry GL, Stainier DY. casanova plays an early and essential role in endoderm formation in zebrafish. Dev Biol. 1999;215:343–57. doi: 10.1006/dbio.1999.9441. [DOI] [PubMed] [Google Scholar]
- Barrallo-Gimeno A, Holzschuh J, Driever W, Knapik EW. Neural crest survival and differentiation in zebrafish depends on mont blanc/tfap2a gene function. Development. 2004;131:1463–77. doi: 10.1242/dev.01033. [DOI] [PubMed] [Google Scholar]
- Bisgrove BW, Raible DW, Walter V, Eisen JS, Grunwald DJ. Expression of c-ret in the zebrafish embryo: potential roles in motoneuronal development. J Neurobiol. 1997;33:749–68. [PubMed] [Google Scholar]
- Bollig F, Mehringer R, Perner B, Hartung C, Schafer M, Schartl M, Volff JN, Winkler C, Englert C. Identification and comparative expression analysis of a second wt1 gene in zebrafish. Dev Dyn. 2006;235:554–61. doi: 10.1002/dvdy.20645. [DOI] [PubMed] [Google Scholar]
- Bouchard M, Souabni A, Mandler M, Neubuser A, Busslinger M. Nephric lineage specification by Pax2 and Pax8. Genes Dev. 2002;16:2958–70. doi: 10.1101/gad.240102. [DOI] [PMC free article] [PubMed] [Google Scholar]
- Brown LA, Rodaway AR, Schilling TF, Jowett T, Ingham PW, Patient RK, Sharrocks AD. Insights into early vasculogenesis revealed by expression of the ETS-domain transcription factor Fli-1 in wild-type and mutant zebrafish embryos. Mech Dev. 2000;90:237–52. doi: 10.1016/s0925-4773(99)00256-7. [DOI] [PubMed] [Google Scholar]
- Caprioli A, Minko K, Drevon C, Eichmann A, Dieterlen-Lievre F, Jaffredo T. Hemangioblast commitment in the avian allantois: cellular and molecular aspects. Dev Biol. 2001;238:64–78. doi: 10.1006/dbio.2001.0362. [DOI] [PubMed] [Google Scholar]
- Chen JN, Fishman MC. Zebrafish tinman homolog demarcates the heart field and initiates myocardial differentiation. Development. 1996;122:3809–16. doi: 10.1242/dev.122.12.3809. [DOI] [PubMed] [Google Scholar]
- Chi CL, Martinez S, Wurst W, Martin GR. The isthmic organizer signal FGF8 is required for cell survival in the prospective midbrain and cerebellum. Development. 2003;130:2633–44. doi: 10.1242/dev.00487. [DOI] [PubMed] [Google Scholar]
- Crosier PS, Kalev-Zylinska ML, Hall CJ, Flores MV, Horsfield JA, Crosier KE. Pathways in blood and vessel development revealed through zebrafish genetics. Int J Dev Biol. 2002;46:493–502. [PubMed] [Google Scholar]
- Davidson AJ, Zon LI. The ‘definitive’ (and ‘primitive’) guide to zebrafish hematopoiesis. Oncogene. 2004;23:7233–46. doi: 10.1038/sj.onc.1207943. [DOI] [PubMed] [Google Scholar]
- Debacker C, Catala M, Labastie MC. Embryonic expression of the human GATA-3 gene. Mech Dev. 1999;85:183–7. doi: 10.1016/s0925-4773(99)00088-x. [DOI] [PubMed] [Google Scholar]
- Detrich HW, 3rd, Kieran MW, Chan FY, Barone LM, Yee K, Rundstadler JA, Pratt S, Ransom D, Zon LI. Intraembryonic hematopoietic cell migration during vertebrate development. Proc Natl Acad Sci U S A. 1995;92:10713–7. doi: 10.1073/pnas.92.23.10713. [DOI] [PMC free article] [PubMed] [Google Scholar]
- Dick A, Hild M, Bauer H, Imai Y, Maifeld H, Schier AF, Talbot WS, Bouwmeester T, Hammerschmidt M. Essential role of Bmp7 (snailhouse) and its prodomain in dorsoventral patterning of the zebrafish embryo. Development. 2000;127:343–54. doi: 10.1242/dev.127.2.343. [DOI] [PubMed] [Google Scholar]
- Dickmeis T, Mourrain P, Saint-Etienne L, Fischer N, Aanstad P, Clark M, Strahle U, Rosa F. A crucial component of the endoderm formation pathway, CASANOVA, is encoded by a novel sox-related gene. Genes Dev. 2001;15:1487–92. doi: 10.1101/gad.196901. [DOI] [PMC free article] [PubMed] [Google Scholar]
- Dooley KA, Davidson AJ, Zon LI. Zebrafish scl functions independently in hematopoietic and endothelial development. Dev Biol. 2005;277:522–36. doi: 10.1016/j.ydbio.2004.09.004. [DOI] [PubMed] [Google Scholar]
- Drummond IA, Majumdar A, Hentschel H, Elger M, Solnica-Krezel L, Schier AF, Neuhauss SC, Stemple DL, Zwartkruis F, Rangini Z, et al. Early development of the zebrafish pronephros and analysis of mutations affecting pronephric function. Development. 1998;125:4655–67. doi: 10.1242/dev.125.23.4655. [DOI] [PubMed] [Google Scholar]
- Elizondo MR, Arduini BL, Paulsen J, MacDonald EL, Sabel JL, Henion PD, Cornell RA, Parichy DM. Defective skeletogenesis with kidney stone formation in dwarf zebrafish mutant for trpm7. Curr Biol. 2005;15:667–71. doi: 10.1016/j.cub.2005.02.050. [DOI] [PubMed] [Google Scholar]
- Fujimoto T, Ogawa M, Minegishi N, Yoshida H, Yokomizo T, Yamamoto M, Nishikawa S. Step-wise divergence of primitive and definitive haematopoietic and endothelial cell lineages during embryonic stem cell differentiation. Genes Cells. 2001;6:1113–27. doi: 10.1046/j.1365-2443.2001.00490.x. [DOI] [PubMed] [Google Scholar]
- Funayama N, Sato Y, Matsumoto K, Ogura T, Takahashi Y. Coelom formation: binary decision of the lateral plate mesoderm is controlled by the ectoderm. Development. 1999;126:4129–38. doi: 10.1242/dev.126.18.4129. [DOI] [PubMed] [Google Scholar]
- Gering M, Rodaway AR, Gottgens B, Patient RK, Green AR. The SCL gene specifies haemangioblast development from early mesoderm. Embo J. 1998;17:4029–45. doi: 10.1093/emboj/17.14.4029. [DOI] [PMC free article] [PubMed] [Google Scholar]
- Gering M, Yamada Y, Rabbitts TH, Patient RK. Lmo2 and Scl/Tal1 convert non-axial mesoderm into haemangioblasts which differentiate into endothelial cells in the absence of Gata1. Development. 2003;130:6187–99. doi: 10.1242/dev.00875. [DOI] [PubMed] [Google Scholar]
- Grieshammer U, Agarwal P, Martin GR. A Cre transgene active in developing endodermal organs, heart, limb, and extra-ocular muscle. Genesis. 2008;46:69–73. doi: 10.1002/dvg.20366. [DOI] [PubMed] [Google Scholar]
- Grote D, Souabni A, Busslinger M, Bouchard M. Pax 2/8-regulated Gata 3 expression is necessary for morphogenesis and guidance of the nephric duct in the developing kidney. Development. 2006;133:53–61. doi: 10.1242/dev.02184. [DOI] [PubMed] [Google Scholar]
- Gupta S, Zhu H, Zon LI, Evans T. BMP signaling restricts hematovascular development from lateral mesoderm during somitogenesis. Development. 2006;133:2177–87. doi: 10.1242/dev.02386. [DOI] [PubMed] [Google Scholar]
- Habeck H, Odenthal J, Walderich B, Maischein H, Schulte-Merker S. Analysis of a zebrafish VEGF receptor mutant reveals specific disruption of angiogenesis. Curr Biol. 2002;12:1405–12. doi: 10.1016/s0960-9822(02)01044-8. [DOI] [PubMed] [Google Scholar]
- Hammerschmidt M, Pelegri F, Mullins MC, Kane DA, van Eeden FJ, Granato M, Brand M, Furutani-Seiki M, Haffter P, Heisenberg CP, et al. dino and mercedes, two genes regulating dorsal development in the zebrafish embryo. Development. 1996;123:95–102. doi: 10.1242/dev.123.1.95. [DOI] [PubMed] [Google Scholar]
- Hans S, Liu D, Westerfield M. Pax8 and Pax2a function synergistically in otic specification, downstream of the Foxi1 and Dlx3b transcription factors. Development. 2004;131:5091–102. doi: 10.1242/dev.01346. [DOI] [PubMed] [Google Scholar]
- Hild M, Dick A, Rauch GJ, Meier A, Bouwmeester T, Haffter P, Hammerschmidt M. The smad5 mutation somitabun blocks Bmp2b signaling during early dorsoventral patterning of the zebrafish embryo. Development. 1999;126:2149–59. doi: 10.1242/dev.126.10.2149. [DOI] [PubMed] [Google Scholar]
- Humphrey CD, Pittman FE. A simple methylene blue-azure II-basic fuchsin stain for epoxy-embedded tissue sections. Stain Technol. 1974;49:9–14. doi: 10.3109/10520297409116929. [DOI] [PubMed] [Google Scholar]
- Iraha F, Saito Y, Yoshida K, Kawakami M, Izutsu Y, Daar IO, Maeno M. Common and distinct signals specify the distribution of blood and vascular cell lineages in Xenopus laevis embryos. Dev Growth Differ. 2002;44:395–407. doi: 10.1046/j.1440-169x.2002.00653.x. [DOI] [PubMed] [Google Scholar]
- James RG, Kamei CN, Wang Q, Jiang R, Schultheiss TM. Odd-skipped related 1 is required for development of the metanephric kidney and regulates formation and differentiation of kidney precursor cells. Development. 2006;133:2995–3004. doi: 10.1242/dev.02442. [DOI] [PubMed] [Google Scholar]
- James RG, Schultheiss TM. Bmp signaling promotes intermediate mesoderm gene expression in a dose-dependent, cell-autonomous and translation-dependent manner. Dev Biol. 2005;288:113–25. doi: 10.1016/j.ydbio.2005.09.025. [DOI] [PubMed] [Google Scholar]
- Jin SW, Beis D, Mitchell T, Chen JN, Stainier DY. Cellular and molecular analyses of vascular tube and lumen formation in zebrafish. Development. 2005;132:5199–209. doi: 10.1242/dev.02087. [DOI] [PubMed] [Google Scholar]
- Julich D, Hwee Lim C, Round J, Nicolaije C, Schroeder J, Davies A, Geisler R, Lewis J, Jiang YJ, Holley SA. beamter/deltaC and the role of Notch ligands in the zebrafish somite segmentation, hindbrain neurogenesis and hypochord differentiation. Dev Biol. 2005;286:391–404. doi: 10.1016/j.ydbio.2005.06.040. [DOI] [PubMed] [Google Scholar]
- Kikuchi Y, Trinh LA, Reiter JF, Alexander J, Yelon D, Stainier DY. The zebrafish bonnie and clyde gene encodes a Mix family homeodomain protein that regulates the generation of endodermal precursors. Genes Dev. 2000;14:1279–89. [PMC free article] [PubMed] [Google Scholar]
- Kimelman D. Mesoderm induction: from caps to chips. Nat Rev Genet. 2006;7:360–72. doi: 10.1038/nrg1837. [DOI] [PubMed] [Google Scholar]
- Kimelman D, Griffin KJ. Vertebrate mesendoderm induction and patterning. Curr Opin Genet Dev. 2000;10:350–6. doi: 10.1016/s0959-437x(00)00095-2. [DOI] [PubMed] [Google Scholar]
- Kimmel CB, Warga RM, Schilling TF. Origin and organization of the zebrafish fate map. Development. 1990;108:581–94. doi: 10.1242/dev.108.4.581. [DOI] [PubMed] [Google Scholar]
- Kishimoto Y, Lee KH, Zon L, Hammerschmidt M, Schulte-Merker S. The molecular nature of zebrafish swirl: BMP2 function is essential during early dorsoventral patterning. Development. 1997;124:4457–66. doi: 10.1242/dev.124.22.4457. [DOI] [PubMed] [Google Scholar]
- Kramer-Zucker AG, Wiessner S, Jensen AM, Drummond IA. Organization of the pronephric filtration apparatus in zebrafish requires Nephrin, Podocin and the FERM domain protein Mosaic eyes. Dev Biol. 2005;285:316–29. doi: 10.1016/j.ydbio.2005.06.038. [DOI] [PMC free article] [PubMed] [Google Scholar]
- Krauss S, Johansen T, Korzh V, Fjose A. Expression of the zebrafish paired box gene pax[zf-b] during early neurogenesis. Development. 1991;113:1193–206. doi: 10.1242/dev.113.4.1193. [DOI] [PubMed] [Google Scholar]
- Lane MC, Sheets MD. Heading in a new direction: implications of the revised fate map for understanding Xenopus laevis development. Dev Biol. 2006;296:12–28. doi: 10.1016/j.ydbio.2006.04.447. [DOI] [PubMed] [Google Scholar]
- Leung AY, Mendenhall EM, Kwan TT, Liang R, Eckfeldt C, Chen E, Hammerschmidt M, Grindley S, Ekker SC, Verfaillie CM. Characterization of expanded intermediate cell mass in zebrafish chordin morphant embryos. Dev Biol. 2005;277:235–54. doi: 10.1016/j.ydbio.2004.09.032. [DOI] [PubMed] [Google Scholar]
- Liao W, Bisgrove BW, Sawyer H, Hug B, Bell B, Peters K, Grunwald DJ, Stainier DY. The zebrafish gene cloche acts upstream of a flk-1 homologue to regulate endothelial cell differentiation. Development. 1997;124:381–9. doi: 10.1242/dev.124.2.381. [DOI] [PubMed] [Google Scholar]
- Lieschke GJ, Oates AC, Paw BH, Thompson MA, Hall NE, Ward AC, Ho RK, Zon LI, Layton JE. Zebrafish SPI-1 (PU.1) marks a site of myeloid development independent of primitive erythropoiesis: implications for axial patterning. Dev Biol. 2002;246:274–95. doi: 10.1006/dbio.2002.0657. [DOI] [PubMed] [Google Scholar]
- Liu Y, Pathak N, Kramer-Zucker A, Drummond IA. Notch signaling controls the differentiation of transporting epithelia and multiciliated cells in the zebrafish pronephros. Development. 2007;134:1111–22. doi: 10.1242/dev.02806. [DOI] [PubMed] [Google Scholar]
- Majumdar A, Drummond IA. Podocyte differentiation in the absence of endothelial cells as revealed in the zebrafish avascular mutant, cloche. Dev Genet. 1999;24:220–9. doi: 10.1002/(SICI)1520-6408(1999)24:3/4<220::AID-DVG5>3.0.CO;2-1. [DOI] [PubMed] [Google Scholar]
- Majumdar A, Lun K, Brand M, Drummond IA. Zebrafish no isthmus reveals a role for pax2.1 in tubule differentiation and patterning events in the pronephric primordia. Development. 2000;127:2089–98. doi: 10.1242/dev.127.10.2089. [DOI] [PubMed] [Google Scholar]
- Marcos-Gutierrez CV, Wilson SW, Holder N, Pachnis V. The zebrafish homologue of the ret receptor and its pattern of expression during embryogenesis. Oncogene. 1997;14:879–89. doi: 10.1038/sj.onc.1201048. [DOI] [PubMed] [Google Scholar]
- Marvin MJ, Di Rocco G, Gardiner A, Bush SM, Lassar AB. Inhibition of Wnt activity induces heart formation from posterior mesoderm. Genes Dev. 2001;15:316–27. doi: 10.1101/gad.855501. [DOI] [PMC free article] [PubMed] [Google Scholar]
- Miller-Bertoglio V, Carmany-Rampey A, Furthauer M, Gonzalez EM, Thisse C, Thisse B, Halpern ME, Solnica-Krezel L. Maternal and zygotic activity of the zebrafish ogon locus antagonizes BMP signaling. Dev Biol. 1999;214:72–86. doi: 10.1006/dbio.1999.9384. [DOI] [PubMed] [Google Scholar]
- Nguyen VH, Schmid B, Trout J, Connors SA, Ekker M, Mullins MC. Ventral and lateral regions of the zebrafish gastrula, including the neural crest progenitors, are established by a bmp2b/swirl pathway of genes. Dev Biol. 1998;199:93–110. doi: 10.1006/dbio.1998.8927. [DOI] [PubMed] [Google Scholar]
- Perner B, Englert C, Bollig F. The Wilms tumor genes wt1a and wt1b control different steps during formation of the zebrafish pronephros. Dev Biol. 2007;309:87–96. doi: 10.1016/j.ydbio.2007.06.022. [DOI] [PubMed] [Google Scholar]
- Poulain M, Furthauer M, Thisse B, Thisse C, Lepage T. Zebrafish endoderm formation is regulated by combinatorial Nodal, FGF and BMP signalling. Development. 2006;133:2189–200. doi: 10.1242/dev.02387. [DOI] [PubMed] [Google Scholar]
- Pyati UJ, Webb AE, Kimelman D. Transgenic zebrafish reveal stage-specific roles for Bmp signaling in ventral and posterior mesoderm development. Development. 2005;132:2333–43. doi: 10.1242/dev.01806. [DOI] [PubMed] [Google Scholar]
- Reiter JF, Alexander J, Rodaway A, Yelon D, Patient R, Holder N, Stainier DY. Gata5 is required for the development of the heart and endoderm in zebrafish. Genes Dev. 1999;13:2983–95. doi: 10.1101/gad.13.22.2983. [DOI] [PMC free article] [PubMed] [Google Scholar]
- Rodaway A, Takeda H, Koshida S, Broadbent J, Price B, Smith JC, Patient R, Holder N. Induction of the mesendoderm in the zebrafish germ ring by yolk cell-derived TGF-beta family signals and discrimination of mesoderm and endoderm by FGF. Development. 1999;126:3067–78. doi: 10.1242/dev.126.14.3067. [DOI] [PubMed] [Google Scholar]
- Schier AF, Talbot WS. Molecular genetics of axis formation in zebrafish. Annu Rev Genet. 2005;39:561–613. doi: 10.1146/annurev.genet.37.110801.143752. [DOI] [PubMed] [Google Scholar]
- Schmid B, Furthauer M, Connors SA, Trout J, Thisse B, Thisse C, Mullins MC. Equivalent genetic roles for bmp7/snailhouse and bmp2b/swirl in dorsoventral pattern formation. Development. 2000;127:957–67. doi: 10.1242/dev.127.5.957. [DOI] [PubMed] [Google Scholar]
- Schneider VA, Mercola M. Wnt antagonism initiates cardiogenesis in Xenopus laevis. Genes Dev. 2001;15:304–15. doi: 10.1101/gad.855601. [DOI] [PMC free article] [PubMed] [Google Scholar]
- Serluca FC, Fishman MC. Pre-pattern in the pronephric kidney field of zebrafish. Development. 2001;128:2233–41. doi: 10.1242/dev.128.12.2233. [DOI] [PubMed] [Google Scholar]
- Shmukler BE, Kurschat CE, Ackermann GE, Jiang L, Zhou Y, Barut B, Stuart-Tilley AK, Zhao J, Zon LI, Drummond IA, et al. Zebrafish slc4a2/ae2 anion exchanger: cDNA cloning, mapping, functional characterization, and localization. Am J Physiol Renal Physiol. 2005;289:F835–49. doi: 10.1152/ajprenal.00122.2005. [DOI] [PubMed] [Google Scholar]
- So PL, Danielian PS. Cloning and expression analysis of a mouse gene related to Drosophila odd-skipped. Mech Dev. 1999;84:157–60. doi: 10.1016/s0925-4773(99)00058-1. [DOI] [PubMed] [Google Scholar]
- Stickney HL, Imai Y, Draper B, Moens C, Talbot WS. Zebrafish bmp4 functions during late gastrulation to specify ventroposterior cell fates. Dev Biol. 2007;310:71–84. doi: 10.1016/j.ydbio.2007.07.027. [DOI] [PMC free article] [PubMed] [Google Scholar]
- Sumanas S, Lin S. Ets1-related protein is a key regulator of vasculogenesis in zebrafish. PLoS Biol. 2006;4:e10. doi: 10.1371/journal.pbio.0040010. [DOI] [PMC free article] [PubMed] [Google Scholar]
- Szeto DP, Kimelman D. Combinatorial gene regulation by Bmp and Wnt in zebrafish posterior mesoderm formation. Development. 2004;131:3751–60. doi: 10.1242/dev.01236. [DOI] [PubMed] [Google Scholar]
- Tena JJ, Neto A, de la Calle-Mustienes E, Bras-Pereira C, Casares F, Gomez-Skarmeta JL. Odd-skipped genes encode repressors that control kidney development. Dev Biol. 2007;301:518–31. doi: 10.1016/j.ydbio.2006.08.063. [DOI] [PubMed] [Google Scholar]
- Thisse B, Heyer V, Lux A, Alunni V, Degrave A, Seiliez I, Kirchner J, Parkhill JP, Thisse C. Spatial and temporal expression of the zebrafish genome by large-scale in situ hybridization screening. Methods Cell Biol. 2004;77:505–19. doi: 10.1016/s0091-679x(04)77027-2. [DOI] [PubMed] [Google Scholar]
- Thompson MA, Ransom DG, Pratt SJ, MacLennan H, Kieran MW, Detrich HW, 3rd, Vail B, Huber TL, Paw B, Brownlie AJ, et al. The cloche and spadetail genes differentially affect hematopoiesis and vasculogenesis. Dev Biol. 1998;197:248–69. doi: 10.1006/dbio.1998.8887. [DOI] [PubMed] [Google Scholar]
- Toyama R, Dawid IB. lim6, a novel LIM homeobox gene in the zebrafish: comparison of its expression pattern with lim1. Dev Dyn. 1997;209:406–17. doi: 10.1002/(SICI)1097-0177(199708)209:4<406::AID-AJA8>3.0.CO;2-M. [DOI] [PubMed] [Google Scholar]
- Trinh LA, Stainier DY. Fibronectin regulates epithelial organization during myocardial migration in zebrafish. Dev Cell. 2004;6:371–82. doi: 10.1016/s1534-5807(04)00063-2. [DOI] [PubMed] [Google Scholar]
- Urban AE, Zhou X, Ungos JM, Raible DW, Altmann CR, Vize PD. FGF is essential for both condensation and mesenchymal-epithelial transition stages of pronephric kidney tubule development. Dev Biol. 2006;297:103–17. doi: 10.1016/j.ydbio.2006.04.469. [DOI] [PubMed] [Google Scholar]
- Vogeli KM, Jin SW, Martin GR, Stainier DY. A common progenitor for haematopoietic and endothelial lineages in the zebrafish gastrula. Nature. 2006;443:337–9. doi: 10.1038/nature05045. [DOI] [PubMed] [Google Scholar]
- Vokes SA, Yatskievych TA, Heimark RL, McMahon J, McMahon AP, Antin PB, Krieg PA. Hedgehog signaling is essential for endothelial tube formation during vasculogenesis. Development. 2004;131:4371–80. doi: 10.1242/dev.01304. [DOI] [PubMed] [Google Scholar]
- Walmsley M, Ciau-Uitz A, Patient R. Adult and embryonic blood and endothelium derive from distinct precursor populations which are differentially programmed by BMP in Xenopus. Development. 2002;129:5683–95. doi: 10.1242/dev.00169. [DOI] [PubMed] [Google Scholar]
- Wang Q, Lan Y, Cho ES, Maltby KM, Jiang R. Odd-skipped related 1 (Odd 1) is an essential regulator of heart and urogenital development. Dev Biol. 2005;288:582–94. doi: 10.1016/j.ydbio.2005.09.024. [DOI] [PMC free article] [PubMed] [Google Scholar]
- Westerfield M. The Zebrafish Book. University of Oregon Press; Eugene: 1995. [Google Scholar]
- Wingert RA, Selleck R, Yu J, Song HD, Chen Z, Song A, Zhou Y, Thisse B, Thisse C, McMahon AP, et al. The cdx genes and retinoic acid control the positioning and segmentation of the zebrafish pronephros. PLoS Genet. 2007;3:1922–38. doi: 10.1371/journal.pgen.0030189. [DOI] [PMC free article] [PubMed] [Google Scholar]
Associated Data
This section collects any data citations, data availability statements, or supplementary materials included in this article.
Supplementary Materials
Supplemental figures
Figure S1. osr1 expression in endodermal organs at 48 hpf. (A) Expression of osr1 mRNA in whole mount at 48 hpf, dorsal view. Lines represent plane of section in B and C. (B) Histological section just anterior to the fin bud shows osr1 expression in the forming liver (li). Arrowhead denotes the forming glomerulus, which is negative for osr1. (C) Histological section at the level of the fin shows osr1 expression in the gut (g).
Figure S2. osr1 loss of function does not cause general A-P patterning defects in the pronephros. Expression of trpM7 in control (A) and osr1 morphants (B) is restricted to the late proximal pronephric nephron segment. ret1 expression in control (C) and osr1 morphants (D) is unchanged in the most distal pronephric nephron segment.
Figure S3. osr1 loss of function does not affect mesoderm survival. Acridine orange staining for apoptotic cells in control (A) and osr1 morphant (B) 18 somite embryos. Arrowheads denote area affected in osr1 morphants. Tunel staining of control (C) and osr1 morphant (D) 18 somite embryos show unchanged patterns of apoptosis. Arrowheads point to the area anterior intermediate mesoderm most strongly affected in osr1 morphants.
Figure S4. Expanded vascular differentiation is not due to an altered rate of development. (A) scl (blue) and myoD (red) expression in wild-type embryos at the 12 somite stage. (B) osr1 knockdown results in expansion of scl-positive tissue, most prominently in anterior PLM. myoD is used as an internal staging control and demonstrates both control and osr1 morphants are at the 12 somite stage. (C) scl (blue) and pax2a (red) expression in wild-type embryos from the same clutch of embryos as A and B. (D) osr1 knockdown results in expansion of scl-positive tissue, most prominently in anterior PLM and loss of pax2a expressing cells. (C, D) are lower magnification views of panels (A) and (B) in Figure 5 respectively.
Figure S5. Intermediate mesoderm patterning in pax2/8 and scl morphants. Expression of scl (blue) and myoD (red) in control (A), and pax2a/pax8 double morphant (B) demonstrates that loss of pax gene expression does not cause scl upregulation. Arrowheads mark the area of strongest upregulation of scl seen in osr1 morphants. Expression of pax2a in control (C), scl morphant (D) similarly shows no large expansion of pax2a expression. Expression of pax2a in osr1 morphant (E) and osr1/scl double morphant (F) shows no rescue of pax2a expression. Arrowheads in C-F mark the proximal nephron segment lost in osr1 morphants. The data indicate that pax genes and scl are not involved in a mutual repression mechanism.