

Abstract
Background
A variety of near-infrared spectroscopy devices can be used to make noninvasive measurements of cerebral tissue oxygen saturation (ScO2). The ScO2 measured by the NIRO 300 spectrometer (Hamamatsu Photonics, Japan) is called the cerebral tissue oxygenation index (TOI) and is an assessment of the balance between cerebral oxygen delivery and utilization. We designed this study to investigate the effect of systemic and intracranial physiological changes on TOI.
Methods
Fifteen healthy volunteers were studied during isocapneic hyperoxia and hypoxemia, and normoxic hypercapnea and hypocapnea. Absolute cerebral TOI and changes in oxy- and deoxy-hemoglobin concentrations were measured using a NIRO 300. Changes in arterial oxygen saturation (SaO2), end-tidal carbon dioxide tension (EtCO2), heart rate, mean arterial blood pressure (MBP) and middle cerebral artery blood flow velocity (Vmca) were also measured during these physiological challenges. Changes in cerebral blood volume (CBV) were subsequently calculated from changes in total cerebral hemoglobin concentration.
Results
Baseline TOI was 67.3% with an interquartile range (IQR) of 65.2% - 71.9%. Hypoxemia was associated with a median decrease in TOI of 7.1% (IQR -9.1% to -5.4%) from baseline (p<0.0001) and hyperoxia with a median increase of 2.3% (IQR 2.0% to 2.5%) (p<0.0001). Hypocapnea caused a reduction in TOI of 2.1% (IQR -3.3% to -1.3%) from baseline (p<0.0001) and hypercapnea an increase of 2.6% (IQR 1.4% to 3.7%) (p<0.0001). Changes in SaO2 (p<0.0001), EtCO2 (p<0.0001), CBV (p=0.0003) and MBP (p=0.03) were significant variables affecting TOI. Changes in Vmca (p=0.7) and heart rate (p=0.2) were not significant factors.
Conclusion
TOI is an easy-to-monitor variable that provides real-time, multi-site and noninvasive assessment of the balance between cerebral oxygen delivery and utilization. However, TOI is a complex variable that is affected by SaO2 and EtCO2, and, to a lesser extent, by MBP and CBV. Clinicians need to be aware of the systemic and cerebral physiological changes that can affect TOI in order to interpret changes in this variable during clinical monitoring.
Introduction
Cerebral oxygenation monitoring is widely used to assess the balance between cerebral metabolic supply and demand but standard bedside methods of measuring cerebral oxygenation have significant limitations. Jugular venous oxygen saturation is a global, flow-weighted measure that may miss regional ischemia,1 whereas intraparenchymal brain tissue oxygen tension is a hyper-focal measure and its ability to identify ischemia is dependent on the location of the probe.2 As well as being invasive, these techniques are also associated with a degree of technical difficulty and are not widely available outside specialist centers.3 There is therefore a need for a noninvasive, bedside measure of cerebral oxygenation that can provide real-time data from several regions of the brain simultaneously.
Near-infrared spectroscopy (NIRS) is a noninvasive technique based on the transmission and absorption of near-infrared light (700-1000nm) at multiple wavelengths as it passes through tissue. NIRS allows interrogation of the cerebral cortex using reflectance spectroscopy via optodes, light transmitting and detecting devices, placed on the scalp.4 Oxygenated hemoglobin (O2Hb) and deoxygenated (HHb) hemoglobin have different absorption spectra, and cerebral oxygenation and hemodynamic status can be determined by their relative absorption of near-infrared light. Biological tissue is a highly scattering medium but, if the average pathlength of light through tissue is known, the modified Beer-Lambert law (MBL), which assumes constant scattering losses, allows calculation of absolute changes in chromophore concentration.5 Earlier NIRS methodology was predominantly limited to differential spectroscopy methods that provide trend monitoring of the changes in tissue chromophore concentration (e.g. O2Hb and HHb).5 These variables are generally unfamiliar to clinicians, even if the changes are quantified in micromolar units. Technical developments, for example, the use of spatially resolved spectroscopy (SRS), have allowed the introduction of clinical monitors that incorporate an absolute measure of cerebral tissue hemoglobin oxygen saturation (ScO2), an easily accessible and continuous measure of the balance between cerebral tissue oxygen delivery and utilization.6 There are a variety of NIRS instruments available that measure ScO2 in some form.7 The NIRO 300 spectrometer (Hamamatsu Photonics, Japan) uses 4 wavelengths (778, 813, 850 and 913 nm) and the MBL to measure changes in O2Hb and HHb concentrations, and the SRS technique to measure absolute ScO2 which is expressed as the cerebral tissue oxygenation index (TOI) and is displayed as a simple percentage value.8 The application of SRS, and the validity of TOI, have been described in normal adult volunteers9;10 and in clinical scenarios.11-13 The depth sensitivity of TOI has also been evaluated by selective internal and external carotid artery clamping during carotid surgery, and shows high sensitivity and specificity to intracerebral changes in adults.11 Furthermore, because NIRS interrogates arterial, venous and capillary blood within the field of view, the derived saturation represents a “tissue” oxygen saturation measured from these 3 compartments6 and can be used to identify tissue hypoxia/ischemia.14
The development of indices such as TOI has been motivated in part by the desire to provide clinicians with an easily accessible measure of cerebral tissue oxygenation. The optical measurement of TOI is derived from the proportion of O2Hb relative to total Hb (HbT) concentration in the field of view.8 However, exactly what TOI represents in physiological terms is complex and likely to be influenced by a number of inputs. These have been summarized as:15
| Eqn. 1 |
SaO2 = arterial oxyhemoglobin saturation, Vv and Va = venous and arterial blood volume respectively, CMRO2 = cerebral metabolic rate for oxygen, k = oxygen carrying ability of hemoglobin, CBF = cerebral blood flow and [Hb] = blood Hb concentration.
Most of these variables affect either cerebral oxygen delivery or utilization, and TOI should therefore be a reasonable measure of the balance between the 2. However, when interpreting TOI, or other NIRS measures of ScO2, it is important to understand how physiological variables might affect the measured saturation. From equation 1 it is clear that changes in SaO2 will affect TOI and, although of fundamental importance, this relationship has not previously been studied. Because NIRS interrogates arterial, venous and capillary blood, TOI will also be affected by variation in the cerebral arterial:venous volume ratio (AVR). While the AVR is typically 1:3 (25% arterial and 75% venous),16 the actual ratio depends on individual anatomy, local physiology and pathological states.17 Changes in arterial carbon dioxide partial pressure (PaCO2) also induce changes in cerebral AVR18 and PaCO2 is therefore similarly likely to affect TOI. This study was designed to investigate these relationships by observing the effects on cerebral TOI of changes in cerebral oxygen delivery during isocapneic hyperoxia and hypoxemia, and normoxic hypercapnea and hypocapnea, in healthy volunteers.
Methods
The study was approved by the Joint Research Ethics Committee of the National Hospital for Neurology and Neurosurgery and the Institute of Neurology, University College London.
NIRS Measurements
After obtaining informed written consent, a NIRO 300 monitor was used to measure absolute TOI using SRS and changes in HbO2 and HHb concentrations using the MBL during a variety of physiological challenges in 15 healthy adult volunteers. The source-detector optode pair was fixed in a black rubber holder with a source-detector separation of 5cm over the right side of the forehead in the midpupillary line, avoiding the sinuses. The optode holder was secured to the head using an elasticated crepe bandage to prevent optode movement and covered with a light-absorbing cloth to eliminate stray light. NIRS data were collected at 6 Hz.
Other measurements
SaO2 was measured using a pulse oximeter, modified to provide beat-to-beat recording (Novametrix Medical Systems Inc., Wallingford, CT, USA), with the probe attached to the subject’s left ear. Mean arterial blood pressure (MBP) and heart rate (HR) were measured noninvasively using a Portapress and finger probe (Biomedical Instrumentation, TNO Institute of Applied Physics, Belgium). MBP was recorded from the analogue output of the Portapress continuously at 100 Hz and the signal was later re-sampled to 6 Hz. Blood flow velocity in the right middle cerebral artery (Vmca) was measured by the same experienced operator (MT) using 2 MHz transcranial Doppler ultrasonography (TCD) (Nicolet, UK), as a surrogate of CBF.19 Mean Vmca was calculated from the CBF velocity envelope using a trapezoidal integration function (MatLab, Mathworks Inc.,USA). Inspired oxygen fraction (FiO2) and end-tidal carbon dioxide tension (EtCO2) were measured using an in-line gas analyzer (Hewlett Packard, UK) and a CO2SMO optical sensor (Novametrix Medical Systems Inc.) respectively.
Study Protocol
A modified anesthetic machine delivered inspired gas to the subjects via a Mapelson E (Ayres T-piece) breathing system incorporating a mouthpiece and 50 cm expiratory limb. The study was divided into 4 challenge periods with a rest period between each. Each challenge period was preceded by 5 minutes of data collection at normoxia and normocapnea. Three cycles of the following physiological challenges were performed in each volunteer:
Hypoxemia - Nitrogen was added to the inspired gas to induce a gradual decrease in SaO2 to 80% and, immediately after this was achieved, FiO2 was returned to baseline (normoxia) for 5 minutes. EtCO2 was continuously fed-back to the subjects so that they could adjust their minute ventilation and maintain normocapnea throughout this part of the study.
Hyperoxia - FiO2 was increased to 100% for 5 minutes and then returned to normoxia for 5 minutes. The subjects again adjusted their minute ventilation using the EtCO2 feed-back system to maintain normocapnea.
Hyperventilation - The subjects hyperventilated to reduce EtCO2 by 1.5 kPa below baseline. This was maintained for 5 minutes and then a normal breathing rate was resumed, allowing EtCO2 to return to baseline over approximately 5 minutes.
Hypercapnea - Approximately 6% CO2 was added to the inspired gas and titrated to induce an increase in EtCO2 of 1.5 kPa. This was maintained for 5 minutes and the inspired CO2 fraction was then returned to zero for another 5 minutes.
At the end of the study, a venous blood sample was obtained and the Hb concentration measured using a coximeter (ABL 700, Radiometer Copenhagen, Denmark).
Data Analysis
Absolute change in O2Hb and HHb concentrations was calculated from changes in light attenuation using the MBL and the UCL4 algorithm, assuming a differential pathlength factor of 6.26.20 Changes in HbT concentration were subsequently calculated (Δ[HbT] = Δ[HbO2] + Δ[HHb]) and converted to changes in CBV using the formula:
| Eqn.2 |
ΔCBV = change in cerebral blood volume (ml/100g of brain), Δ[HbT] =change in total hemoglobin concentration (mol/l), MWHb = molecular weight of hemoglobin (64 500 g/mole), [Hb] = the large vessel hemoglobin concentration (g/l), CSLVH = the cerebral small vessel to large systemic vessel haematocrit and ρ = the brain density (1.05 g/ml).
The start and end of each challenge period was identified from the SaO2, FiO2 or EtCO2 data according to the phase of the study. To enable comparison between subjects and across physiological challenges, 8 points were selected within each individual period of alteration of FiO2 or EtCO2 (the challenge period) so that the time between adjacent points represented an eighth of the total time course of the challenge period. This produced 9 timepoints with point 1 representing the point just before the start, and point 9 the end, of the challenge period (Figure 1). The recovery period was similarly divided, producing points 9 (just before start of recovery) to 17 (end of recovery period). At each timepoint, the mean of the preceding 10 seconds of data was calculated and used for analysis. Data from the 3 experimental cycles of each physiological challenge were averaged to give a single course for each subject. For each of the challenges a mean of the variables from the 2 NIRS channels was calculated. Group median changes from baseline at each timepoint were produced.
Figure 1.
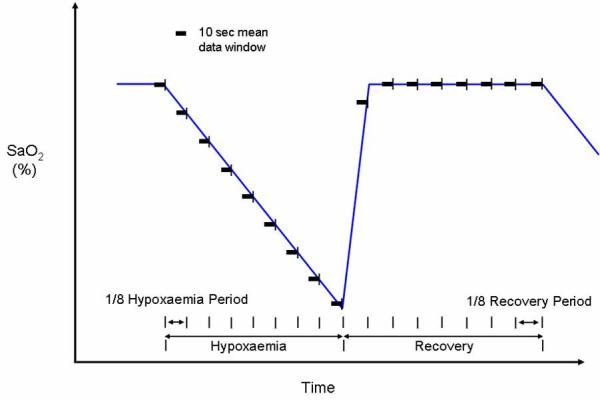
Schematic of data analysis for hypoxemia paradigm using SaO2 data to define data windows for summary analysis.
Statistical analysis was performed using SAS software (v9.1, SAS Institute, USA). Percentage changes from baseline for Vmca, and absolute changes from baseline for other measured variables were compared using nonparametric analysis of variance (ANOVA) with post hoc pairwise comparisons.21 p values less than 0.05 were considered significant. Multiple regression analysis was performed using change in TOI as the dependent variable and changes in other variables as regression variables. Regression variables which were not significant were then removed and the regression analysis repeated.
Results
Fifteen adult volunteers (10 male and 5 female) with median age 31 (range 27-39) years were recruited into the study. Baseline values for the measured variables are shown in Table 1.
Table 1.
Median and interquartile range (IQR) for baseline values of measured variables before the start of hypoxemias (n=15).
Inspired oxygen fraction (FiO2), arterial oxygen saturation (SaO2), end-tidal carbon dioxide tension (EtCO2), heart rate (heart rate), mean arterial blood pressure (MBP), middle cerebral artery blood flow velocity (Vmca), hemoglobin (Hb), tissue oxygenation index (TOI)
| Median | IQR | |
|---|---|---|
| FiO2 (%) | 21.0 | 21.0 to 21.0 |
| SaO2 (%) | 99.2 | 98.2 to 99.2 |
| EtCO2 (kPa) | 5.4 | 5.2 to 5.7 |
| HR (min-1) | 62.5 | 60.0 to 71.5 |
| MBP (mmHg) | 77.6 | 70.3 to 88.8 |
| vMCA (cms-1) | 43.2 | 37.9 to 51.1 |
| Hb (g/dL) | 14.7 | 13.75 to 14.95 |
| TOI (%) | 68.3 | 65.2 to 71.9 |
The SaO2 of all subjects reached 80% at the nadir of the hypoxemic challenge, with a median reduction in SaO2 of 15.8% (interquartile range (IQR) -18.4 to -14.1%). The median increase in FiO2 at the mouthpiece during hyperoxia was 72% and all subjects responded with a significant increase in SaO2 from baseline (p< 0.0001) with a median increase of 0.7% (IQR 0.5 to 0.9%). During hyperventilation, the median reduction in EtCO2 was 1.5 kPa (IQR -1.7 to -1.4kPa) and during hypercapnea the median increase in EtCO2 was 1.7 kPa (IQR 1.5 to 1.9kPa).
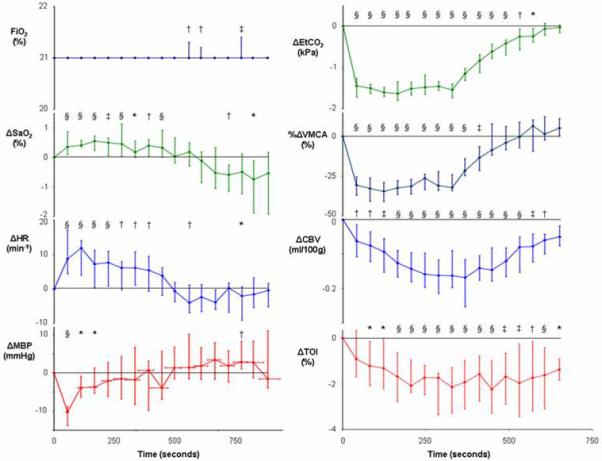
Hypoxemia was associated with a median decrease in TOI of 7.1% (IQR -9.1% to -5.4%) from baseline (p<0.0001) and hyperoxia with a median increase of 2.3% (IQR 2.0% to 2.5%) (p<0.0001). Hypocapnea caused a reduction in TOI of 2.1% (IQR -3.3% to -1.3%) from baseline (p<0.0001) and hypercapnea an increase of 2.6% (IQR 1.4% to 3.7%) (p<0.0001). Figures 2 - 5 show the group data for the measured variable values during the 4 physiological challenges.
Figure 2.
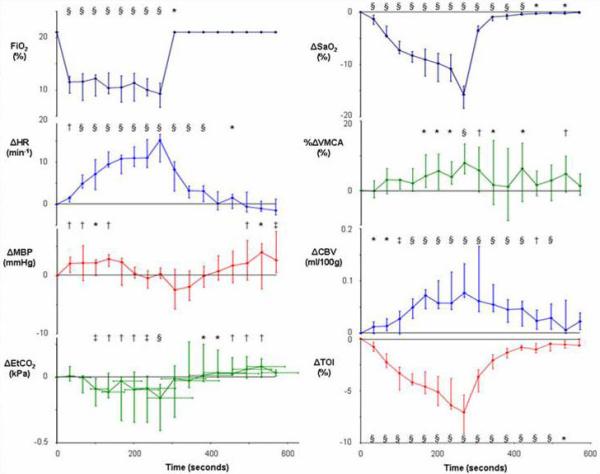
Median and interquartile range (n=15) for variable values during hypoxemia (* p<0.05, † p<0.01, ‡ p<0.001, § p<0.0001 for change from baseline).
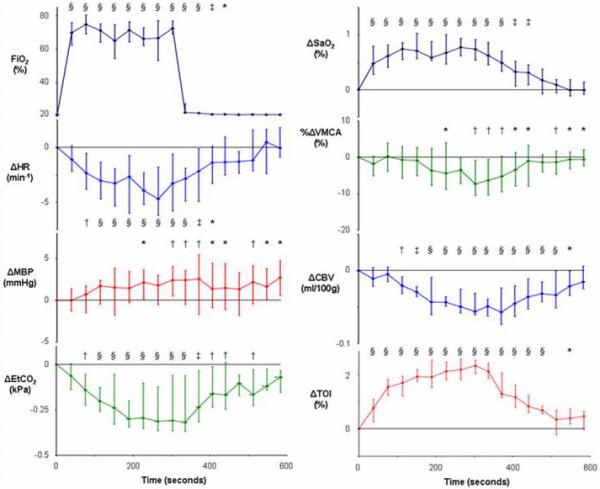
Figure 5.
Median and interquartile range (n=15) for variable values during hypercapnea (* p<0.05, † p<0.01, ‡ p<0.001, § p<0.0001 for change from baseline).
Multiple regression analysis confirmed that changes in SaO2 (p<0.0001), EtCO2 (p<0.0001), CBV (p=0.0003) and MBP (p=0.03) were significant variables affecting TOI. Percentage changes in Vmca (p=0.7) and HR (p=0.2) were not significant factors. The regression analysis was repeated using only the significant regression variables to determine the regression beta values:
| Eqn 3 |
The overall adjusted r value was 0.82 (p<0.0001). The standardized beta coefficients and p values for each variable are shown in Table 2.
Table 2.
Standardized regression estimates (standard β) and p values for multiple regression analysis variables shown in equation 1. CBV= cerebral blood volume, MBP= mean arterial blood pressure
| Variable | ΔSaO2 | ΔEtCO2 | ΔCBV | ΔMBP |
|---|---|---|---|---|
| standard β | 0.71 | 0.37 | 0.09 | 0.04 |
| p value | <0.0001 | <0.0001 | 0.0005 | 0.03 |
Discussion
Hyperoxia and hypercapnea resulted in an increase in cerebral TOI, whereas TOI was reduced during hypoxemia and hyperventilation. TOI is predominantly affected by SaO2 and EtCO2 and, to a lesser extent, by CBV and MBP.
There was a large variation in TOI among individuals in this study. The median baseline TOI was 68.3% with an IQR of 65.2% to 71.9%. This variability has been reported previously.22;23 The “normal” range for TOI varies between 60 - 75%, with a coefficient of variation for absolute baseline values of almost 10%, and this might limit the usefulness of isolated measurements of TOI.23 Rasmussen et al estimated capillary Hb oxygen saturation as the mean of arterial and jugular bulb oxygen saturation and compared this derived value with TOI during changes in inspired oxygen and carbon dioxide fractions.24 Although these variables were correlated, there was a wide variation between TOI and the modelled capillary oxygen saturation, also suggesting that the potential for using absolute TOI values to define ischemic thresholds or guide targeted therapy in the clinical environment might be limited. Al-Rawi and Kirkpatrick attempted to determine the reduction in TOI that is associated with cerebral ischemia by studying the effect of carotid artery clamping during carotid surgery.12 Electroencephalography was used to define the presence of cerebral ischemia and no patient with a percentage reduction in TOI less than 13% showed electroencephalography evidence of ischemia. The potential application of TOI and other NIRS measures of ScO2 as trend monitors of incipient cerebral hypoxia/ischemia is therefore attractive but, for their interpretation to be clinically valid, clinicians must understand what systemic and cerebral physiological variables affect the measured cerebral saturation.
In our study, hypoxemia (SaO2 ~ 80%), was associated with a median decrease in TOI of 7.1% from a median baseline of 68.3%. Although it is likely that the reduction in TOI was related to the reduction in SaO2, it is important to exclude other causes. There was a small (0.2 kPa) but statistically significant reduction in median EtCO2 at the nadir of hypoxemia. This was likely due to the hypoxemic stimulus to hyperventilate despite the application of an EtCO2 biofeedback loop. However, multiple regression analysis demonstrates that this magnitude of change in EtCO2 in isolation would induce a reduction in TOI of only 0.2% and it is therefore unlikely to be contributing to the large reduction in TOI that we observed. In agreement with other investigators,25 we observed a significant increase in HR and small change in MBP during hypoxemia, but these are also unlikely to have affected TOI. There was an increase in Vmca and CBV during hypoxemia and this finding is in keeping with previous studies that identified the threshold for hypoxic vasodilatation in healthy volunteers occurring at SaO2 of around 90%.25
The small increase in SaO2 (median 0.7%) during hyperoxia was associated with a median increase in TOI of 2.3%. While this degree of change in TOI is unlikely to be of clinical significance, it warrants an explanation from a physiological perspective. Despite subjects attempting to maintain isocapnea, there was a small but statistically significant decrease in EtCO2 (median 0.3 kPa) that was likely related to 2 linked effects. Increasing oxyhemoglobin saturation decreases the affinity of Hb for carbon dioxide (the Haldane effect),26 thereby reducing carbon dioxide uptake from tissue. This is likely to translate to a reduction in PaCO2 and therefore in EtCO2. It has also been suggested that the Haldane effect-mediated CO2 retention in the respiratory centers of the brain might induce a hyperventilatory response that would in turn result in decreased PaCO2 and EtCO2.27 Hyperoxia caused a reduction in Vmca and CBV and this might in part be related to the small reduction in PaCO2. However, arterial-spin-labelled magnetic resonance imaging studies indicate that normobaric hyperoxia has a direct cerebral vasoconstrictive effect as well as an indirect effect mediated via the reduced PaCO2.27 Reductions in CBV and Vmca would tend to reduce TOI, but, during hyperoxia, we observed the opposite, i.e. an increase in TOI that was of greater magnitude (median increase 2.3%) than the associated increase in SaO2 (median increase 0.7%). This might, in part, be related to an increase in dissolved blood oxygen. However, this is unlikely to be the only explanation because of the modest increase in dissolved oxygen that occurs during hyperoxia. Assuming a constant CMRO2, our data suggest that the combined effect of the small increase in arterial oxygen content and reduced CBV and Vmca (and therefore presumably of CBF) is an overall increase in cerebral oxygen delivery. The increase in TOI that we observed therefore seems to indicate that the reduction in CBF during hyperoxia was small and compensated for by the increase in dissolved blood oxygen. Alternatively, our results could be explained by a decrease in CMRO2 during hyperoxia, although we believe that this is unlikely during the short time course of the study.
Hyperventilation caused a reduction in TOI in association with a small increase in SaO2 and reduction in CBV. The latter is presumably related to the known cerebral arteriolar vasoconstrictive effects of reduced PaCO228 because we also observed a simultaneous reduction in Vmca. Despite the small increase in SaO2 during hyperventilation, TOI was reduced and this is likely to be explained by a reduction in CBV and CBF. It is of note that the CBV and Vmca responses had different time courses during this phase of the study. Vmca returned to baseline during the recovery period, whereas CBV returned towards, but did not reach, baseline by the end of the study. This suggests that the autoregulatory processes which attempt to maintain a stable CBF might entail mechanisms beyond changes in arteriolar calibre.
Hypercapnea resulted in an increase in TOI in association with a small increase in SaO2. The latter is likely to be related to the tendency of the subjects to hyperventilate in the presence of a high PaCO2 despite the application of the biofeedback mechanism. During the early part of the hypercapneic challenge, there was an increase in Vmca that returned towards baseline before the end of the challenge period, again suggesting the presence of autoregulatory mechanisms in addition to carbon dioxide effects on arteriolar caliber. CBV increased during hypercapnea and returned towards, but did not reach, baseline values during the recovery period. The time course of the hypercapnea-induced increase in TOI suggests that the TOI changes were more likely to be related to the increase in CBV than the increase in Vmca because TOI also returned towards, but did not reach, baseline by the end of the recovery period. A similar increase in cerebral tissue oxygen tension in response to hypercapnea which outlasts the CO2 changes has also been demonstrated in a rat model.29
The high temporal resolution of the noninvasive techniques used in this study offers a unique opportunity to investigate the relative time courses of changes in cerebral oxygenation and hemodynamic variables. Such an analysis is beyond the scope of this study and, in order to fully understand how the complex interactions between changes in PaO2, PaCO2 and CBF interact to produce changes in TOI, we are undertaking further analysis within the context of a recently published mathematical model that was specifically developed to aid the interpretation of cerebral NIRS data.30
Assuming constant CMRO2 and Hb concentration during the challenge periods, our data indicate that several variables can affect the value of TOI. Change in SaO2 is the most important and EtCO2 the second most important. Although changes in CBV and MBP were statistically significant, their standardized beta values were an order of magnitude lower than that for SaO2 (0.09 and 0.04 respectively, versus 0.71) and their effects are unlikely to have major clinical relevance. It is of note that CBV was a significant variable affecting TOI, whereas percentage change in Vmca was not. Regression analysis confirmed that the changes in EtCO2 alone can account for the observed changes in Vmca and this is likely to explain why Vmca was not a significant independent variable affecting TOI. When we performed multiple regression analysis with changes in EtCO2 omitted, changes in Vmca became a significant factor affecting TOI (analysis not shown) and this tends to confirm this hypothesis.
There are several limitations to our study. Since we wished to avoid the placement of arterial lines for blood gas analysis in volunteers, we used SaO2 as a measure of arterial oxygenation and EtCO2 as a surrogate for PaCO2. Measurement of SaO2 does not account for dissolved oxygen, but the consequence of this is likely to be negligible during normoxia and hypoxia. It might however become relevant during hyperoxia and impact on the results of that part of our study. Changes in EtCO2 are accurate surrogates of changes in PaCO2 in healthy subjects and the use of EtCO2 is therefore unlikely to have affected our results.31 We used TCD-derived Vmca as a surrogate for CBF and this relationship relies on there being no change in the diameter of the insonated vessel or in the angle of insonation during the measurements. magnetic resonance imaging studies have confirmed that basal middle cerebral arterial diameter does not change substantially during the type of physiological challenges that we used in this study.19 Furthermore, the TCD studies were performed by an experienced operator (MT) using a proprietary probe head fixation system to minimize artefact from probe movement. Since TOI is the balance between cerebral oxygen delivery and utilization, changes in CMRO2 are likely to affect TOI. Although it is unlikely that CMRO2 changed during the physiological challenges in our healthy subjects, we did not measure CMRO2 and cannot therefore exclude changes in CMRO2 as a confounding factor. Finally, our calculation of CBV, measured from MBL-derived changes in O2Hb and HHb concentrations, is likely to be prone to some error because these variables do not exclusively measure the intra-cerebral compartment.7,11 However, they do not apply to the SRS measurement of TOI which has high sensitivity and specificity to intracerebral changes.11
In conclusion, TOI is an easy-to-monitor variable that provides a real-time, noninvasive assessment of regional tissue cerebral oxygenation. The predominant factors determining TOI are SaO2 and EtCO2, with changes in MBP and CBV having limited effects. The variability of TOI in healthy volunteers is likely to limit its clinical usefulness as a “one off” measure of cerebral oxygenation, but changes in TOI have great potential as a trend monitor for the identification of hypoxia/ischemia. However, further studies in brain-injured patients are required to determine the magnitude of the reduction in TOI that is associated with incipient cerebral hypoxia/ischemia. Importantly though, clinicians need to be aware of the systemic and cerebral physiological changes that can affect TOI in order to interpret changes in this variable during clinical monitoring.
Figure 3.
Median and interquartile range (n=15) for variable values during hyperoxia (* p<0.05, † p<0.01, ‡ p<0.001, § p<0.0001 for change from baseline).
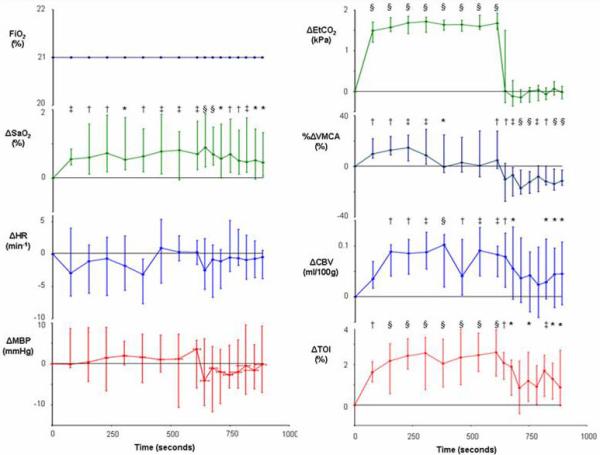
Figure 4.
Median and interquartile range (n=15) for variable values during hyperventilation (* p<0.05, † p<0.01, ‡ p<0.001, § p<0.0001 for change from baseline).
Acknowledgments
Financial Support
MT is funded by the Wellcome Trust (grant no 075608), IT by the Engineering Physical Science Research Council (grant no GR/N14248/01) and TL by Hamamatsu Photonics, KK. This work was undertaken at University College London Hospitals and partially funded by the Department of Health’s NIHR Biomedical Research Centres funding scheme. The work was also made possible in part by a donation in memory of Karolyn Margaret Jones.
Footnotes
Conflict of Interest:
Professor Clare E. Elwell has received lecture honoraria and Dr. Terence S. Leung salary funding from Hamamatsu Photonics, KK, Japan.
References
- 1.Schell RM, Cole DJ. Cerebral monitoring: jugular venous oximetry. Anesth Analg. 2000;90:559–66. doi: 10.1097/00000539-200003000-00012. [DOI] [PubMed] [Google Scholar]
- 2.Gupta AK, Hutchinson PJ, al-Rawi P, Gupta S, Swart M, Kirkpatrick PJ, Menon DK, Datta AK. Measuring brain tissue oxygenation compared with jugular venous oxygen saturation for monitoring cerebral oxygenation after traumatic brain injury. Anesth Analg. 1999;88:549–53. doi: 10.1097/00000539-199903000-00016. [DOI] [PubMed] [Google Scholar]
- 3.Tisdall MM, Smith M. Multimodal monitoring in traumatic brain injury: current status and future directions. Br J Anaesth. 2007;99:61–7. doi: 10.1093/bja/aem143. [DOI] [PubMed] [Google Scholar]
- 4.Okada E, Delpy DT. Near-infrared light propagation in an adult head model. II. Effect of superficial tissue thickness on the sensitivity of the near-infrared spectroscopy signal. Appl Opt. 2003;42:2915–22. doi: 10.1364/ao.42.002915. [DOI] [PubMed] [Google Scholar]
- 5.Delpy DT, Cope M, van der Zee P, Arridge S, Wray S, Wyatt J. Estimation of optical pathlength through tissue from direct time of flight measurement. Phys Med Biol. 1988;33:1433–42. doi: 10.1088/0031-9155/33/12/008. [DOI] [PubMed] [Google Scholar]
- 6.Smith M. Perioperative uses of transcranial perfusion monitoring. Neurosurg Clin N Am. 2008;19:489–502. doi: 10.1016/j.nec.2008.07.008. [DOI] [PubMed] [Google Scholar]
- 7.Owen-Reece H, Smith M, Elwell CE, Goldstone JC. Near infrared spectroscopy. Br J Anaesth. 1999;82:418–26. doi: 10.1093/bja/82.3.418. [DOI] [PubMed] [Google Scholar]
- 8.Suzuki S, Takasaki S, Ozaki T, Kobayashi Y. A tissue oxygenation monitor using NIR spatially resolved spectroscopy. SPIE Proc. 1999;3597:592. [Google Scholar]
- 9.Tisdall MM, Tachtsidis I, Leung TS, Elwell CE, Smith M. Near-infrared spectroscopic quantification of changes in the concentration of oxidized cytochrome c oxidase in the healthy human brain during hypoxemia. J Biomed Opt. 2007;12:024002. doi: 10.1117/1.2718541. [DOI] [PubMed] [Google Scholar]
- 10.Quaresima V, Sacco S, Totaro R, Ferrari M. Noninvasive measurement of cerebral hemoglobin oxygen saturation using two near infrared spectroscopy approaches. J Biomed Opt. 2000;5:201–5. doi: 10.1117/1.429987. [DOI] [PubMed] [Google Scholar]
- 11.Al-Rawi PG, Smielewski P, Kirkpatrick PJ. Evaluation of a near-infrared spectrometer (NIRO 300)for the detection of intracranial oxygenation changes in the adult head. Stroke. 2001;32:2492–500. doi: 10.1161/hs1101.098356. [DOI] [PubMed] [Google Scholar]
- 12.Al-Rawi P, Kirkpatrick P. Tissue oxygen index: thresholds for cerebral ischemia using near-infrared spectroscopy. Stroke. 2006;37:2720–5. doi: 10.1161/01.STR.0000244807.99073.ae. [DOI] [PubMed] [Google Scholar]
- 13.McLeod AD, Igielman F, Elwell C, Cope M, Smith M. Measuring cerebral oxygenation during normobaric hyperoxia: a comparison of tissue microprobes, near-infrared spectroscopy, and jugular venous oximetry in head injury. Anesth Analg. 2003;97:851–6. doi: 10.1213/01.ANE.0000072541.57132.BA. [DOI] [PubMed] [Google Scholar]
- 14.Kurth CD, Levy WJ, McCann J. Near-infrared spectroscopy cerebral oxygen saturation thresholds for hypoxia-ischemia in piglets. J Cereb Blood Flow Metab. 2002;22:335–41. doi: 10.1097/00004647-200203000-00011. [DOI] [PubMed] [Google Scholar]
- 15.Tachtsidis I, Tisdall M, Delpy DT, Smith M, Elwell CE. Measurement of cerebral tissue oxygenation in young healthy volunteers during acetazolamide provocation: a transcranial Doppler and near-infrared spectroscopy investigation. Adv Exp Med Biol. 2008;614:389–96. doi: 10.1007/978-0-387-74911-2_43. [DOI] [PubMed] [Google Scholar]
- 16.An H, Lin W. Cerebral venous and arterial volumes can be estimated separately in humans using magnetic resonance imaging. Mag Res Med. 2002;48:583–8. doi: 10.1002/mrm.10257. [DOI] [PubMed] [Google Scholar]
- 17.Watzman HM, Kurth CD, Montenegro LM, Rome J, Steven JM, Nicolson SC. Arterial and venous contributions to near-infrared cerebral oximetry. Anesthesiology. 2000;93:947–53. doi: 10.1097/00000542-200010000-00012. [DOI] [PubMed] [Google Scholar]
- 18.Ito H, Ibaraki M, Kanno I, Fukuda H, Miura S. Changes in the arterial fraction of human cerebral blood volume during hypercapnia and hyocapnia measured by positron emission tomography. J Cereb Blood Flow Metab. 2005;25:852–7. doi: 10.1038/sj.jcbfm.9600076. [DOI] [PubMed] [Google Scholar]
- 19.Valdueza JM, Balzer JO, Villringer A, Vogl TJ, Kutter R, Einhaupl KM. Changes in blood flow velocity and diameter of the middle cerebral artery during hyperventilation: assessment with MR and transcranial Doppler sonography. Am J Neuroradiol. 1997;18:1929–34. [PMC free article] [PubMed] [Google Scholar]
- 20.Duncan A, Meek JH, Clemence M, Elwell CE, Tyszczuk L, Cope M, Delpy DT. Optical pathlength measurements on adult head, calf and forearm and the head of the newborn infant using phase resolved optical spectroscopy. Phys Med Biol. 1995;40:295–304. doi: 10.1088/0031-9155/40/2/007. [DOI] [PubMed] [Google Scholar]
- 21.Siegel S, Castellan NJ. Nonparametric Statistics for the Behavioural Sciences. 2nd edition McGraw-Hill; Singapore: 1988. [Google Scholar]
- 22.Sorensen LC, Greisen G. Precision of measurement of cerebral tissue oxygenation index using near-infrared spectroscopy in preterm neonates. J Biomed Opt. 2006;11:054005. doi: 10.1117/1.2357730. [DOI] [PubMed] [Google Scholar]
- 23.Thavasothy M, Broadhead M, Elwell C, Peters M, Smith M. A comparison of cerebral oxygenation as measured by the NIRO 300 and the INVOS 5100 Near-Infrared Spectrophotometers. Anaesthesia. 2002;57:999–1006. doi: 10.1046/j.1365-2044.2002.02826.x. [DOI] [PubMed] [Google Scholar]
- 24.Rasmussen P, Dawson EA, Nybo L, van Lieshout JJ, Secher NH, Gjedde A. Capillary-oxygenation-level-dependent near-infrared spectrometry in frontal lobe of humans. J Cereb Blood Flow Metab. 2007;27:1082–93. doi: 10.1038/sj.jcbfm.9600416. [DOI] [PubMed] [Google Scholar]
- 25.Gupta AK, Menon DK, Czosnyka M, Smielewski P, Jones JG. Thresholds for hypoxic cerebral vasodilation in volunteers. Anesth Analg. 1997;85:817–20. doi: 10.1097/00000539-199710000-00018. [DOI] [PubMed] [Google Scholar]
- 26.Dash R, Bassingthwaighte J. Blood HbO2 and HbCO2 dissociation curves at varied O2, CO2, pH, 2,3-DPG and temperature levels. Ann Biomed Eng. 2004;32:1676–93. doi: 10.1007/s10439-004-7821-6. [DOI] [PubMed] [Google Scholar]
- 27.Floyd TF, Clark JM, Gelfand R, Detre JA, Ratcliffe S, Guvakov D, Lambertson CJ, Eckenhoff RG. Independent cerebral vasoconstrictive effects of hyperoxia and accompanying arterial hypocapnia at 1 ATA. J Appl Physiol. 2003;95:2453–61. doi: 10.1152/japplphysiol.00303.2003. [DOI] [PubMed] [Google Scholar]
- 28.Greenberg J, Alavi A, Reivich M, Kuhl D, Uzzell B. Local cerebral blood volume response to carbon dioxide in man. Circ Res. 1978;43:324–31. doi: 10.1161/01.res.43.2.324. [DOI] [PubMed] [Google Scholar]
- 29.Hare G, Kavanagh B, Mazer C, Hum K, Kim S, Coackley C, Barr A, Baker AJ. Hypercapnia increases cerebral tissue oxygen tension in anesthetized rats. Can J Anaesth. 2007;50:1061–8. doi: 10.1007/BF03018375. [DOI] [PubMed] [Google Scholar]
- 30.Banaji M, Mallet A, Elwell CE, Nicholls P, Cooper CE. A model of brain circulation and metabolism: NIRS signal changes during physiological challenges. PLoS Comput Biol. 2008;4:e10000212. doi: 10.1371/journal.pcbi.1000212. [DOI] [PMC free article] [PubMed] [Google Scholar]
- 31.Whitesell R, Asiddao C, Gollman D, Jablonski J. Relationship between arterial and peak expired carbon dioxide pressure during anesthesia and factors influencing the difference. Anesth Analg. 1981;60:508–12. [PubMed] [Google Scholar]