Abstract
Several efforts have been made to completely automate cephalometric analysis by automatic landmark search. However, accuracy obtained was worse than manual identification in every study. The analogue-to-digital conversion of X-ray has been claimed to be the main problem. Therefore the aim of this investigation was to evaluate the accuracy of the Cellular Neural Networks approach for automatic location of cephalometric landmarks on softcopy of direct digital cephalometric X-rays. Forty-one, direct-digital lateral cephalometric radiographs were obtained by a Siemens Orthophos DS Ceph and were used in this study and 10 landmarks (N, A Point, Ba, Po, Pt, B Point, Pg, PM, UIE, LIE) were the object of automatic landmark identification. The mean errors and standard deviations from the best estimate of cephalometric points were calculated for each landmark. Differences in the mean errors of automatic and manual landmarking were compared with a 1-way analysis of variance. The analyses indicated that the differences were very small, and they were found at most within 0.59 mm. Furthermore, only few of these differences were statistically significant, but differences were so small to be in most instances clinically meaningless. Therefore the use of X-ray files with respect to scanned X-ray improved landmark accuracy of automatic detection. Investigations on softcopy of digital cephalometric X-rays, to search more landmarks in order to enable a complete automatic cephalometric analysis, are strongly encouraged.
1. Introduction
Since the introduction of the cephalometer in 1931 [1], cephalometric analysis has become an important clinical tool in diagnosis, treatment planning, evaluation of growth, or treatment results and research [2, 3].
Recently, due to the affordability of digital radiographic imaging, the demand for the medical profession to completely automate analysis and diagnostic tasks has increased. In this respect, automatic cephalometric analysis is one of the main goals, to be reached in orthodontics in the near future. Accordingly, several efforts have been made to automate cephalometric analysis [4].
The main problem, in automated cephalometric analysis, is landmark detection, given that the measurement process has already been automated successfully. Different approaches that involved computer vision and artificial intelligence techniques have been used to detect cephalometric landmarks [5–22], but in any case accuracy was the same or worse than the one of manual identification; for a review see Leonardi et al. [4]. None of the proposed approaches solves the problem completely, that is, locating all the landmarks requested by a complete cephalometric analysis and with accuracy suitable to clinical practice.
It should be emphasized that reliability in the detection of landmarks is mandatory for any automatic approach, in order to be employed for any clinical use. As previously stated [4], among the possible factors that reduce reliability the loss of image quality, inherent to digital image conversion and compression in comparison with the original radiograph, has been claimed [3, 23, 24]. In fact, this analogue-to-digital conversion (ADC) results in the loss and alteration of information due to the partial volume averaging; consequently many edges are lost or distorted.
To the best of our knowledge, every study on automatic landmarking has been carried out on scanned lateral cephalograms transformed into digital images [4], and this could explain in some way the inaccuracies of automatic location compared to the manual identification of landmarks. Recently, a new hybrid approach, which is based on Cellular Neural Networks (CNNs), has been proposed for automatic detection of some landmarks [21, 22]. Results of evaluation of the method's performance on scanned cephalograms were promising; nevertheless, for some landmarks the error in the location was often greater than the one of manual location.
Due to the promising results already obtained with CNNs [21, 22], the aim of this study was to evaluate the accuracy of the CCNs-based approach for the automatic location of cephalometric landmarks on direct digital cephalometric X-rays. Thus the method proposed in [21, 22] has been extended in two respects: by improving the algorithms employed to detect 7 landmarks and by developing the algorithms needed to locate 3 additional landmarks (Porion, Basion, and Pterygoid point); of these latter, two especially difficult landmarks (Basion and Pterygoid point) that are used in the most common cephalometric analysis were located for the first time in literature. For an overall evaluation of the clinical viability of automated landmarking of this extended method, in this investigation the following null hypothesis was tested: there is no statistically significant difference in accuracy between the 10 landmarks automatically located by this approach and the “true” location of every landmark.
2. Materials and Methods
2.1. Image Sample
Forty-one lateral cephalometric radiograph files taken at the Orthodontic Department of Policlinico, University Hospital of Catania, Italy, were used in this study. A written informed consent to participate in the study, approved by the Ethical Committees of the relevant institution, was obtained from all subjects.
The radiograph files were randomly selected, disregarding the quality, from the patients currently undergoing orthodontic treatment within the department. Males and females were equally distributed in the sample. The type of occlusion and the skeletal pattern were, deliberately, not taken into consideration in the study design. The subjects were aged between 10 and 17 (mean age 14.8 years). Exclusion criteria were the following: obvious malpositioning of the head in the cephalostat, unerupted or missing incisors, no unerupted or partially erupted teeth that would have hindered landmark identification, patients with severe cranio facial deviations, and posterior teeth not in maximum intercuspation. X-ray files collection was approved by the Local Research Ethics Committee, and informed written consent was obtained from each subject.
The direct-digital cephalometric radiographs were obtained by a Siemens Orthophos DS Ceph (Sirona Dental, Bensheim, Germany).
This radiographic system uses a CCD sensor chip as an image receptor. The signals are acquired at a bit depth of 12 bit (4096 grey levels), but this is subsequently reduced in the default preprocessing procedure to 8 bits (256 grey levels). The resulting image is saved as TIFF file at 300 dpi; thus the pixel size in the image was 0.085 mm and the resolution was 11.8 pixels per mm. The exposure parameters for the digital cephalographs were 73 kV, 15 mA, and 15.8 seconds. According to the manufacturer's specifications, the machines provide focus-to-receptor distances of 1660 mm.
The digital images were stored on a Personal Computer with Intel Pentium IV, 3.2 GH with 2 GB RAM, 300 GB Hard Disk (ASUSTeK Computer Incorporated) with Microsoft Windows XP Professional Service Pack 2 as operating system and were displayed on a 19-inch flat TFT screen (Samsung SyncMaster 913 V), set to an average resolution of 1280 × 1024-pixel, with bandwidths between 60 and 75 HZ, and a dot pitch of 0.294 mm, with standard setting: 80% for contrast and 20% for brightness), at first to find the best estimate for each landmark and thereafter to obtain the cephalometric points automatically located. The TFT monitor was selected to prevent parallax errors.
2.2. Best Estimate for Cephalometric Landmarks
A software tool was designed and implemented in Borland C++ version 5.0 produced by Borland Software Corporation (Austin, Texas, USA). This software tool allowed the digitization of landmarks by experienced orthodontists directly on the X-ray shown on the monitor as well as their recording on an x-y system. Prior to the study the apparatus was checked for its accuracy by repeated recording of an image of known exact dimensions and by measuring known distances.
The 41 cephalograms were landmarked directly on the computer monitor, by experienced orthodontists to provide the best estimate. Five orthodontists with at least 6 years of clinical experience from the Orthodontic Department of Catania University evaluated the images. Their working experiences were 6 to 11 years (median 8 years). The observers were briefed on the procedure before image evaluation. An agreement was reached on the definitions of landmarks before carrying out this study, and these written definitions for each landmark were reviewed with and provided to the 5 evaluating participants (Table 1). All work was conducted in accordance with the Declaration of Helsinki (1964). A written consensus was obtained by all the participants.
Table 1.
Definitions of landmarks.
| Landmarks | ||
|---|---|---|
| Name | Abbreviation | Definition |
| Nasion | N | Anterior limit of sutura nasofrontalis |
| Subspinale | A Point | Deepest point on contour of alveolar projection between spinal point and prosthion |
| Basion | Ba | The most inferior point on the anterior border of the foramen magnum in the midsagital plane |
| Porion | Po | The most superiorly positioned point of the external auditory meatus |
| Pterygoid point | Pt | The intersection of the inferior border of the foramen rotundum with the posterior wall of the pterygomaxillary fissure |
| Supramentale | B Point | Deepest point on contour of alveolar projection between infradentale and pogonion |
| Pogonion | Pg | The most anterior point of symphysis |
| Protuberance menti- or suprapogonion | PM | A point selected where the curvature of anterior border of the symphysis changes from concave toconvex |
| Upper incisor edge | UIE | Incisal edge of the most anterior upper incisor |
| Lower incisor edge | LIE | Incisal edge of the most anterior lower incisor |
10 landmarks (Table 1) were target of automatic landmark identification; the observers were asked to identify them. Complete anonymity of the 41 films was maintained with image code names and random assignment of the images to study participants. Landmarks were pointed by using a mouse controlled cursor (empty arrow) linked to the tracing software in a dark room, the only illumination being from the PC-monitor itself. No more than 10 radiographs were traced in a single session to minimize errors due to the examiner's fatigue [25].
Every landmark was expressed as x (horizontal plane) and y (vertical plane) coordinates with an origin fixed to a given pixel. The “true” location of every landmark or best estimate was defined as the mean of these five records from the five observers. The mean clinicians' estimate was then used as a baseline to be compared with the cephalometric points detected by the automated system.
2.3. Cellular Neural Networks and Automatic Landmark Identification
The automatic analysis was undertaken once on each of the 41 images to detect the same 10 landmarks (Table 1). The approach used for automated identification of cephalometric points is based on Cellular Neural Networks (CNNs). CNNs [26–28] are a new paradigm for image processing. A CNN is an analog dynamic processor, where dynamics can be described either in a continuous manner (Continuous Time CNN or CT-CNN) or in a discrete manner (Discrete Time CNN or DT-CNN). CNNs are formed by a set of processing elements, called neurons, usually but not necessarily arranged along a matrix in two or more dimensions. Communication is allowed between elements inside a neighborhood, whose size is defined by the user. Feedback connections are allowed, but not recurrent ones. The dynamics of each neuron depends on the set of inputs on its state and produces one output (there are also CNN variations with multiple outputs).
In general, the state of a computational element is a linear combination of inputs and outputs. In this case we have linear CNN, the type used in this work. Since every neuron implements the same processing function, the use of CNN is suitable for image processing algorithms. In this work we deal with a 2D matrix topology. In this framework a cell in a matrix of M × N is indicated by C(i, j). The neighborhood of the interacting cells is defined as follows:
| (1) |
CNN dynamics is determined by the following equations, where x is the state, y the output, and I the input:
| (2) |
A compact representation of the CNN is by means of a string called “gene” that contains all the information needed for its simulation; for a 5 × 5 neighborhood this gene is represented by 51 real numbers: the threshold I, twenty five control (feed forward) coefficients for the B matrix (bi,j), and twenty five feedback coefficient for the A matrix.
The values in the A and B matrices correspond to the synaptic weights of a neural network structure. Matrices A and B are known, respectively, as feedback and control “templates,” and the way each CNN processes its input is determined by the values of these two “templates” and by the number of cycles of computation. Changing these parameters amounts to a different algorithm performed on the input matrix. CNNs are especially suitable for image processing tasks because they allow pixel by pixel elaboration taking into account the pixel neighborhood. Libraries of known templates for typical image processing operations are available [27, 29] and the sequential application of different templates can be used to implement complicated image processing algorithms.
To completely define the previous equations the boundary conditions for those cells whose neighborhood extends outside the input matrix must be specified. Typical boundary conditions are the Dirichlet (Fixed) boundary condition, in which a fixed (zero) constant value is assigned to the state xi,j to all cells that lie outside the input matrix, and the Neuman (zero flux) condition, in which the state xi,j of corresponding cells perpendicular to the boundaries is constrained to be equal to each other. Finally, equation (2) is fully defined if we specify the initial state xi,j(0) for all the cells. Frequent choices for this initial state matrix are all zero or equal to the input image.
Various CNN models have been proposed for medical image processing. In [30] the 128 × 128 CNN-UM chip has been applied to process X-rays, Computer Tomography, and Magnetic Resonance Image of the brain, by applying different CNN templates. Aizenberg et al. [28] discuss two classes of CNN, in particular binary CNN and Multivalued CNN, and their use for image filtering and enhancement. In [31] Gacsádi et al. presents image enhancement techniques such as noise reduction and contrast enhancement with CNN and discuss the implementation on chips.
Giordano et al. [21] applied CNN techniques to Cephalometric analysis. By choosing appropriate templates, chosen to take into account different X-ray qualities (in terms of brightness and contrast), all filtering task can be performed in a more robust and precise way. Then-edge based, region-based, and knowledge based tracking algorithms are used to find the different landmarks. This technique has also been used to find landmarks in partially hidden regions, such as Sella and Orbitale [22]. These studies have demonstrated that CNNs are versatile enough to be used also for the detection of landmarks that are not located on edges, but on low-contrast regions with overlapping structure. With respect to other image filters, such as the one obtained by applying to the image the Laplace, the Prewitt, or the Sobel operators, binary CNNs can obtain a more precise edge detection, especially in case of a small difference between brightness of the neighbor objects.
In this work, to locate the new landmarks Porion, Basion, and Pterygoid point an adaptive approach is proposed, by which the CNN parameters are chosen adaptively based on the type of landmark to be located and on the X-ray quality, this is followed by the application of algorithms for landmark location that encode knowledge about anatomical constraints and perform an adaptive search strategy.
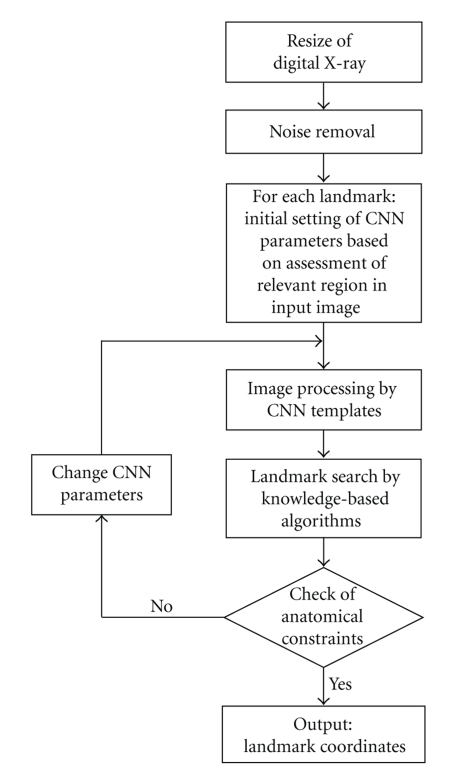
The software that performs the automated landmarking has two main processing modules: a CNN simulator that suitably preprocesses the digital X-ray accordingly to the landmark being sought, and a module containing a set of algorithms that apply anatomical knowledge (morphological constraints) to locate each landmark on the preprocessed image. The flow of computation is shown in Figure 1. A first image preprocessing step is applied in order to eliminate noise, and enhance brightness and image contrast. Then the method proceeds with a sequence of steps in which identification of the landmarks coordinates is done, for each point, by appropriate CNN templates followed by the application of landmark-specific search algorithms.
Figure 1.
Flow chart describing the steps of automatic detection of cephalometric points.
The CNN simulator has been developed in Borland C++ version 5.0 and proceeds with a sequence of steps in which the landmarks of Table 1 are identified in their x and y coordinates. A detailed description of the simulator and of the interface of the landmarking tool has been previously reported [21, 32]; in this work we use a new version that allows the landmarking of the three new points and also has additional facilities, such as allowing the user to define an arbitrary portion of the image to be processed, an adaptative brightness improvement algorithm, a contrast enhancement function, possibility to store the CNN output as initial state or as initial input value or both, and to allow the execution of an algorithm specified as a sequence of templates.
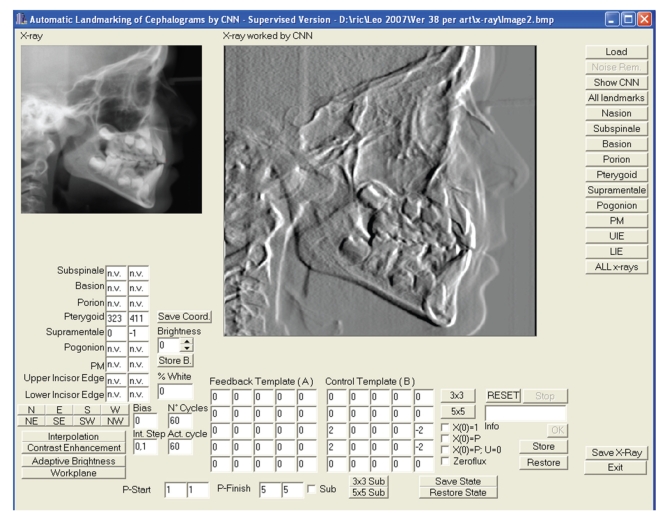
The simulator treats images of arbitrary dimension with 256 grey levels. The image is mapped to a CNN of the same size. The grey level of each image pixel is normalized in the interval (−1, 1) where −1 corresponds to white and 1 to black. The interface (Figure 2) allows to set the template parameters, the boundary conditions (Dirichlet the default, or zero-flux), the initial state X(0), and the input value U for each network cell. In the present work we use CNN output not necessarily in the steady state.
Figure 2.
The CNN simulator interface.
For this investigation new “knowledge-based” algorithms have been implemented, to locate new landmarks (Porion, Basion and Pterygoid point) and to improve landmark identification accuracy for the previously detected ones (Nasion, A point, B Point, Protuberance Menti, Pogonion, Upper Incisor Edge, and Lower Incisor Edge) [21, 22, 33, 34]. The feedback and control templates used by the software have been designed based on knowledge of CNN templates' behavior and subsequent fine-tuning. The search algorithms are based on a laterolateral head orientation but do not require a head calibration procedure or a fixed head position. A detailed description of each algorithm is given in the following.
2.4. Landmark Identification Algorithms
The CNNs are simulated, if not otherwise stated, under the following conditions: (1) initial state: every cell has a state variable equal to zero (xij = 0); (2) boundary condition: uij = 0 (Dirichlet contour). The majority of the feedback templates (A) used in this work are symmetrical, which ensures that operations reach a steady state, although in our approach we exploit the transient solutions provided by the CNNs. For these reasons number of cycles and integration steps become important information for point identifications. If not mentioned otherwise, we consider bias = 0; integration steps = 0.1; cycle 60. In the following we exemplify the methodology that has been used.
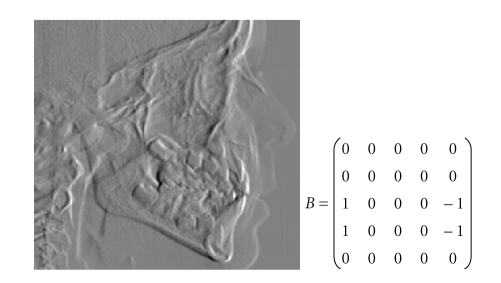
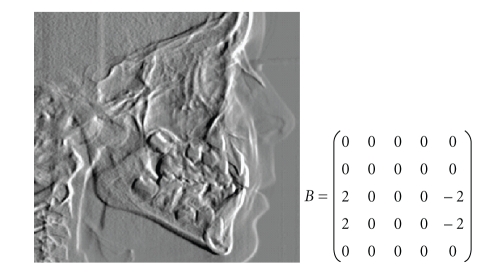
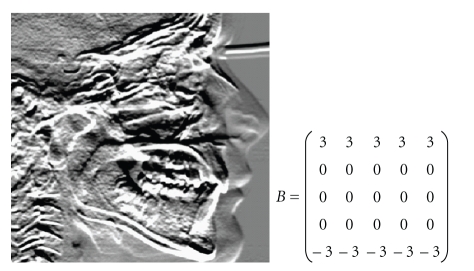
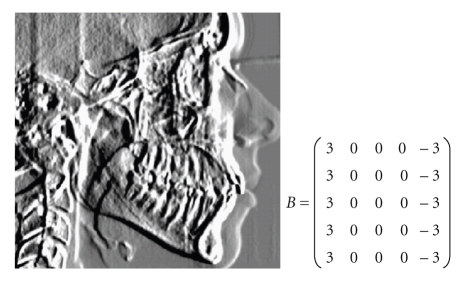
Since the incisors configuration variability is high, in this work a configuration where the up incisor is protruding with respect to the inferior one has been hypothesized. After noise removal and preprocessing, two steps are performed: the first one uses the control template reported in Figure 3, and the second one uses the control template reported in Figure 4. In both cases bias = −0.1; integration step = 0.2 and 60 cycles. With these templates both incisors are light up.
Figure 3.
First control template for incisors and CNN output.
Figure 4.
Second control template for incisors and CNN output.
From the CNN output we search for the more protruding tooth and hence find its tip. From this point we proceed for searching the tip of the second incisor that, under our hypothesis, is located downward. A simple extension will be to remove the hypothesis and find the tip in an ROI going upward or downward.
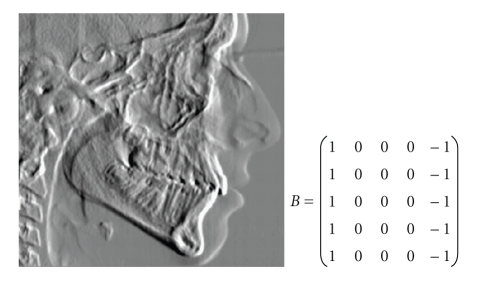
In order to find the points A and B we apply the template shown in Figure 5, with bias 0 and 25 cycles. The resulting image is shown in Figure 5.
Figure 5.
Control template for A and B points and CNN output.
The landmark search starts from the upper incisor, for which only a rough approximation of the landmark coordinates is needed, since the algorithm is robust even for error greater than 5 millimeters in up incisor location (error never experienced by our method in the processed X-rays). The A point is searched going up following the bone profile and stopping when the bone profile column stops decreasing (going to the left) and starts increasing (going to the right) or when a jump in the column coordinate of the profile is found. Differences in the luminosity level in the X-ray that produce a different output level in the CNN are taken into account by using a dynamic threshold to find the bone profile: a threshold of −0.99 that corresponds to a white normalized color is used to start; if there is not a pixel whit this level in the considered row, the threshold is increased by 0.01, until a bone pixel is found. The process is repeated for every row. Then the coordinates of the candidate A point are checked: if the point is too much to the left compared to the up incisor or too much up or near the up incisor the search is repeated by a more aggressive saturation: in the previous template the ±1 values are replaced with ±2 and the result is checked against the soft tissue profile, since a greater saturation also highlights the soft tissue profile.
For B point a similar procedure is used, but instead of going upward the bone profile is followed going downward from the up incisor; also in this case the checking procedure may lead to repeat the process with a more aggressive saturation. Soft tissue identification is avoided by comparing the column of the candidate with the column of the incisor: if the column of the candidate is too near or to the right to the incisor column, we have found a point in the soft tissue. The result is corrected by finding the first highlighted point in the same row but to the left (the bone). Soft tissue information could be used to overcome problems in finding the B point for symphysis of type B and D that present a flat or almost flat profile. In this case the soft tissue profile can guide the search in order to find the row and then from the located row search the column corresponding to the bone profile.
In order to find the Nasion two steps are needed: first the most anterior point in the frontal bone profile is located, and then from this point the bone profile is followed searching for the posterior point at the intersection with the nose bone profile. In order to find the most anterior point of the frontal bone after noise removal the image is binarized as shown in Figure 6.
Figure 6.
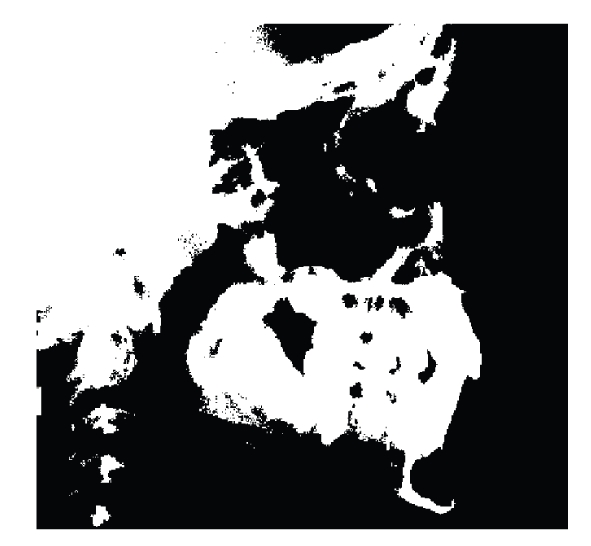
Binarized image for Nasion identification.
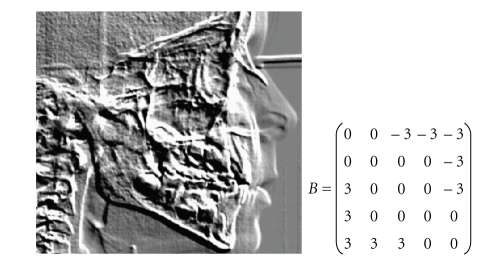
In the binarized X-ray we find the most anterior point of the frontal bone. Since binarization could lead to bone removal (as shown in Figure 6), the point is double checked by applying a similar search in the X-ray after applying the template in Figure 7 with bias = 0 and 25 cycles. The result is shown in Figure 7.
Figure 7.
Control template for Nasion and CNN output.
The posterior point in some cases could erroneously be located in the soft tissue. Thus a search for other highlighted pixels to the left is performed, and if a point to the left with a column value greater than the value found in the binarized image is found, this is taken as the posterior point in the frontal bone. As is shown in Figure 7, the template has highlighted the frontal bone profile and the nose profile. By following this profile, we search for the anterior point and the intersection between the frontal bone profile and the nose bone profile, that is, the Nasion. The found coordinates are checked: if Nasion coordinates are equal or too close to the posterior point of the frontal bone, we are dealing with an X-ray with a flat bone profile. In this case the search is repeated starting from few rows downward or by a less aggressive saturation (by replacing ±3 with ±2 in the previous template) since a greater saturation tends to flatten all the bone profiles.
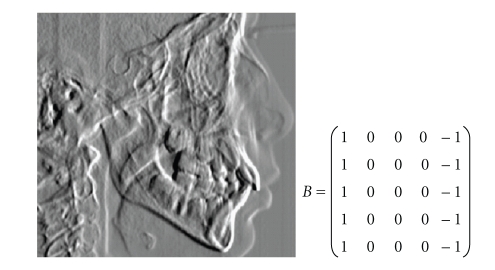
In order to find Pogonion and Protuberance Menti, first the jaw profile is highlighted by applying the template of Figure 8, with bias = 0 and 25 cycles, and is used as starting point for the search. The Pogonion and Protuberance Menti are found by following the bone up in the front profile. This profile is highlighted by a vertical derivate template, such as the one reported in Figure 5, with parameters depending on the luminosity level in the region of interest (ROI).
Figure 8.
Control Template for Pogonion and Protuberance Menti and CNN output.
In order to find the landmarks Basion and Porion, the preprocessing step aims to find the width of the spine including the soft tissue, its axis, and a bell-shaped region of interest (ROI) that, with high probability, will contain the Basion and Porion. To find this ROI the template of Figure 9 with bias 1.34 and 3 cycles is applied. Then a highlighted zone (values of the output <= threshold) is searched in the first 2/3 of the X-ray height and in the left half of X-ray width. The threshold is dynamically changed from a starting point of −0.99 until a region of white pixels of suitable size is found. Then a rounding of the zone is performed by cutting the tails of the bell-shaped area.
Figure 9.
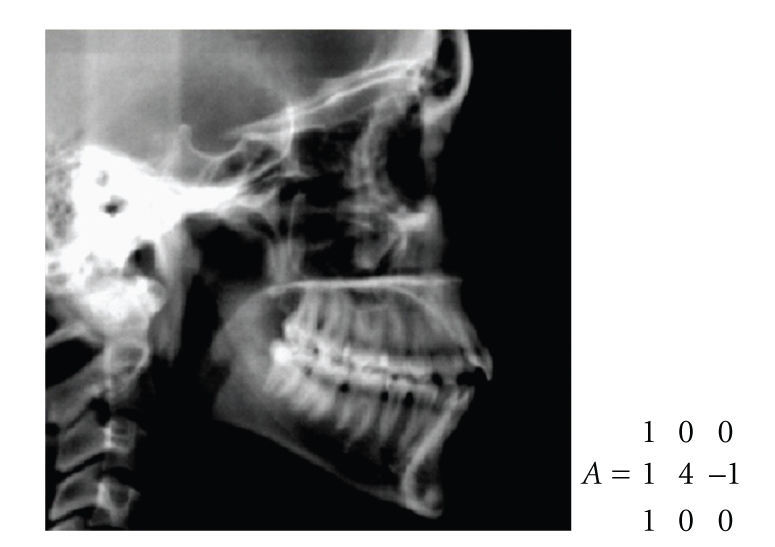
Feedback template and CNN output for the first step of the Basion algorithm.
The process is repeated with the same templates but with fewer cycles in order to give robustness to the algorithm and take into consideration differences in the X-rays quality. If the difference between the two procedures is too high, the second result is taken, otherwise the first one is taken since Basion lies at the bottom of the region: if the zone is too narrowed the searched point can be lost. This zone will be the ROI for Basion and Porion.
The width of the spinal column including the soft tissue is found by applying the template that corresponds to a vertical derivative that sharpens vertical edge. The template, applied with bias = 0 for 25 cycles, and its result are shown in Figure 10. The spine axis is used as a reference line.
Figure 10.
Control Template for the spine and CNN output.
The landmark Basion will be searched in the second half of the height of the found ROI for Basion and Porion landmarks. Its location is checked against anatomical constraints, in particular its distance from the spine and its upper bone, length of the occipital bone starting from the candidate Basion, and its position with respect to the spine axis. To locate the Basion we first apply the template in Figure 11 with bias = 0 for 25 cycles.
Figure 11.
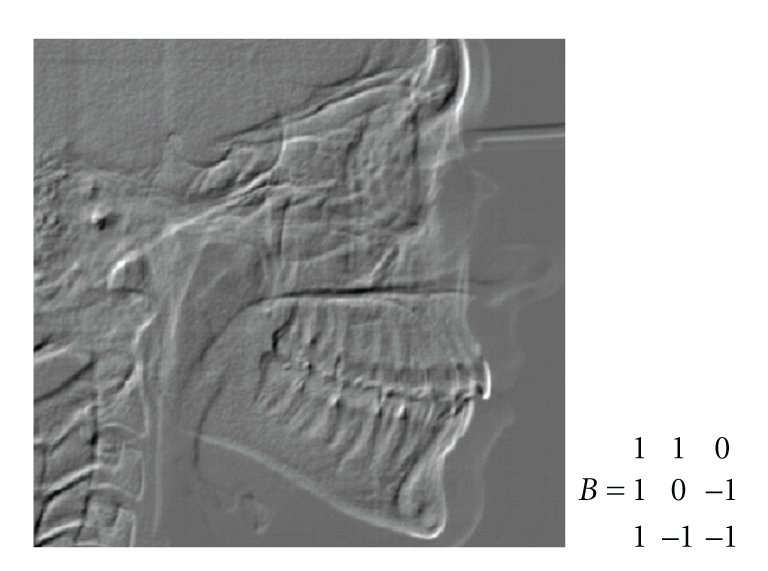
First Control Template for the Basion and CNN output.
This first CNN is able to highlight the Basion. The value of the template could be increased until at least a point in the ROI is highlighted. The CNN output is stored on the initial state of the CNN, and the template of Figure 12 is applied in order to follow the occipital bone (that must be present and have a sufficient length) and check the Basion against anatomical constraints. The template is applied with bias = 0.8 and 5 cycles.
Figure 12.
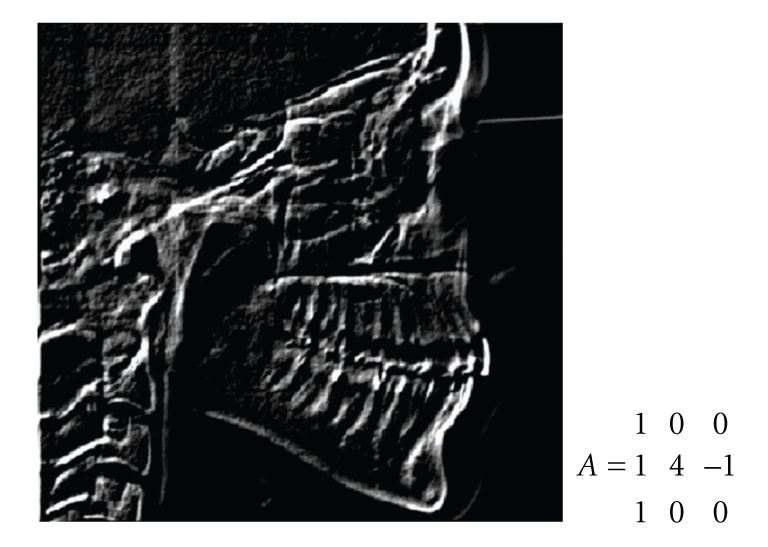
Second feedback template for the Basion and CNN output.
In order to find Porion, starting from the same ROI used to find Basion, the template shown in Figure 13 is applied, with bias 1.34 and 1 cycle; then the area is binarized and the inside is searched for black rounded shape spots resembling the auditory conduct. For better separation of the spots from the walls of the area the same template is re-applied with a greater number of cycles (2 cycles), the image is binarized, the spots are located, and the union with the black spots located with the previous template is performed. For each spot, parameters such as its area, its height, its width, its shape, and the center are determined. These parameters are used to discriminate between spots that correspond to auditory conducts and spots that are noise.
Figure 13.
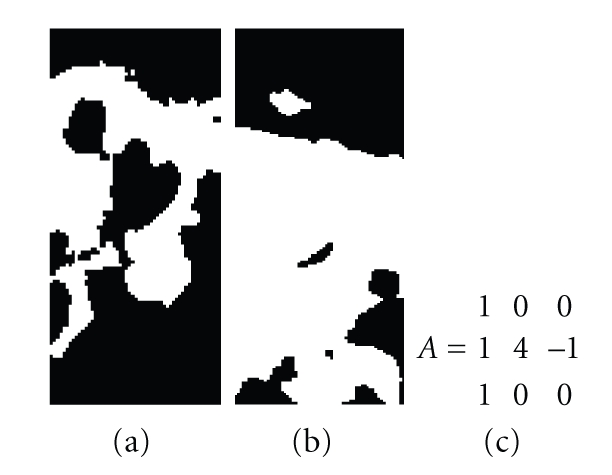
Feedback template for the Porion (c); binarized CNN output for one cycle (a) or 2 cycles (b).
Figure 13 shows the area binarized for the application of the template with 1 and 2 cycles. In this case the first template (result to the left) gives the best results. In other cases it is the second template that gives the best results.
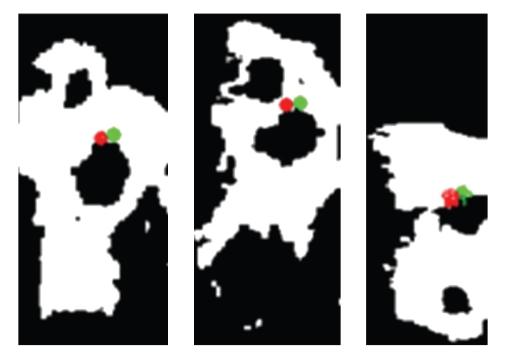
If the parameters of the spots do not satisfy anatomical constraints (i.e., area, or width, or height) or the located landmark is too far from the center of the spot where it lies the same template with an increased bias until the spots and the located landmark satisfy the anatomical constraints, the algorithm is able to correctly find the Porion landmark even if in the X-ray both the auditory conducts are visible. In this case the landmark is computed as the middle point between the two auditory conducts. Figure 14 shows the location of the automatically detected Porion (in green) and the expert location (in red) in three different cases.
Figure 14.
Three cases of automatic location of Porion. In red is the expert landmark, and in green is the automatic landmark.
In order to locate the Pterygoid point, first a ROI delimited by the right side of the Basion-Porion ROI and by the left most side of the ocular cavity is located. The ocular cavity is highlighted by applying the feedback template of figure 12 with bias = 1.34 and 3 cycles, followed by image binarization. The next step consists in locating the Pterygoid fissure; this is done in two steps: first we locate the right wall of the fissure by the template in Figure 15, with bias = 0 and 60 cycles.
Figure 15.
First control template for the Pterygoid fissure and CNN output.
The template parameters and the number of cycles are changed until the right wall of the Pterygoid fissure is detected, with a search constrained by distance from the orbital cavity. The left wall is searched by applying a CNN with similar templates but different parameters, and by using a dynamic threshold to differentiate between white and black pixels and to follow it until the upper part of the Pterygoid fissure is reached and hence the landmark is located. The landmark coordinates are checked against the distance from the right wall of the fissure. If the constraint is not satisfied, a recovery procedure, that depends on the distance between the landmark and the right wall of the fissure (too low or too high), is implemented by changing both the templates (more aggressive or less aggressive) and the threshold used to follow the highlighted wall of the fissure. Figure 16 shows the final computation with the Pterygoid fissure highlighted.
Figure 16.
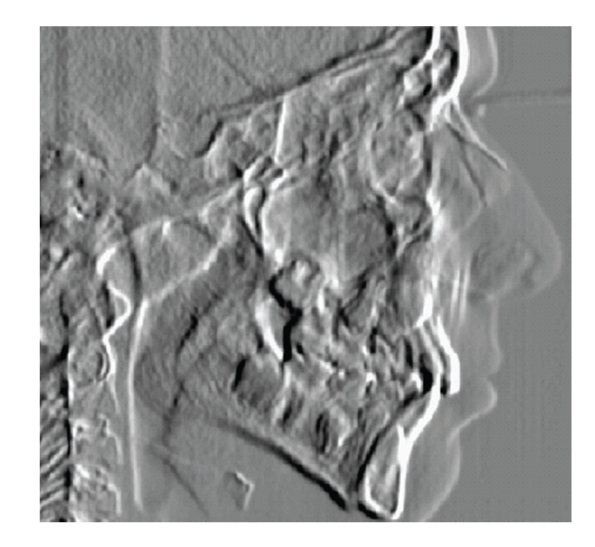
CNN final output and Pterygoid fissure.
2.5. Statistical Analysis
Landmarks from the automatic system's estimate with the best estimate (mean clinician's estimate) were compared in a horizontal (x) and vertical (y) coordinate system at first in pixels. Afterwards, the mean differences between methods were expressed in millimeters. The mean errors and standard deviations from the best estimate were calculated for each landmark. Mean errors in this study were defined as mean magnitude in distance between the best estimate and selected landmarks for all the 41 radiographs. The data set of point coordinates obtained from the landmarking software was screened for outliers, and for each landmark coordinate mean substitution was used for the missing data points.
Differences in the absolute mean errors of automatic landmarking and the best estimate were compared with a 1-way analysis of variance to test the null hypothesis that the mean errors obtained by automatic landmark detections are the same of mean value errors obtained by manual detection. If P < .05, the test rejects the null hypothesis at the α = 0.05 significance level.
All statistical analyses were done with the software Statistical Package for Social Science (SPSS Inc, Chicago, USA).
3. Results
Landmarks automatically detected and best estimates obtained from 41 randomly selected digital images were available for statistical analysis. A first indication on the rate of success of the method is provided by the analysis of the outliers. The number of outliers was different according to the point sought. For 4 of the points (Pogonion, Protuberance Menti, Upper Incisor edge, and Lower incisor edge) the percentage of outliers was less than 3% (0 or 1 case out of 41); for 3 points (Nasion, Basion, and Porion) it was less than 10% (3 or 4 cases out of 41); for 3 points (A Point, Pterygoid point and B Point) it was between 15% and 20% (6 to 8 cases out of 41). Table 2 gives the measurement differences between the 2 methods. Seven out of twenty measurements' errors were statistically significant (P < .05).
Table 2.
Mean difference between the average distance from the best estimate of landmark position of automated and manual landmarking, standard deviation (SD) (expressed in mm), and results of 1-way ANOVA test. NS indicates no statistically significant difference and the number of asterisks (∗) the level of significance.
| Landmark coordinates | Mean difference | Standard deviation (SD) | F-value | P-value (ANOVA) | S | |
|---|---|---|---|---|---|---|
| Nasion | X | 0.217 | ±0.441 | 5.076 | .027 | ∗ |
| Y | 0.483 | ±0.442 | 16.229 | .000 | ∗ ∗ | |
| A point | X | 0.596 | ±0.312 | 46.633 | .000 | ∗∗ ∗ |
| Y | 0.101 | ±0.282 | 0.484 | .489 | NS | |
| Basion | X | 0.181 | ±0.197 | 2.160 | .146 | NS |
| Y | 0.225 | ±0.112 | 2.538 | .115 | NS | |
| Porion | X | 0.003 | ±0.145 | 0.000 | .986 | NS |
| Y | 0.538 | ±0.257 | 24.051 | .000 | ∗∗ ∗ | |
| Pterygoid point | X | 0.157 | ±0.296 | 1.786 | .185 | NS |
| Y | 0.022 | ±0.033 | 0.0298 | .863 | NS | |
| B point | X | 0.161 | ±0.130 | 6.846 | .011 | ∗ |
| Y | 0.285 | ±0.402 | 2.762 | .101 | NS | |
| Pogonion | X | 0.038 | ±0.338 | 0.238 | .627 | NS |
| Y | 0.166 | ±0.033 | 1.385 | .243 | NS | |
| Protuberance Menti | X | 0.038 | ±0.226 | 0.314 | .577 | NS |
| Y | 0.245 | ±0.139 | 2.457 | .121 | NS | |
| Upper incisor edge | X | 0.172 | ±0.030 | 4.712 | .033 | ∗ |
| Y | 0.100 | ±0.371 | 0.283 | .596 | NS | |
| Lower incisor edge | X | 0.226 | ±0.226 | 4.582 | .035 | ∗ |
| Y | 0.283 | ±0.089 | 3.796 | .055 | NS | |
*Significance level .05.
**Significance level .01.
***Significance level .001.
However, the magnitude of mean errors between automatic identification of each landmark and the best estimate of cephalometric points was very small; in fact every error landmark automatically detected was found within 0.59 mm with respect to the best estimate. Only 1 measurement (A Point) had values above 0.5 millimeter on the X axis, and 1 measurement (Porion) above 0.5 millimeter on the Y axis (Table 2). The total time required to automatically extract all the ten landmarks from each individual X-ray was 4 minutes and 17 seconds.
4. Discussion
Our investigation was carried out on 41 randomly selected X-ray files of direct digital radiography, deliberately disregarding the quality in order to simulate clinical condition.
Errors between automatic identification of each landmark and the best estimate of cephalometric points were different in the horizontal (x) and vertical (y) coordinate system. Some cephalometric points yield better results on the horizontal (x) axis (Nasion, Pogonion, Porion, and Protuberance Menti,); others showed less error on the vertical (y) axis (A point and Pterygoid point). This is in line with the statement that the distribution of errors for many landmarks is systematic and follows a typical pattern (noncircular envelope) [35]. In fact it has been reported that some cephalometric landmarks are more reliable in the horizontal dimension while others are more reliable in the vertical dimension [35]. The reasons for these differences in distribution of landmark identification error are often related to the anatomical variability of the landmark location.
For 6 landmarks out of 10, it was possible to carry out a comparison with data on accuracy reported by a meta-analysis study [35]. Most of the points, automatically detected in our study, showed lower errors compared to findings obtained for each point by meta-analysis. A few points yielded slightly worse result. However, even if some differences between automatic detection and best estimate were statistically significant, the mean errors were so low to be, in most instances, clinically meaningless.
All in all, a better level of accuracy, with respect to our previous data [21, 22] and findings reported in literature [4] was obtained in this study. There could be at least two reasons for this improvement, namely, the use of a softcopy of the digital X-rays, (therefore, no need of analogue-to-digital conversion and an increased resolution of the X-ray file) and the use of improved algorithms that worked with the CNNs technique.
In fact, before the introduction of direct digital radiography or the indirect one through stored image transmission technology, digital forms of cephalometric images were obtained by indirect conversion of analogical X-rays, that is, by scanning hard copies of radiographs or using a video camera [25]. Every previous study on automatic cephalometric landmarks detection [4] was limited to these types of conversion, which not only required an additional time consuming step but could also introduce errors that lead to distortion [21, 23, 33].
Another issue with digital image is resolution, which has a significant impact on the outcome of automatic detection landmarks studies. The quality of a digital image is strongly dependent on the spatial resolution is, the relationship of grey level values of the pixels to the optical density of the radiograph and image display. The minimum resolution used by previous studies on automatic detection of landmarks may have contributed to the larger errors presented in their findings. The higher the resolution, the fewer landmark identification errors, automatic analysis will yield. The cost, however, is computation time and memory usage, unless there are used automatic techniques like ours that allow to the computerized systems to be implemented in a hardware chip form as reported previously [21], without penalizing time efficiency.
It should be underlined that these problems related to image resolution are encountered mainly, if not only, when an automatic search of landmarks is performed and not when the human eye is involved, because there are available optical systems that have higher resolution than the human optical system.
Although our method has some limitations that actually hinder clinical application, for example, the 10 cephalometric points detected are not enough to perform a cephalometric analysis, and errors of some of them are very close but not better than manual identification, it seems to have a promising future in automatic landmark recognition. Investigations on more landmarks to enable a complete automatic cephalometric analysis and on softcopy of cephalometric X-rays should be strongly encouraged as methods and techniques here presented may be of some help for a completely automated cephalometric analysis and if opportunely modified may be used one day in 3D cephalometry.
5. Conclusions
An acceptable level of accuracy in automatic landmark detection was obtained in this study, due to the use of a softcopy of the digital X-rays and the use of improved algorithms that worked with the CNNs technique.
The “null” hypothesis tested had to be rejected for some cephalometric points, respectively, on their x-or y-axis or both.
None of the differences in landmark identification error between the automatically detected and manually recorded points were greater than 0.59 mm. This indicates that any statistically significant difference between the two methods seems unlikely to be of clinical significance.
References
- 1.Broadbent BH. A new X-ray technique and its application to orthodontia. Angle Orthodontist. 1931;1:45–66. [Google Scholar]
- 2.Baumrind S, Miller DM. Computer-aided head film analysis: the University of California San Francisco method. American Journal of Orthodontics. 1980;78(1):41–65. doi: 10.1016/0002-9416(80)90039-1. [DOI] [PubMed] [Google Scholar]
- 3.Forsyth DB, Shaw WC, Richmond S, Roberts CT. Digital imaging of cephalometric radiographs—part 2: image quality. Angle Orthodontist. 1996;66(1):43–50. doi: 10.1043/0003-3219(1996)066<0043:DIOCRP>2.3.CO;2. [DOI] [PubMed] [Google Scholar]
- 4.Leonardi R, Giordano D, Maiorana F, Spampinato C. Automatic cephalometric analysis: a systematic review. Angle Orthodontist. 2008;78(1):145–151. doi: 10.2319/120506-491.1. [DOI] [PubMed] [Google Scholar]
- 5.Hutton TJ, Cunningham S, Hammond P. An evaluation of active shape models for the automatic identification of cephalometric landmarks. European Journal of Orthodontics. 2000;22(5):499–508. doi: 10.1093/ejo/22.5.499. [DOI] [PubMed] [Google Scholar]
- 6.Yue W, Yin D, Li C, Wang G, Xu T. Automated 2-D cephalometric analysis on X-ray images by a model-based approach. IEEE Transactions on Biomedical Engineering. 2006;53(8):1615–1623. doi: 10.1109/TBME.2006.876638. [DOI] [PubMed] [Google Scholar]
- 7.Lévy-Mandel AD, Venetsanopoulos AN, Tsotsos JK. Knowledge-based landmarking of cephalograms. Computers and Biomedical Research. 1986;19(3):282–309. doi: 10.1016/0010-4809(86)90023-6. [DOI] [PubMed] [Google Scholar]
- 8.Parthasarathy S, Nugent ST, Gregson PG, Fay DF. Automatic landmarking of cephalograms. Computers and Biomedical Research. 1989;22(3):248–269. doi: 10.1016/0010-4809(89)90005-0. [DOI] [PubMed] [Google Scholar]
- 9.Forsyth DB, Davis DN. Assessment of an automated cephalometric analysis system. European Journal of Orthodontics. 1996;18(5):471–478. doi: 10.1093/ejo/18.5.471. [DOI] [PubMed] [Google Scholar]
- 10.Romaniuk B, Desvignes M, Revenu M, Deshayes M-J. Shape variability and spatial relationships modeling in statistical pattern recognition. Pattern Recognition Letters. 2004;25(2):239–247. [Google Scholar]
- 11.Rudolph DJ, Sinclair PM, Coggins JM. Automatic computerized radiographic identification of cephalometric landmarks. American Journal of Orthodontics and Dentofacial Orthopedics. 1998;113(2):173–179. doi: 10.1016/s0889-5406(98)70289-6. [DOI] [PubMed] [Google Scholar]
- 12.Chen Y-T, Cheng K-S, Liu J-K. Improving cephalogram analysis through feature subimage extraction. IEEE Engineering in Medicine and Biology Magazine. 1999;18(1):25–31. doi: 10.1109/51.740961. [DOI] [PubMed] [Google Scholar]
- 13.Cardillo J, Sid-Ahmed MA. An image processing system for locating craniofacial landmarks. IEEE Transactions on Medical Imaging. 1994;13(2):275–289. doi: 10.1109/42.293920. [DOI] [PubMed] [Google Scholar]
- 14.Ciesielski V, Innes A, Sabu J, Mamutil J. Genetic programming for landmark detection in cephalometric radiology images. International Journal of Knowledge-Based and Intelligent Engineering Systems. 2003;7:164–171. [Google Scholar]
- 15.Sanei S, Sanaei P, Zahabsaniei M. Cephalogram analysis applying template matching and fuzzy logic. Image and Vision Computing. 1999;18(1):39–48. [Google Scholar]
- 16.El-Feghi I, Sid-Ahmed MA, Ahmadi M. Automatic localization of craniofacial landmarks for assisted cephalometry. Pattern Recognition. 2004;37(3):609–621. [Google Scholar]
- 17.Liu J-K, Chen Y-T, Cheng K-S. Accuracy of computerized automatic identification of cephalometric landmarks. American Journal of Orthodontics and Dentofacial Orthopedics. 2000;118(5):535–540. doi: 10.1067/mod.2000.110168. [DOI] [PubMed] [Google Scholar]
- 18.Grau V, Alcañiz M, Juan MC, Monserrat C, Knoll C. Automatic localization of cephalometric landmarks. Journal of Biomedical Informatics. 2001;34(3):146–156. doi: 10.1006/jbin.2001.1014. [DOI] [PubMed] [Google Scholar]
- 19.Yang J, Ling X, Lu Y, Wei M, Deng G. Cephalometric image analysis and measurement for orthognatic surgery. Medical and Biological Engineering and Computing. 2001;39:279–284. doi: 10.1007/BF02345280. [DOI] [PubMed] [Google Scholar]
- 20.Stamm T, Brinkhaus HA, Ehmer U, Meier N, Bollmann F. Computer-aided automated landmarking of cephalograms. Journal of Orofacial Orthopedics. 1998;59(2):73–81. doi: 10.1007/BF01340641. [DOI] [PubMed] [Google Scholar]
- 21.Giordano D, Leonardi R, Maiorana F, Cristaldi G, Distefano ML. Automatic landmarking of cephalograms by cellular neural networks. In: Proceedings of the 10th Conference on Artificial Intelligence in Medicine (AIME '05), vol. 3581; July 2005; Aberdeen, Scotland. pp. 333–342. Lecture Notes in Computer Science. [Google Scholar]
- 22.Giordano D, Leonardi R, Maiorana F, Spampinato C. Cellular neural networks and dynamic enhancement for cephalometric landmarks detection. In: Proceedings of the 8th International Conference on Artificial Intelligence and Soft Computing (ICAISC '06), vol. 4029; June 2006; Zakopane, Poland. pp. 768–777. Lecture Notes in Computer Science. [Google Scholar]
- 23.Bruntz LQ, Palomo JM, Baden S, Hans MG. A comparison of scanned lateral cephalograms with corresponding original radiographs. American Journal of Orthodontics and Dentofacial Orthopedics. 2006;130(3):340–348. doi: 10.1016/j.ajodo.2004.12.029. [DOI] [PubMed] [Google Scholar]
- 24.Schulze RKW, Gloede MB, Doll GM. Landmark identification on direct digital versus film-based cephalometric radiographs: a human skull study. American Journal of Orthodontics and Dentofacial Orthopedics. 2002;122(6):635–642. doi: 10.1067/mod.2002.129191. [DOI] [PubMed] [Google Scholar]
- 25.Santoro M, Jarjoura K, Cangialosi TJ. Accuracy of digital and analogue cephalometric measurements assessed with the sandwich technique. American Journal of Orthodontics and Dentofacial Orthopedics. 2006;129(3):345–351. doi: 10.1016/j.ajodo.2005.12.010. [DOI] [PubMed] [Google Scholar]
- 26.Chua LO, Roska T. The CNN paradigm. IEEE Transactions on Circuits and Systems I. 1993;40(3):147–156. [Google Scholar]
- 27.Roska T, Kek L, Nemes L, Zarandy A, Szolgay P. CSL CNN Software Library (Templates and Algorithms) Budapest, Hungary: 1999. [Google Scholar]
- 28.Aizenberg I, Aizenberg N, Hiltner J, Moraga C, Meyer Zu Bexten E. Cellular neural networks and computational intelligence in medical image processing. Image and Vision Computing. 2001;19(4):177–183. [Google Scholar]
- 29.Yang T. Handbook of CNN Image Processing. Yang's Scientific Research Institute LLC; 2002. [Google Scholar]
- 30.Szabo T, Barsi P, Szolgay P. Application of analogic CNN algorithms in telemedical neuroradiology. In: Proceedings of the 7th IEEE International Workshop on Cellular Neural Networks and Their Applications (CNNA '02); 2002; pp. 579–586. [Google Scholar]
- 31.Gacsádi A, Grava C, Grava A. Medical image enhancement by using cellular neural networks. Computers in Cardiology. 2005;32:821–824. [Google Scholar]
- 32.Giordano D, Maiorana F. A grid implementation of a cellular neural network simulator. In: Proceedings of the 16th IEEE International Workshop on Enabling Technologies: Infrastructure for Collaborative Enterprises (WETICE '07); 2007; Paris, France. pp. 241–246. [Google Scholar]
- 33.Geelen W, Wenzel A, Gotfredsen E, Kruger M, Hansson L-G. Reproducibility of cephalometric landmarks on conventional film, hardcopy, and monitor-displayed images obtained by the storage phosphor technique. European Journal of Orthodontics. 1998;20(3):331–340. doi: 10.1093/ejo/20.3.331. [DOI] [PubMed] [Google Scholar]
- 34.Chen Y-J, Chen S-K, Yao JC-C, Chang H-F. The effects of differences in landmark identification on the cephalometric measurements in traditional versus digitized cephalometry. Angle Orthodontist. 2004;74(2):155–161. doi: 10.1043/0003-3219(2004)074<0155:TEODIL>2.0.CO;2. [DOI] [PubMed] [Google Scholar]
- 35.Trpkova B, Major P, Prasad N, Nebbe B. Cephalometric landmarks identification and reproducibility: a meta analysis. American Journal of Orthodontics and Dentofacial Orthopedics. 1997;112(2):165–170. doi: 10.1016/s0889-5406(97)70242-7. [DOI] [PubMed] [Google Scholar]


