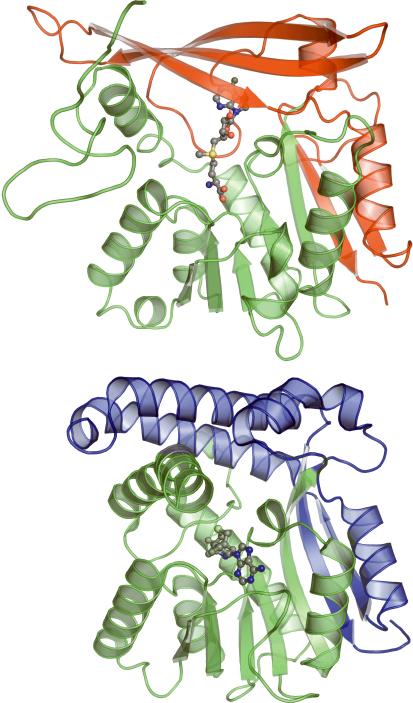
Figure 8.
Ribbon diagrams of GsSDMT (above) and GNMT (below) illustrating the difference in cofactor binding between the two enzymes. Color is used to define the structurally similar amino terminals of the proteins (green) as well as the structurally divergent carboxy terminals (blue in GsSDMT and red in GNMT). The placement of the cofactor (carbon:gray, sulfur:yellow, nitrogen:blue, oxygen:red) in GsSDMT is predicted based on the structure of MMAS2.

