Abstract
We simulate the assembly dynamics of icosahedral capsids from subunits that interconvert between different conformations (or quasi-equivalent states). The simulations identify mechanisms by which subunits form empty capsids with only one morphology, but adaptively assemble into different icosahedral morphologies around nanoparticle cargoes with varying sizes, as seen in recent experiments with brome mosaic virus (BMV) capsid proteins. Adaptive cargo encapsidation requires moderate cargo-subunit interaction strengths; stronger interactions frustrate assembly by stabilizing intermediates with incommensurate curvature. We compare simulation results to experiments with cowpea chlorotic mottle virus empty capsids and BMV capsids assembled on functionalized nanoparticles, and suggest new cargo encapsidation experiments. Finally, we find that both empty and templated capsids maintain the precise spatial ordering of subunit conformations seen in the crystal structure even if interactions that preserve this arrangement are favored by as little as the thermal energy, consistent with experimental observations that different subunit conformations are highly similar.
Introduction
During the replication of many viruses, hundreds to thousands of protein subunits assemble around the viral nucleic acid to form a protein shell called a capsid. In vitro studies show that capsid proteins can form particular empty capsid structures with high fidelity;1 yet capsids adopt different morphologies when challenged with nucleic acids2 or other cargoes3–5 with sizes that are not commensurate with the preferred capsid structure. No proposed dynamical mechanism simultaneously explains precise assembly of empty capsids and adaptable encapsidation of cargoes. Understanding how viral components selectively assemble into the structure required for infectivity could spur the development of antiviral therapies that block or alter assembly. At the same time, engineered structures in which viral capsids assemble around synthetic cargoes show great promise as delivery vehicles with adaptable sizes for drugs or imaging agents,6 and as subunits or templates for the synthesis of nanomaterials with exquisitely controlled sizes and morphologies.7 Realizing these goals, however, requires understanding how properties of cargoes and capsid proteins dynamically determine the size and morphology of an assembled structure to enable adaptable assembly.
In this work, we explore the interplay between cargo size and the morphology of icosahedral capsids with coarse-grained models that describe both the dynamic encapsidation of functionalized nanoparticles and the assembly of empty capsids. Through our simulations, we uncover a mechanism by which subunits faithfully assemble into empty capsids with a single icosahedral morphology, but also reproducibly assemble into different morphologies around nanoparticles with varying sizes, as seen in recent experiments.3 The model predicts that adaptability to cargo size is nonmonotonic with respect to the strength of subunit-cargo interactions. This prediction can be tested in nanoparticle-capsid assembly experiments by varying the functionalized surface charge density on nanoparticles.8
Assembly of icosahedral viruses
While at most 60 identical subunits can be arranged with icosahedral symmetry, Caspar and Klug showed that multiples of 60 proteins can form icosahedral capsids, if individual proteins take slightly different, or quasi-equivalent, conformations.9 These quasiequivalent conformations break the local 3-fold symmetry of the icosahedral face but, by assembling with precise spatial ordering of conformations, preserve the global icosahedral symmetry of the capsid. Despite their different geometry, the proteins interact with each other by interfaces that are substantially similar across different conformations. A complete capsid is comprised of 60T subunits, where T is the number of distinct protein conformations (see 2).
Although recent experiments10 have begun to characterize subunit conformations during assembly and equilibrium theories have led to important extensions of quasi-equivalence,11 the process by which the appropriate quasi-equivalent conformations are chosen during assembly remains poorly understood. Berger and coworkers12 showed that Caspar-Klug structures result if assembly follows “local rules”, in which only subunits with the conformation dictated by adjacent subunits can bind to an assembling capsid. There are two experimental observations, however, that seem difficult to rationalize with conformation-dependent interactions. (1) How can subunit-subunit binding be conformation-specific for viruses in which subunit binding interfaces show little variation between conformations in capsid crystal structures (e.g. see 3 and Ref.13)? (2) How can subunits that assemble with conformational specificity adapt to form capsids with different icosahedral morphologies around commensurate cargoes? For example, Dragnea and coworkers3,14 have demonstrated that brome mosaic virus (BMV) proteins assemble into T=1, pseudo-T2, and T=3 capsids around functionalized nanoparticle cores with different diameters that are functionalized with carboxylated polyethylene glycol.
We explore both of these questions here with a model for the assembly of T=1 and T=3 capsids from subunits that can interconvert between different conformations, with which we simulate the spontaneous assembly of empty capsids and the encapsidation of nanoparticles that template assembly of T=1 or T=3 capsids. By systematically varying the extent to which binding between subunits depends on conformation, we show that even a weak conformational dependence (≈ kBT) enables robust assembly. In addition, we find that an intrinsic bias for subunits to adopt particular conformations, as suggested by recent experiments,13 can control which icosahedral morphology is favored. We show that requiring the model to reproduce experimental observations for both empty and full capsids places tight constraints on model parameters, and thereby enables insights about morphology control in both systems. In particular, we find a narrow, but physically reasonable, range of parameters for which only T=3 empty capsids assemble, but T=1 capsids form on a commensurate nanoparticle.
Model
We extend a class of models for T=1 capsids15,16 (see Refs.17 for related models), in which subunits have spherically symmetric excluded volume and short-ranged, directional attractions between complementary interfaces. These interfaces are represented as ‘bond-vectors’ that rotate rigidly within the subunit frame of reference; we design their geometry such that the subunits tile an icosahedron according to capsid crystal structures. Thus, the lowest energy collective configurations correspond to “capsids” with 60T monomers in a shell with icosahedral symmetry.
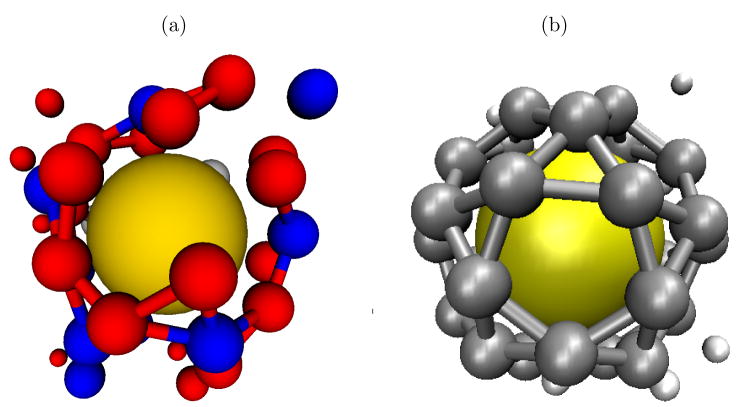
We focus on models for T=1 and T=3 capsids, for which the bond vector geometries are based on crystal structures of T=118 and T=319 BMV capsids. Each subunit represents a protein dimer, the basic assembly unit for BMV.20 The relative positions and conformations of subunits in a capsid are determined by associating each two-fold or quasi-two-fold dimer interface with a subunit center, as depicted in 2. The orientations of bond-vectors and their complementarity are then determined from the relative locations of neighboring dimers; as shown in 2 each interface between neighboring subunits is associated with a pair of complementary bond vectors. The resulting internal coordinates and list of complementary bond vectors are specified in the SI.
Pair interaction
The attractive interaction between two complementary bond-vectors bi and bj (see 1) is minimized when (1) the distance between the bond-vectors is minimized, (2) the angle between them, , is minimized and (3) the dihedral angle, , calculated from two secondary bond-vectors which are not involved in the primary interaction (see the SI and16), is minimized. Requirement (3) creates an interaction that resists torsion and therefore enforces angular specificity in the plane perpendicular to the bond vector. The potential is given by equations (1) through (5)
| (1) |
| (2) |
| (3) |
| (4) |
| (5) |
where the index b sums over pairs of complementary bond vectors, Θ (x) is the Heaviside step function, R is the subunit center-to-center distance, ℒ(x) is a ‘Lennard-Jones function’, and the cutoff values are rc = 2.5, θc = 1 and φc = π throughout this work. Throughout this work, lengths have units of σ, the subunit diameter, energies have units of kBT and times have units of t0 = σ2/D, where D is the subunit diffusion constant. Concentrations are defined as c0 = Nσ3/L3 with N subunits and box side length L.
Conformation dependence of subunit-subunit binding energies
We follow convention9 by labeling the different protein (monomer) conformations found in the BMV or CCMV crystal structure as A, B, and C. A T=3 capsid is comprised of 30 CC and 60 AB dimer subunits, while 30 AA dimer subunits comprise a T=1 capsid; the structure of an A protein monomer visible in the T=3 CCMV capsid crystal structure is virtually identical to the structure of monomers in the T=1 crystal structure.21 For simplicity, we assume that dimer configurations not present in the crystal structures (e.g. AC, BB) are highly unfavorable and thus do not occur.
If the subunit binding interactions have strict conformational specificity, then subunits i and j can only bind via a particular interface b ONLY if the i and j have conformational states that interact via that interface in the crystal structure (see 2). As noted above, however, there is not strong evidence to support such strict conformational specificity. Therefore, we take (Eq. 3) if the conformations of subunits i and j are found in the crystal structure for interface b, and otherwise, where the promiscuity parameter χs varies from 0 for strict conformational specificity to 1 for no conformational specificity at all.
To capture the ability of BMV to form both T=1 and T=3 structures, we allow subunits to change conformation during the simulation. For simplicity, we model the transitions as discrete events with no intermediate states, implying that subunit conformations are separated by an activation barrier. These moves are accepted according to the Metropolis condition:
| (6) |
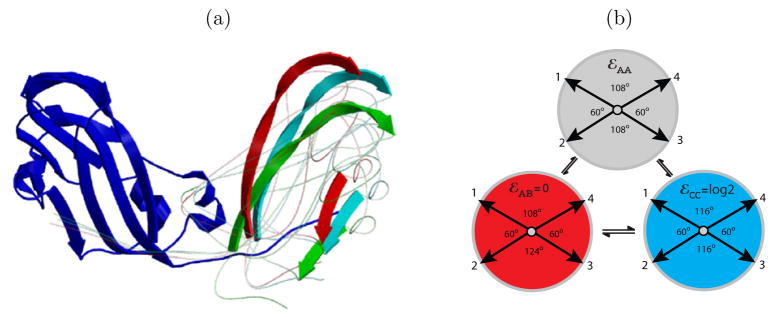
where ΔU is the change in the interaction energy and Δε is the intrinsic free energy difference between conformational states, which might correspond to the energies associated with different hinge angles described in Ref.13 (see 3). We set the energy of AB 0 and the CC energy to log 2 (because it is symmetric). We vary the remaining energy, εAA, between 0 and 2.5. For simplicity, we do not consider pseudoT=2 capsids in this work, which unlike T=1 and T=3 capsids, involve binding interfaces that are not seen in infectious CCMV viruses.13
Core-controlled assembly
Motivated by recent experiments in which BMV capsid proteins encapsidate functionalized gold nanoparticles,14 we introduce a rigid sphere with radius Rs at the center of the simulation. The sphere interacts with the subunits via a spherically symmetric Lennard-Jones potential, shifted so that a subunit at the surface of the sphere has minimum energy
| (7) |
where reff ≡ r−Rs with r the nanoparticle-subunit center-to-center distance, and εs specifies the strength of the subunit-sphere interaction; we consider the range εs/kBT ∈ [6, 12]. We consider nanoparticles with Rs = 1.7 and Rs = 3.2, which are commensurate with T=1 and T=3 model capsids, respectively.
Dynamics simulations
We evolve particle positions and orientations with over-damped Brownian dynamics using a second order predictor-corrector algorithm.22 We intersperse conformational Monte-Carlo moves with dynamics integration steps such that, on average, each particle attempts to change conformation with frequency *γc = (40t0)−1. When there is a nanoparticle present we simulate a bulk solution with concentration c0 by performing grand canonical Monte Carlo moves in which subunits far from the nanoparticle are exchanged with a reservoir at fixed chemical potential with frequency consistent with the diffusion limited rate.16 Since only a single nanoparticle is considered in each simulation, interactions between nanoparticles are not considered – finite nanoparticle concentrations are considered in Ref.23 Empty capsid simulations have N = 1000 subunits in a box with side length L = 22.5σ.
Results
Empty capsids
In order to understand which system parameters control assembly morphology, we performed dynamical empty capsid simulations for varying values of the conformational free energy, εAA, and the conformation specificity parameter, χs, which controls the conformational dependence of subunit-subunit binding energies. Prior work15 has shown that assembly yields are nonmonotonic in the parameters that control the driving forces for assembly, the binding energy, εb, and the angular tolerance, θc. For empty capsid simulations in this work, we consider only optimal values of these parameters, εb = 12.0, θc = 1.0, for which subunits that are capable of forming only a single morphology assemble with high fidelity.16
The conformational free energy controls polymorphism in empty capsid assembly
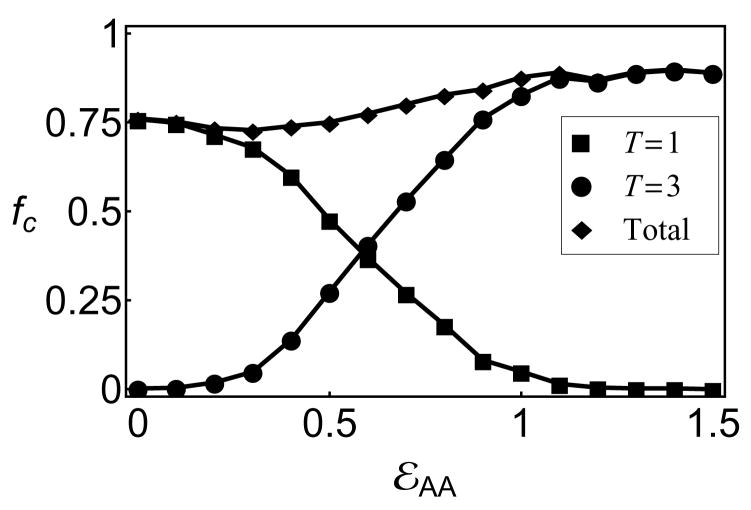
As a measure of morphology control, we monitor the fraction of subunits in T=1 and T=3 capsids, which are defined as connected clusters comprising 30 or 90 subunits, respectively, in which each subunit has 4 bonds. The yield of each morphology as a function of the conformational free energy, εAA, is shown in 4 for an observation time of 200, 000t0, at which point assembly has roughly saturated. We observe a crossover from high yields of T=1 capsids for εAA < 0 to predominantly T=3 capsids for εAA > 1.0, with mixed morphologies in the intermediate region.
Although the transition between T=1 and T=3 capsids only requires a change in the conformational free energy of approximately the thermal energy, kBT, the width of the transition is consistent with kinetic rather than thermodynamic control of the dominant morphology. As shown in Fig 6b of the SI, fitting the fraction of subunits in T=1 capsids, fT1 to the form fT1(εAA) = 1/(1 + 3 log 2 exp[−nc(εAA − log 2)]), yields a ‘critical’ size for morphology determination of Nc ∈ [6.5, 8.0], while an equilibrated system would give a much sharper transition with nc = 30.
To better understand this result, we estimated the size of a “critical nucleus”, or an intermediate which is more likely to grow into a complete capsid then to dissociate into free subunits. A simulation with 10,000 subunits was run until many small assembly intermediates (2–12 subunits) assembled. From that configuration, further simulations were integrated with different random number seeds, and each initial intermediate was tracked in every simulation. We then estimate the “commitor probability” for each intermediate as the fraction of simulations in which it grows to completion before dissociating. The average commitor probability as a function of intermediate size (figure 6a in the SI) suggests that the critical nucleus is 7, which is consistent with the critical morphology size estimated above. We note, however, that this value is only a rough estimate, since the identity of critical nuclei depends on additional parameters, such as the number of bonds and closed polygons – i.e. the intermediate size alone is not sufficient for a good reaction coordinate.
Faithful assembly requires only weak conformational specificity
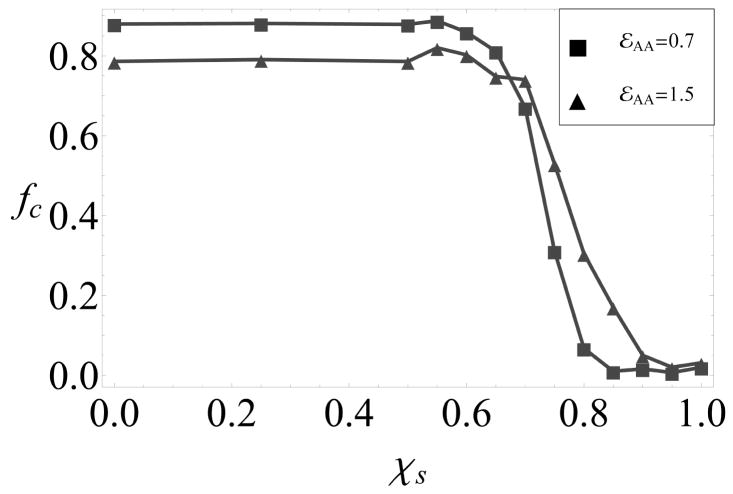
As shown in 4, varying the intrinsic conformational free energy, εAA, leads to different morphologies, but does not significantly affect the yields of well-formed icosahedrons. As shown in 5, assembly yields are also insensitive to the conformation specificity for χs ≲ 75%, while higher values (indicating less specificity) lead to predominantly malformed capsids. These malformed capsids are primarily closed but strained structures with disordered arrangements of pentamers and hexamers that do not have icosahedral symmetry (see Figs. 2a and 2b in the SI).
Core-controlled assembly
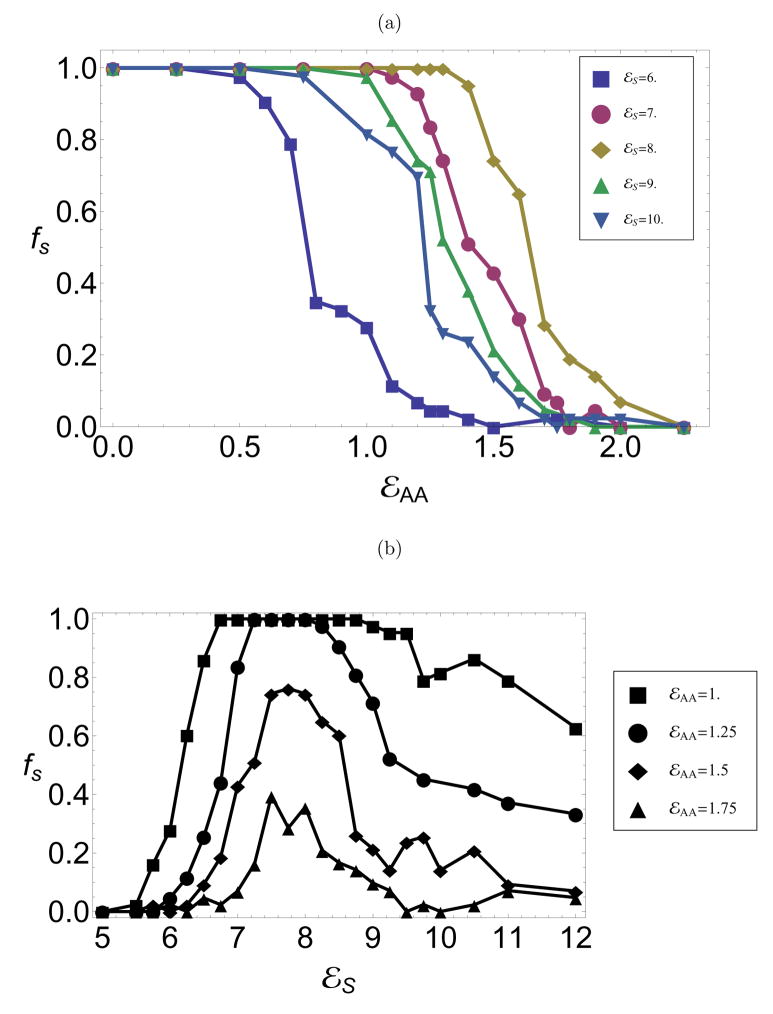
To understand the effect of cargo properties on morphology, we simulated assembly in the presence of a model nanoparticle with varying conformational free energy, εAA, and core-subunit attraction strength, εs. Optimal conditions for the nanoparticle encapsidation experiments have higher pH and thus weaker subunit-subunit binding interactions than empty capsid experiments.8 Therefore, when simulating assembly with a model nanoparticle, we consider subunit-subunit binding parameters of εb = 10.0, θc = 1.0 for which assembly is favorable on the nanoparticle, but no spontaneous assembly in bulk solution occurs.16 As a measure of assembly effectiveness, we monitor the packaging efficiency, fs, which is defined as the fraction of independent trajectories in which a well-formed capsid assembles on the nanoparticle. Consistent with prior work,16 parameter values that lead to a single morphology of empty capsids enable efficient encapsidation of a commensurate sphere with ≈ 100% efficiency. To understand polymorphism, we monitor packaging efficiencies around a T=1 sized sphere while varying the conformational free energy from values that favor T=1 empty capsids (εAA ≲ 0.25) to values favoring T=3 empty capsids (εAA ≳ 1). The results are shown in 6a for several core-subunit interaction strengths. At each εs, there is a relatively sharp crossover from high yields to no successful assembly. Significantly, for optimal values of εs, there is a range of 1 ≲ εAA ≲ 1.5 for which spontaneous assembly faithfully produces T=3 capsids, but T=1 capsids form on the nanoparticle with high efficiency.
Mechanisms of core-controlled polymorphism
In contrast to assembly around a commensurate sphere,16 packaging efficiencies do not increase monotonically with core-subunit interaction strength (εs), as shown for several values of εAA in 6b. Assembly yields that are nonmonotonic with the variation of an interaction parameter are a hallmark of competition between thermodynamics and kinetics. At low εs, the core-subunit interaction strength is not large enough to stabilize a T=1 capsid nucleus and so T=1 assembly is either thermodynamically unfavorable or has an insurmountable activation barrier. At high εs, on the other hand, capsid nuclei of any morphology are stabile and T=3 partial capsids are common. Beyond a certain size, subunits that add to an incommensurate (T=3) partial capsid cannot simultaneously interact strongly with the core surface and subunits already in the intermediate (see 7a). For the parameters considered, subunit-subunit interactions are too weak to drive significant assembly away from the attractive core surface, and assembly is frustrated. At high εs, however, the partial capsid is metastable and blocks a significant fraction of the core surface, thus hindering the formation of potentially productive T=1 nuclei.
At optimal strengths of the core-subunit interaction, partial capsids undergo significant size uctuations because subunit unbinding is frequent. Therefore, many nuclei can form on a given sphere within the observation time, until a T=1 nucleus grows to completion. 7a shows a metastable partial capsid forming on an incommensurate size sphere which eventually disassembles, allowing a T=1 capsid to grow to completion (7b).
Time scale for annealing of surface-adsorbed complexes
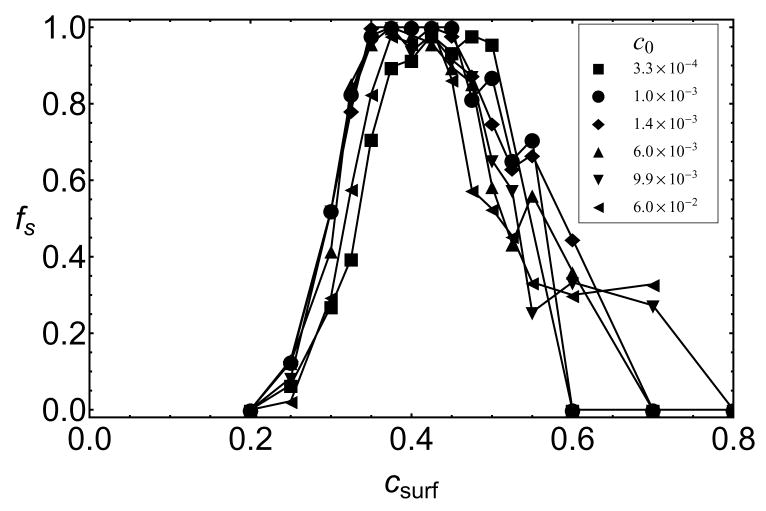
We simulated assembly with a T=1-size nanoparticle over a wide range of subunit concentrations, 3 × 10⁻⁴ < c0 < 0.06, which corresponds to a range of 7 – 1000 μM for a dimer subunit diameter of 4.2 nm. The analysis in Ref.16 suggests that nanoparticle systems with different εs and c0 should be compared in terms of csurf, the equilibrium surface concentration of subunits with no assembly†. The equilibrium surface concentration can be determined from simulations with εb = 0 or by calculating the chemical potential of adsorbed subunits (see the SI). The packaging efficiencies for various εs and c0 are plotted as a function of csurf in 9. We see that optimal assembly for all concentrations collapses onto the same value of csurf ≈ 0.4, while higher values of csurf mainly lead to trapped incommensurate partial capsids. Interestingly, successful assembly occurs at higher csurf if the rates of subunit adsorption are decreased below the diffusion limited rate by decreasing the frequency of subunit exchanges in the bath (see Figure 6 in the SI), when subunits adsorb more slowly compared to the timescale for annealing of surface-adsorbed complexes. We therefore note that effects which increase the surface-annealing timescale, such as barriers to diffusion of strongly adsorbed subunits, could further promote frustrated states.
Larger Capsid Morphologies
To further explore the requirements for adaptability to template size, we extended our model to include T=4 capsids, which requires at least one new subunit geometry in addition to AB and CC (see page 3 of the SI). We note, however, that Sun et al.3 observe only disordered structures on T=4-size nanoparticles, which may suggest T=4 subunit geometries are not favorable for BMV proteins. As shown in figure 4 in the SI, these model subunits are capable of forming T=3 or T=4 capsids around nanoparticles ranging from T=3 to T=4 size; however, yields of perfect capsids are generally lower (≲ 50%) and more sensitive to parameter values than for the T=1/T=3 case. In addition to intermediates that cannot close around an incommensurate core (as described above), there are significant yields of closed but disordered asymmetric shells. This result is consistent with the fact that the difference in curvature between T=3 and T=4-size nanoparticles is small (≈ 12%) and thus templating for the commensurate capsid geometry is weak, especially for small intermediates.
Discussion
Estimating the conformational free energy from experiments
Comparison of model predictions to experimental observations of capsid morphology suggests a potential correspondence between ranges of the conformational free energy, εAA, and certain systems. In particular, CCMV and BMV capsid proteins assemble into exclusively T=3 empty capsids under conditions commonly employed in vitro, while deletion of the N-terminal residues from the proteins of either virus enables assembly of T=1 capsids.13 In particular, proteins of the N Δ34 CCMV mutant, with 34 N-terminal residues deleted, assemble into a mix of T=3 (≈ 10% of assembled material), T=1 (≈ 40%) and heterogeneous pseudoT2 assemblages (≈ 50%), could correspond to the range 0.3 ≲ εAA ≲ 0.8 for which polymorphism is observed. We note that this range could shift somewhat, however, if there are different binding energies for different complementary interfaces and because we have not considered pseudoT2 capsids in this work, since they require interfacial contacts that are not seen in the T=3 crystal structure (unlike T=1 capsids).13
The observation that wild-type CCMV and BMV proteins form exclusively T=3 capsids can only suggest a lower bound for the wild-type conformational free energy, εAA ≲ 1.2, but additionally considering nanoparticle experiments allows a more precise estimate. Comparison of Figs. 4 and 6b identifies only a narrow range 1.1 ≲ εAA ≲ 1.5 for which predominantly T=3 empty capsids form, but T=1 capsids efficiently encapsidate T=1-sized nanoparticles, as observed in BMV-nanoparticle experiments.14 Although CCMV proteins have not been used in nanoparticle experiments, pseudo-T2, T=3, and larger (but asymmetric) CCMV capsids assemble around inorganic polyelectrolytes5 and nanoemulsion droplets.4
Figure 4.
The fraction of subunits in well-formed T=1 (■), T=3 (●) or both (◆) capsids for varying conformational free energy, εAA, in empty capsid simulations.
Figure 6.
The fraction of trajectories in which a complete capsid assembles on a T=1-size nanoparticle as functions of (a) εAA for several εs and (b) εs at several εAA, All packaging efficiencies in this work are shown for an observation time of 40, 000t0 which is 100 times the average assembly time under optimal conditions.
Although we have focused on the relationship between nanoparticle surface charge and assembly effectiveness, other model parameters can be varied in experiments as well. For instance, decreasing pH (or increasing ionic strength) can increase subunit binding free energies24 (εb) while simultaneously decreasing the subunit-nanoparticle interaction strength (εs), since the nanoparticle surfaces are functionalized with carboxylated PEG. Thus, the optimal pH for encapsulation of nanoparticles is larger than the optimal pH for empty capsid assembly.8 Therefore we have simulated assembly in the presence of nanoparticles with a subunit binding energy of εb = 10, which is lower than the optimal subunit binding energy εb = 12 for empty capsid assembly; the interdependence of assembly effectiveness on subunit-subunit and the subunit-nanoparticle interaction strengths is explored in Ref23. We also note that the conformation free energy (hinge energy) could depend on pH.
Implications for quasi-equivalence
The predictions of our model many shed light on the mechanisms by which subunits can assemble with precise spatial ordering of different conformations even though the bonding interfaces in different conformations are structurally similar. In particular, the model predicts that assembly products, and to some extent assembly times, are insensitive to the inter-subunit conformational binding specificity, χs, for χs ≲ 25%. For the parameters used in this work, the free energy per bond in a complete capsid is approximately 3.5 kBT (this estimate includes the entropy penalty for the subunit binding, see15). Thus successful assembly requires only that conformational pairings not seen in the crystal structure differ by ≈ kBT from native pairings, which could arise from only minor variations in binding interfaces. Because optimal assembly occurs for weak subunit-subunit interactions, when subunit binding is only slightly more favorable than unbinding,25 a small difference in subunit binding free energies, combined with the strain caused by the geometrical incompatibilities that result from non-native bonding, strongly favors a Caspar-Klug capsid structure.
Suggested experiments
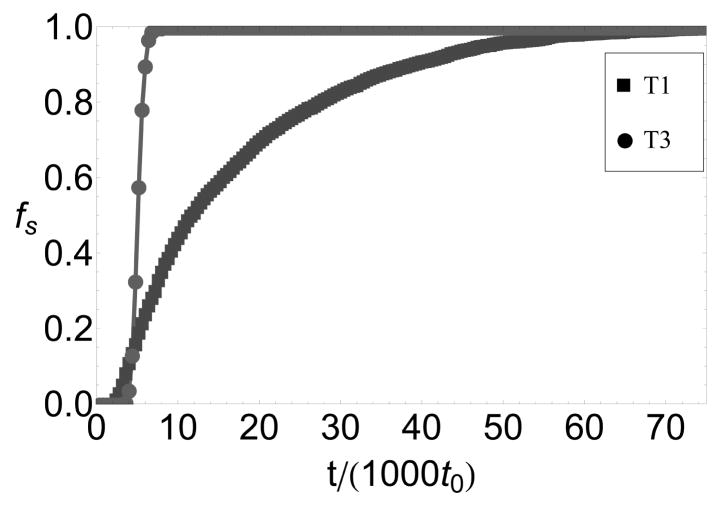
A key prediction of our work is that assembly on a nanoparticle with a size that does not match the lowest free energy capsid morphology is impeded by partial capsids whose curvature is inconsistent with the nanoparticle surface. These frustrated states are revealed in several ways that may be accessible to experiments. First, simulated packaging efficiencies on T=1-size nanoparticles, for subunits that form T=3 empty capsids, are nonmonotonic with respect to the nanoparticle-subunit interaction strength (6b). This parameter is controlled in experiments by functionalizing nanoparticle surfaces with different ratios of anionic and neutral molecules.8 In Ref.16 we show that the chemical potential of adsorbed subunits, and hence the equilibrium surface concentration csurf (see 9), can be estimated from the surface density of functionalized charge; csurf can be varied over the range 0 ≤ csurf ≲ 0.8. Although the degree of nonmonotonicity depends on factors such as subunit adsorption rates and surface annealing rates, frustration can still be observed by differences in assembly kinetics on T=1 and T=3- size nanoparticles even for conditions in which eventual packaging efficiencies reach 100% as in 8.
Summary
We have performed simulations with a model for assembly of subunits into empty capsids and around nanoparticles that template the assembly of different morphologies. The simulations uncover mechanisms by which assembly can adapt to form different morphologies when challenged with a template that does not match the preferred empty capsid structure. Predicted assembly pathways include frustrated partial capsid intermediates with curvatures that do not match the template, which leads to predicted differences in assembly kinetics and effectiveness on nanoparticles with different sizes, that can be tested in experiments. These findings may shed light on the role of nucleic acids in assembly during viral replication, and demonstrate that the interplay between the geometries of different components is an important consideration for the design of nanostructured materials.
Outlook
Extensions to this study could include an explicit representation of intra-subunit degrees of freedom (i.e. hinge motions of the protein dimer), and template degrees of freedom. As suggested by an anonymous reviewer, a exible spherical template could represent a nucleic acid molecule with significant structure due to base pairing. We find that assembly around a exible spherical template has qualitatively similar results to those reported here (for some ranges of sphere exibility), although the optimal subunit-template interaction strength increases somewhat; these results will be presented in a future publication.
In order to focus on the effects of template-capsid geometry mismatches on assembly, we have not considered other potential sources of frustration, such as impeded diffusion for subunits that interact strongly with the nanoparticle surface. The coupling of multiple sources of frustration could have interesting consequences.
Supplementary Material
Figure 1.
Definition of parameters used to calculate the interaction energy between complementary bond vectors (2) and (3). The dihedral angle giving the rotation around the plane perpendicular to Rij is not shown. The bond vectors here are shown projected onto a plane even though the subunit geometries have intrinsic curvature (see 2).
Figure 2.
(a) Images of brome mosaic virus (BMV) capsid crystal structures (T=1,18 T=3,19 )overlaid with icosahedral cages. Subunits with quasi-equivalent conformations A, B, and C are blue, red, and green, respectively. (b) The model capsid geometries. Each subunit represents a protein dimer, subunit sizes are reduced to aid visibility, and colors indicate the conformations of proteins within a dimer subunit: silver, AA; red, AB; blue, CC.
Figure 3.
(a) Subunits with different conformations in CCMV capsids have nearly identical structures, but different angles of rotation about the “dimer hinge”, which is the axis through the center of the dimer interface.13 One subunit is shown on the left (dark blue), and subunit positions on the right are indicated by the ribbon representations of two β-strands to show the range of rotation about the hinge for AB (red, 38°), CC (light blue, 42°), and AA (green, 45°). (b) Geometries and intrinsic free energies (or hinge energies) for model subunits in different conformations. The only geometrical difference between AA and CC subunits is the “hinge” angle between the left and right pairs of bond vectors – the AA dimer has higher curvature (into the page) than the CC. Bond vectors are depicted with arrows and the angles between them are indicated in degrees – the angles do not add up to 360° because the vectors do not lie in a plane.
Figure 5.
The fraction of subunits in well-formed capsids as a function of the conformational specificity parameter χs.
Figure 7.
a) A partial T=3 capsid grows on a T=1-sized nanoparticle; the subunits near the sphere are stabilized by its attraction but the mismatch between the capsid and nanoparticle geometry forbids the addition of new particles. b) After some time, the metastable partial capsid disassembles and a T=1 capsid grows to completion. An animation of the entire process is available in the SI.
Figure 8.
Packaging efficiencies as functions of time for encapsidation of T=1-size and T=3-size nanoparticles for parameters at which T=3 capsids are the lowest free energy empty capsid structures, εAA = 1.3. Other parameters are εs =8.0 and c0 = 0.01.
Figure 9.
Packaging efficiencies on a T=1-size nanoparticle for several bulk subunit concentrations, c0 are shown for varying subunit-surface energies, plotted as functions of the surface concentration at which subunit adsorption saturates, csurf. The conformational free energy is εAA = 1.3.
Acknowledgments
We gratefully acknowledge Chris Henley for insightful comments and Jinghua Tang for providing the T=1 CCMV crystal structure. Funding was provided by an HHMI-NIBIB Interfaces Initiative grant to Brandeis University and Brandeis University startup funds. Simulations were performed on the High Performance Computing Cluster at Brandeis University.
Footnotes
Assembly behavior appears to be largely independent of γc, except at extreme values: assembly is not adaptable at γc = 0, and assembly is not productive at γc = ∞
where ns is the number of subunits with strong (< −2kBT) interactions with the nanoparticle.
References
- 1.(a) Johnson JM, Tang JH, Nyame Y, Willits D, Young MJ, Zlotnick A. Nano Letters. 2005;5:765–770. doi: 10.1021/nl050274q. [DOI] [PubMed] [Google Scholar]; (b) Casini GL, Graham D, Heine D, Garcea RL, Wu DT. Virology. 2004;325:320–327. doi: 10.1016/j.virol.2004.04.034. [DOI] [PubMed] [Google Scholar]; (c) Singh S, Zlotnick A. J Biol Chem. 2003;278:18249–18255. doi: 10.1074/jbc.M211408200. [DOI] [PubMed] [Google Scholar]; (d) Willits D, Zhao X, Olson N, Baker TS, Zlotnick A, Johnson JE, Douglas T, Young MJ. Virology. 2003;306:280–288. doi: 10.1016/s0042-6822(02)00054-5. [DOI] [PMC free article] [PubMed] [Google Scholar]; (e) Zlotnick A, Aldrich R, Johnson JM, Ceres P, Young MJ. Virology. 2000;277:450–456. doi: 10.1006/viro.2000.0619. [DOI] [PubMed] [Google Scholar]
- 2.(a) Johnson KN, Tang L, Johnson JE, Ball LA. J Virol. 2004;78:11371–11378. doi: 10.1128/JVI.78.20.11371-11378.2004. [DOI] [PMC free article] [PubMed] [Google Scholar]; (b) Krol M, Olson N, Tate J, Johnson J, Baker T, Ahlquist P. Proc Natl Acad Sci U S A. 1999;96:13650–13655. doi: 10.1073/pnas.96.24.13650. [DOI] [PMC free article] [PubMed] [Google Scholar]
- 3.(a) Sun J, DuFort C, Daniel MC, Murali A, Chen C, Gopinath K, Stein B, De M, Rotello VM, Holzenburg A, Kao CC, Dragnea B. Proc Natl Acad Sci U S A. 2007;104:1354–1359. doi: 10.1073/pnas.0610542104. [DOI] [PMC free article] [PubMed] [Google Scholar]; (b) Dixit SK, Goicochea NL, Daniel MC, Murali A, Bronstein L, De M, Stein B, Rotello VM, Kao CC, Dragnea B. Nano Letters. 2006;6:1993–1999. doi: 10.1021/nl061165u. [DOI] [PubMed] [Google Scholar]; (c) Chen C, Kwak ES, Stein B, Kao CC, Dragnea B. J Nanosci and Nanotech. 2005;5:2029–2033. doi: 10.1166/jnn.2005.506. [DOI] [PubMed] [Google Scholar]
- 4.Chang CB, Knobler CM, Gelbart WM, Mason TG. Acs Nano. 2008;2:281–286. doi: 10.1021/nn700385z. [DOI] [PubMed] [Google Scholar]
- 5.Hu Y, Zandi R, Anavitarte A, Knobler CM, Gelbart WM. Biophysical Journal. 2008;94:1428–1436. doi: 10.1529/biophysj.107.117473. [DOI] [PMC free article] [PubMed] [Google Scholar]
- 6.(a) Soto CM, Blum AS, Vora GJ, Lebedev N, Meador CE, Won AP, Chatterji A, Johnson JE, Ratna BR. J Am Chem Soc. 2006;128:5184–5189. doi: 10.1021/ja058574x. [DOI] [PubMed] [Google Scholar]; (b) Sapsford KE, Soto CM, Blum AS, Chatterji A, Lin TW, Johnson JE, Ligler FS, Ratna BR. Biosens Bioelectron. 2006;21:1668–1673. doi: 10.1016/j.bios.2005.09.003. [DOI] [PubMed] [Google Scholar]; (c) Boldogkoi Z, Sik A, Denes A, Reichart A, Toldi J, Gerendai I, Kovacs KJ, Palkovits M. Prog Neurobiol. 2004;72:417–445. doi: 10.1016/j.pneurobio.2004.03.010. [DOI] [PubMed] [Google Scholar]; (d) Gupta B, Levchenko TS, Torchilin VP. Advanced Drug Delivery Reviews. 2005;57:637–651. doi: 10.1016/j.addr.2004.10.007. [DOI] [PubMed] [Google Scholar]; (e) Garcea RL, Gissmann L. Curr Opin Biotechnol. 2004;15:513–517. doi: 10.1016/j.copbio.2004.10.002. [DOI] [PubMed] [Google Scholar]; (f) Dietz GPH, Bahr M. Molecular and Cellular Neuroscience. 2004;27:85–131. doi: 10.1016/j.mcn.2004.03.005. [DOI] [PubMed] [Google Scholar]
- 7.(a) Chatterji A, Ochoa WF, Ueno T, Lin TW, Johnson JE. Nano Letters. 2005;5:597–602. doi: 10.1021/nl048007s. [DOI] [PubMed] [Google Scholar]; (b) Falkner JC, Turner ME, Bosworth JK, Trentler TJ, Johnson JE, Lin TW, Colvin VL. J Am Chem Soc. 2005;127:5274–5275. doi: 10.1021/ja044496m. [DOI] [PubMed] [Google Scholar]; (c) Flynn CE, Lee SW, Peelle BR, Belcher AM. Acta Materialia. 2003;51:5867–5880. [Google Scholar]; (d) Douglas T, Young M. Nature. 1998;393:152–155. [Google Scholar]
- 8.Dragnea, B. Unpublished.
- 9.(a) Johnson JE, Speir JA. J Mol Biol. 1997;269:665–675. doi: 10.1006/jmbi.1997.1068. [DOI] [PubMed] [Google Scholar]; (b) Zlotnick A. Journal of Molecular Recognition. 2005;18:479–490. doi: 10.1002/jmr.754. [DOI] [PubMed] [Google Scholar]; (c) Caspar DLD, Klug A. Cold Spring Harbor Symp Quant Biol. 1962;27:1–24. doi: 10.1101/sqb.1962.027.001.005. [DOI] [PubMed] [Google Scholar]
- 10.Stockley PG, Rolfsson O, Thompson GS, Basnak G, Francese S, Stonehouse NJ, Homans SW, Ashcroft AE. J Mol BIo. 2007;369:541–552. doi: 10.1016/j.jmb.2007.03.020. [DOI] [PMC free article] [PubMed] [Google Scholar]
- 11.(a) Bruinsma RF, Gelbart WM, Reguera D, Rudnick J, Zandi R. Phys Rev Lett. 2003;90:248101. doi: 10.1103/PhysRevLett.90.248101. [DOI] [PubMed] [Google Scholar]; (b) Zandi R, Reguera D, Bruinsma RF, Gelbart WM, Rudnick J. Proc Natl Acad Sci U S A. 2004;101:15556–15560. doi: 10.1073/pnas.0405844101. [DOI] [PMC free article] [PubMed] [Google Scholar]; (c) Keef T, Taormina A, Twarock R. Physical Biology. 2005;2:175–188. doi: 10.1088/1478-3975/2/3/005. [DOI] [PubMed] [Google Scholar]; (d) Chen T, Zhang ZL, Glotzer SC. Proc Natl Acad Sci U S A. 2007;104:717–722. doi: 10.1073/pnas.0604239104. [DOI] [PMC free article] [PubMed] [Google Scholar]; (e) Zandi R, van der Schoot P. Submitted 2008. [Google Scholar]; (f) Mannige RV, Brooks CL., III Phys Rev E. 2008:77. doi: 10.1103/PhysRevE.77.051902. [DOI] [PMC free article] [PubMed] [Google Scholar]
- 12.Berger B, Shor PW, Tuckerkellogg L, King J. Proc Natl Acad Sci U S A. 1994;91:7732–7736. doi: 10.1073/pnas.91.16.7732. [DOI] [PMC free article] [PubMed] [Google Scholar]
- 13.Tang JH, Johnson JM, Dryden KA, Young MJ, Zlotnick A, Johnson JE. Journal Of Structural Biology. 2006;154:59–67. doi: 10.1016/j.jsb.2005.10.013. [DOI] [PubMed] [Google Scholar]
- 14.Dragnea B, Chen C, Kwak ES, Stein B, Kao CC. J Am Chem Soc. 2003;125:6374–6375. doi: 10.1021/ja0343609. [DOI] [PubMed] [Google Scholar]
- 15.Hagan MF, Chandler D. Biophysical Journal. 2006;91:42–54. doi: 10.1529/biophysj.105.076851. [DOI] [PMC free article] [PubMed] [Google Scholar]
- 16.Hagan MF. Phys Rev E. 2008;77:051904. doi: 10.1103/PhysRevE.77.051904. [DOI] [PMC free article] [PubMed] [Google Scholar]
- 17.(a) Nguyen HD, Reddy VS, Brooks CL. Nano Letters. 2007;7:338–344. doi: 10.1021/nl062449h. [DOI] [PubMed] [Google Scholar]; (b) Schwartz R, Shor PW, Prevelige PE, Berger B. Biophys J. 1998;75:2626–2636. doi: 10.1016/S0006-3495(98)77708-2. [DOI] [PMC free article] [PubMed] [Google Scholar]; (c) Hicks SD, Henley CL. Phys Rev E. 2006:74. doi: 10.1103/PhysRevE.74.031912. [DOI] [PubMed] [Google Scholar]; (d) Wilber AW, Doye JPK, Louis AA, Noya EG, Miller MA, Wong P. J Chem Phys. 2007:127. doi: 10.1063/1.2759922. [DOI] [PubMed] [Google Scholar]
- 18.Larson S, Lucas R, McPherson A. J Mol BIo. 2005;346:815–831. doi: 10.1016/j.jmb.2004.12.015. [DOI] [PubMed] [Google Scholar]
- 19.Reddy VS, Natarajan P, Okerberg B, Li K, Damodaran KV, Morton RT, Brooks C, Johnson JE. J Virol. 2001;75:11943–11947. doi: 10.1128/JVI.75.24.11943-11947.2001. [DOI] [PMC free article] [PubMed] [Google Scholar]
- 20.Adolph K, Butler P. J Mol Bio. 1974;88:327–341. doi: 10.1016/0022-2836(74)90485-9. [DOI] [PubMed] [Google Scholar]
- 21.Tang, J. H. Private Communication.
- 22.(a) Branka A, Heyes D. Phys Rev E. 1999;60:2381–2387. doi: 10.1103/physreve.60.2381. [DOI] [PubMed] [Google Scholar]; (b) Heyes D, Branka A. Molecular Physics. 2000;98:1949–1960. [Google Scholar]
- 23.Hagan MF. J Chem Phys. (submitted) [Google Scholar]
- 24.Kegel WK, van der Schoot P. Biophys J. 2004;86:3905–3913. doi: 10.1529/biophysj.104.040055. [DOI] [PMC free article] [PubMed] [Google Scholar]
- 25.(a) Ceres P, Zlotnick A. Biochemistry. 2002;41:11525–11531. doi: 10.1021/bi0261645. [DOI] [PubMed] [Google Scholar]; (b) Jack RL, Hagan MF, Chandler D. Phys Rev E. 2007;76:021119. doi: 10.1103/PhysRevE.76.021119. [DOI] [PubMed] [Google Scholar]; (c) Rapaport D. 2008 arXiv:0803.0115v2. [Google Scholar]
Associated Data
This section collects any data citations, data availability statements, or supplementary materials included in this article.


