Abstract
OBJECTIVE
To determine whether ascites can improve risk discrimination beyond MELD and serum sodium (MELDNa).
METHODS
Consecutive cirrhotic patients were evaluated for ascites based on an outpatient CT along with concurrent MELD and Na values. Cox models were used to determine the added value of ascites for predicting one-year mortality. Increases in the C-index, integrated discrimination improvement (IDI), and the net reclassification index (NRI) were used to assess improvements in discrimination after the addition of ascites.
RESULTS
1,003 patients had Na and MELD scores available within 30 days of the CT scan. Sixty deaths occurred within one year, with mortality higher in patients with ascites (21.4% versus 4.0%, HR 6.08, 95% CI 3.62–10.19, p<0.0005). In the presence of ascites, the MELD and MELDNa score underestimated mortality risk when the scores were less than 21. The addition of ascites to the MELDNa model substantially improved discrimination by the C-index (0.804 versus 0.770, increase of 3.4%, 95% CI 0.2%–9.9%), IDI (1.8%, p=0.016), and NRI (15.8%, p=0.0006).
CONCLUSION
The incorporation of radiographic ascites significantly improves upon MELDNa for predicting one-year mortality. The presence of ascites may help identify patients at increased risk for mortality not otherwise captured by MELD or MELDNa.
Keywords: Ascites, MELD, MELDNa, prognostic model, cirrhosis
INTRODUCTION
Patients with cirrhosis and ascites have a two year mortality rate of 50%.(1) The clinical impact of ascites has historically been well recognized and its importance is underscored by its inclusion in the Child Turcotte Pugh score.(2, 3) However, with the advent of the MELD score for risk prediction in advanced liver disease, the use of the Child Turcotte Pugh score for risk profiling in liver patients has fallen out of favor.(4, 5) Traditionally ascites has been regarded as a subjective measure that is often transient in nature, which has limited its effectiveness as a reliable marker for incorporation into risk prediction models. The increasing use of radiological studies in patients with advanced liver disease provides a new opportunity for objective measurement of ascites and reintroduces ascites as a potential marker of increased mortality risk.
Over the past several years, investigators have studied variables that may refine the MELD score’s ability to predict short term mortality. Several studies have shown that even after adjusting for the MELD score, serum sodium (Na) and ascites continue to provide further information about the risk of poor outcomes in patients with liver disease.(4, 6–8) The addition of Na to the MELD score, in the form of the MELDNa score, has been shown to be a more effective model for risk prediction in patients awaiting liver transplantation, particularly in patients with low MELD scores.(9–12) The relationship between the MELDNa score and ascites has not previously been evaluated. The aim of our study was to determine if the use of an objective measure of ascites confers additional mortality risk beyond MELD and Na in patients with advanced liver disease.
METHODS
Study Population
We performed a retrospective review of the administrative database of the safety net population receiving care at San Francisco General Hospital with cirrhosis and complications of liver disease as identified by ICD9 codes. Patients were also included if the CT scan described a nodular or cirrhotic liver or had findings consistent with portal hypertension. Consecutive patients with at least one abdominal CT scan and available laboratory tests between 2000 and 2007 were included. CT scans were commonly employed at our institution for screening for hepatocellular carcinoma. Other CT scan indications included a history of pancreatitis, weight loss/gain, diarrhea, hematuria, thrombocytopenia, and pancytopenia. If a study subject had multiple CT scans, we used the first available CT scan on record.
Study subjects were excluded if a MELDNa score could not be calculated from available laboratory data within 30 days of the CT scan or if there was any concern for malignancy on imaging. Patients were excluded if liver lesions greater than one centimeter with typical enhancement were detected or if there was portal venous invasion suggestive of tumor in-growth. We also excluded any patient in whom there was no follow up after CT imaging. Because receipt of intravenous contrast during CT scans may be associated with worsening creatinine and therefore increased likelihood of death, we excluded all patients in whom creatinine was greater than 1.5 mg/dL at the time of contrast exposure in the primary analysis. An additional analysis was performed if patients with creatinine greater than 1.5 mg/dL were included. For each subject, the follow up time was calculated from the initial CT date to the date of the last clinical contact.
Predictors and Outcome
For each study subject in the cohort, we determined the mean of total bilirubin, international normalized ratio (INR), creatinine, and Na within 30-days of the index CT. Individual CT scan reports were reviewed for “ascites” as a keyword. Therefore, the original radiological report was blinded to the clinical outcome. Ascites was coded as a binary predictor as well as an ordinal variable (absent, small, medium or moderate, and massive or large). Trace free fluid was not considered in our definition of ascites. The primary outcome of interest was all cause mortality within one-year from the index CT. Death was confirmed by cross-referencing to the California vital statistics records. The follow up time was censored at one-year.
Statistical Analysis
Patient demographics, baseline chemistries, MELD, MELDNa scores, and CT findings were tabulated and compared using t- or nonparametric tests for continuous variables, and chi-square or Fisher’s exact test for categorical variables. The MELD score was calculated using the standard formula: 11.2*ln(INR) + 9.57*ln(creatinine, in mg per deciliter) + 3.78*ln(bilirubin, in mg per deciliter) + 6.43, with a lower limit of 1 for all variables and a maximum MELD and MELDNa score of 40.(4) A MELDNa value was calculated for each individual using the following formula: MELDNa = MELD + 1.0*(140-Na) −0.025*MELD*(140-Na) where Na is capped between 125 mmol per liter to 140 mmol per liter.(11)
Cox proportional-hazard models were used to predict one-year mortality. Proportional-hazard assumptions were examined using plots of Schoenfeld residuals. During model development, the effect of increasing severity of ascites was evaluated using a test of trend across categories, and the joint effects of ascites and Na were evaluated graphically and using Cox models. Graphical methods were also used to assess non-linearities as well as interaction between ascites and the MELDNa score. These showed that ascites was increasingly predictive of mortality in patients with lower MELDNa scores. In the final model, the interaction between ascites and MELDNa was modeled using a linear spline term equal to 21-MELDNa for patients with ascites and MELDNa scores < 21, and zero for all other patients. More elaborate models for the interaction of ascites and MELDNa did not improve prediction.
We compared the discrimination of the MELDNa and MELDNa + ascites models using three metrics. First, we computed the C-index,(13) with 95% bootstrap bias-corrected percentile confidence intervals, both for the individual indices and for the differences in indices between models. Second, we computed the integrated discrimination improvement (IDI), a novel analog of the change in the C-index.(14) Third, we calculated the net reclassification index (NRI).(14) In computing the NRI, we classified predicted one-year mortality as less than 5%, 5–10%, and greater than 10%. STATA Version 9.0 (Stata Corp., College Station, TX) was used for all analyses. This study was approved by the committee on human research at the University of California San Francisco.
RESULTS
Study Population
One thousand and three patients met our inclusion criteria and were followed for 2,347 patient years with a median (range) follow up time of 1.86 (0.03 to 7.45) years; 69.5% of the patients had follow up beyond one year. Median age was 49.5 (range 18 to 84) years. Our population was predominately male (65%) and racially diverse with 36% White, 22% Hispanic, 21% Black, and 18% Asian. The most common causes of liver disease were alcohol (42%), HCV (41%), and HBV (11%).
Patients with ascites were more likely to have abnormal laboratory parameters and CT findings of advanced portal hypertension (Table 1). The median (range) MELD and MELDNa score for patients with ascites was 13.4 (7–31) and 15.6 (7–32) as compared to 8.5 (6–34) and 9.2 (6–35) in those without ascites.
Table 1.
Baseline Patient Characteristics According to Ascites Status
| Overall N=1,003 | Ascites N=112 | No Ascites N=891 | p-valuea | |
|---|---|---|---|---|
| Age, yr, median (range) | 49.5 (18–84) | 49.8 (26–84) | 49.5 (18–80) | 0.39 |
| Male, % | 64.7 | 61.7 | 65.1 | 0.45 |
| Laboratory Parameters, median (range) | ||||
| MELD | 10.0 (6–34) | 13.4 (6–29) | 8.5 (6–34) | <0.001 |
| MELDNa | 11.1 (6–35) | 15.6 (6–30) | 9.2 (6–35) | <0.001 |
| Total bilirubin–mg/dL | 1.3 (0.2–21.6) | 1.6 (0.2–12.7) | 0.7 (0.2–21.6) | <0.001 |
| Creatinine–mg/dL | 0.9 (0.3–1.5) | 0.9 (0.3–1.5) | 0.9 (0.4–1.5) | 0.26 |
| INR | 1.3 (0.7–5.3) | 1.5 (0.8–4.2) | 1.1 (0.7–5.3) | <0.001 |
| Sodium–mmol/L | 139 (127–150) | 137 (127–143) | 140 (127–150) | <0.001 |
| CT findings, % | ||||
| Splenomegaly | 18.2 | 42.0 | 14.8 | <0.001 |
| Varices | 12.2 | 25.9 | 10.4 | <0.001 |
p-values are chi-square and t-tests of the difference between patients with and without ascites
Ascites, Sodium, MELD, MELDNa, and Mortality
At the end of the one-year follow-up, 60 (6.0%) patients had died. One-year mortality was higher in patients with ascites (24/112, 21.4%) as compared to those without ascites (36/890, 4.0%; hazard ratio, 6.08; 95% CI 3.62–10.19; p<0.001). The mortality risk associated with moderate or large (hazard ratio 7.60 and 4.79, respectively; Table 2) amounts of radiographic ascites was not significantly different from the risk in the subgroup with small amounts of ascites (hazard ratio 3.99, 95% CI 1.92–8.27; Table 2). In addition, ascites remained an important predictor for death after adjustment for serum sodium (hazard ratio 3.62, 95% CI 2.09–6.26; p<0.0005). Figure 1 shows that the increase in mortality risk associated with ascites was proportional across the range of sodium levels.
Table 2.
Hazard Ratios Associated with Increasing Severity of Ascites
| Ascites | N=1,003 | HR | 95% CI |
|---|---|---|---|
| None | 891 | Ref | -- |
| Small | 55 | 3.99 | 1.92–8.27 |
| Moderate | 28 | 7.60 | 3.67–15.8 |
| Large | 26 | 4.79 | 1.88–12.2 |
Note: 3 patients did not have ascites volume specified.
Figure 1.
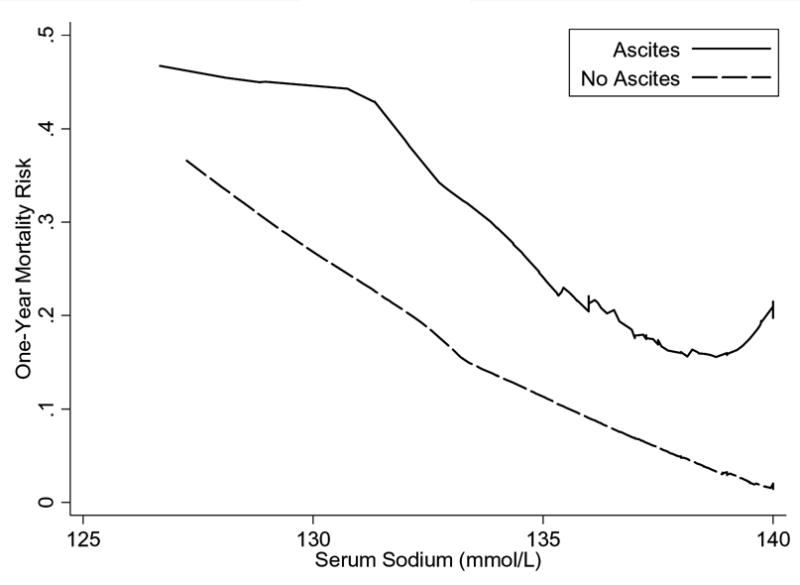
Mortality Risk across Serum Sodium in Patients with and without Ascites. The presence of ascites represented a constant elevated mortality risk across the range of serum sodium examined.
Graphical methods demonstrated that ascites was associated with increases in mortality risk nonlinearly across the range of MELD and MELDNa scores (Figure 2a, 2b). Specifically, ascites was associated with increased mortality risk, but only among patients with MELD and MELDNa less than 21. When MELD and MELDNa was greater than 21, the presence of ascites was not associated with a significant increase in mortality. The linear spline, which describes the interaction of ascites and MELDNa when MELDNa is less than 21 (Figure 2c), was a powerful independent predictor of mortality (p<0.0005; Table 3). Figure 2c, showing one-year mortality risk predicted for patients with and without ascites, suggests that risk among all patients with ascites and MELDNa scores between 6 and 20 is roughly comparable to the risk among patients with no ascites and a MELDNa score of 21. Specifically, ascites inflated the mortality risk with the model attributing an added 0.86 MELDNa points for every unit increase in the linear spline variable (21 MELDNa). For a patient with MELDNa score of 6, ascites increases mortality risk by the equivalent of an additional 12.9 MELDNa points (15*0.86=12.9) to an adjusted MELDNa score of 18.9 in the presence of ascites, while for a patient with MELDNa of 15, ascites increases estimated risk by the equivalent of 5.2 points (6*0.86=5.2) to an adjusted score of 20.2. In contrast, among patients with MELDNa scores of 21 or more, mortality risk appeared comparable in those with and without ascites.
Figure 2.
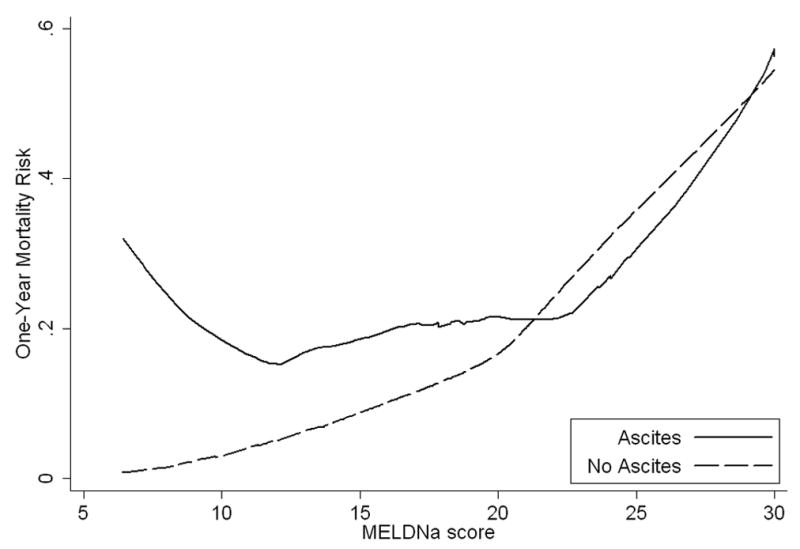
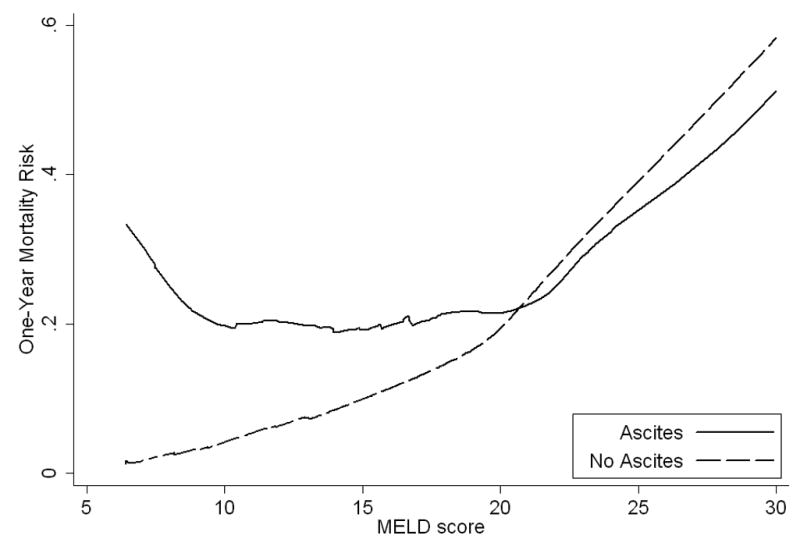
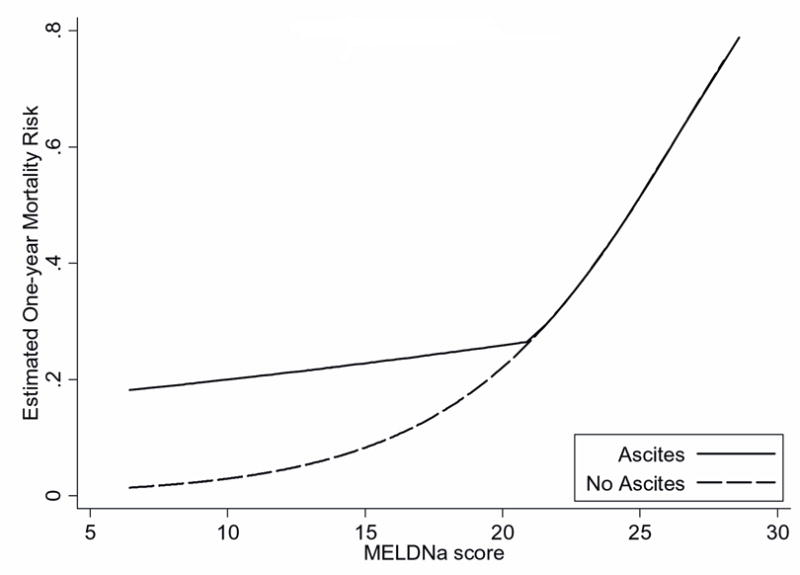
Actual and Estimated One-year Mortality Risk across MELD and MELDNa in Patients with and without Ascites
a. The one-year mortality risk curve representing patients with ascites deviated from those without ascites especially when MELD was less than 21. In this range, MELD underestimated mortality risk in the presence of ascites.
b. Similarly, the one-year mortality risk curve representing patients with ascites deviated from those without ascites when MELDNa was less than 21.
c. The risk associated with ascites was captured using a linear spline, equal to 21-MELDNa for patients with ascites and MELDNa scores < 21, and zero for all other patients. When MELDNa is less than 21 and ascites is present (black line), mortality risk can be estimated by adding 0.86 MELDNa points for every unit decrease in MELDNa below 21.
Table 3.
Cox Regression Models Predicting Death at One-Year
| Model | Predictor | HR (95% CI) | p-value | C-index (95% CI) | C-index improvementc | IDIc |
|---|---|---|---|---|---|---|
| Ascites only | Ascitesa | 6.08 (3.62–10.19) | <0.0005 | 0.653 (0.58–0.72) | - | - |
| MELD only | MELD | 1.21 (1.16–1.26) | <0.0005 | 0.730 (0.66–0.80) | - | - |
| MELDNa only | MELDNa | 1.22 (1.17–1.27) | <0.0005 | 0.770 (0.70–0.83) | - | - |
| MELDNa + Ascites | MELDNa | 1.24 (1.18–1.29) | <0.0005 | 0.804 (0.75–0.85) | 3.4% (p=0.036) | 1.8% (p=0.016) |
| Ascitesb | 1.20 (1.11–1.30) | <0.0005 |
Ascites coded as a binary predictor.
Linear spline, equal to 21-MELDNa for patients with ascites and MELDNa scores < 21, and zero for all other patients.
The improvement in model performance compares a MELDNa model against MELDNa + Ascites
Discrimination and Reclassification using Ascites
One-year mortality was predicted with good discrimination by the MELD score (C-index 0.73), and more powerfully by the MELDNa score (C-index 0.77; Table 3). Addition of ascites to the MELDNa model afforded substantial further improvement (C-index 0.80, improvement 3.4%; 95% CI 0.2%–9.9%; p = 0.036 and Figure 3). The analogous IDI measure was 1.8% (p=0.016). Since restricting creatinine may limit the prognostic ability of the MELDNa score, an additional analysis including patients with creatinine values greater than 1.5 mg/dl was performed; in this analysis, the C-index still improved by approximately 4% from 0.79 to 0.83 after addition of the ascites spline to the MELDNa model.
Figure 3.
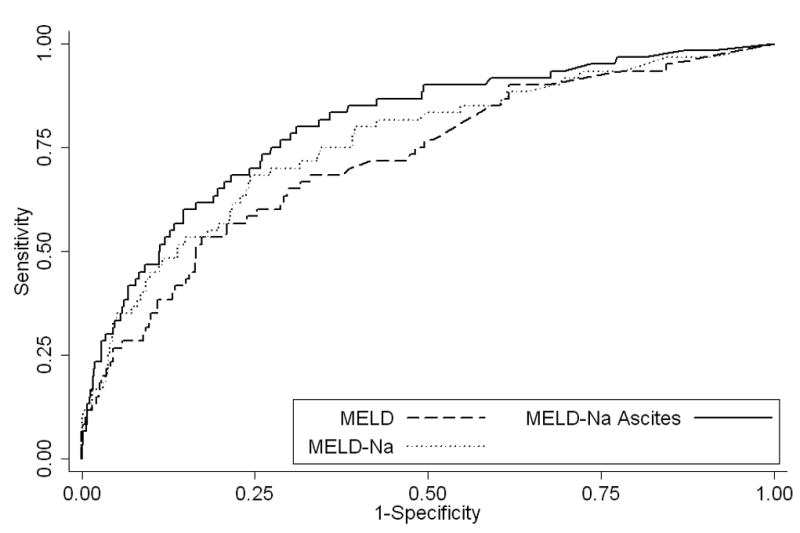
Receiver Operator Curves for MELD, MELD-Na, and MELD-Na with the Addition of Ascites
Net reclassification results are shown in Table 4. Among patients who died, 7 of 60 patients were reclassified at higher risk and 1 of 60 at lower risk, for a net reclassification rate of 10% (6/60). Among 983 patients who did not die, 95 were reclassified at lower risk and 40 at higher risk; the net reclassification rate in this group was 5.8% (55/943). The overall net reclassification index (NRI) was 15.8% (p = 0.0006).
Table 4.
One-Year Mortality Risk Reclassification of Patients Who Died or Who Did Not Die Using MELDNa only Model versus MELDNa + Ascites
| MELDNa + Ascites |
||||
|---|---|---|---|---|
| MELDNa Only | <5% | 5–10% number | >10% | Total No. |
| Patients who Died | ||||
| <5% | 13 | - | 4 | 17 |
| 5–10% | 1 | 7 | 3 | 11 |
| >10% | - | - | 32 | 32 |
| Total No. | 14 | 7 | 39 | 60 |
| Patients who were Alive | ||||
| <5% | 616 | - | 16 | 632 |
| 5–10% | 69 | 73 | 24 | 166 |
| >10% | - | 26 | 119 | 145 |
| Total No. | 685 | 99 | 159 | 943 |
DISCUSSION
In this cohort of patients with advanced liver disease, the MELDNa score underestimated mortality among patients with ascites when the score was less than 21. Even a small amount of ascites was associated with increased mortality risk, and addition of ascites to the MELDNa model substantially improved risk discrimination by three measures. The C-index is the most commonly used measure of a model’s ability to discriminate between those who develop the disease of interest and those who remain disease-free. Commonly, the addition of new predictor to an established risk model leads to only a marginal improvement.(15, 16) However, in our study the increase of more than 3% in the C-index represented a substantial and statistically significant improvement. The IDI suggested comparable improvement in discrimination and was also statistically significant. Finally, the model correctly reclassified a net of 15.8% of patients into the appropriate risk level. Thus our results support the need for additional studies to validate these findings and to better understand the use of ascites to improve risk assessment beyond what is predicted by the MELDNa score alone.
Ascites has historically been incorporated into risk models for patients with advanced liver disease, buts its value in the MELD era continues to be debated.(6–8) An initial study using ascites and MELD suggested that ascites provided marginal prognostic value with increases in the C-index in the range of 0.01 to 0.03.(4) Heuman et al. subsequently determined that persistent ascites was an independent predictor of mortality; specifically, ascites and low sodium and not MELD were the important factors when the MELD score was less than 21.(6) Studies using other patient cohorts have further supported the independent effect of ascites on mortality.(7, 8) Our study provides affirmation of the prognostic value of ascites while further describing the interaction of ascites with MELD and MELDNa. Despite the prognostic improvement with the incorporation of Na to MELD, the presence of ascites in patients with MELDNa less than 21 signify a cohort whose risk appears to be underestimated by MELDNa alone.(11)
Concern about the objectivity of quantifying ascites has cast doubt on inclusion of ascites in risk prediction models. Our study attempts to objectify the presence of ascites by relying on specific definitions of radiological evidence of ascites. By separating ascites assessment from the clinician thereby effectively blinding the radiologists from the clinical outcome, radiological ascites represents a relatively unbiased measure. Furthermore, given the frequent use and availability of radiological studies in patients with advanced liver disease, ascites can be easily assessed. In our cohort, increasing ascites did not confer additional risk above the group with small ascites. The lack of statistically significant volume-dependent mortality risk difference may represent the fact that the combination of serum sodium and the presence of any ascites, rather than the degree of ascites, captures the important effect of hemodynamic derangements. However, this retrospective study is unable to assess the impact of diuretic use and duration of use. In addition, variability in volume measurements between and within each individual radiologist could have led to the misclassification of ascites volume, which may underestimate the impact of increases in ascites volume on mortality.
Our study has several limitations. First, many earlier studies have assessed mortality within 90 or 180 days. Due to the small number of events within 90 and 180 days, we instead modeled one-year mortality, limiting direct comparison between studies. However, in unadjusted analyses censoring follow-up at both 90 and 180 days, our hazard ratios were similar. Additionally, we confirmed that the effect of ascites did not violate the proportional hazard assumption over the longer one-year period. Second, our dataset was restricted by creatinine. Restricting creatinine may reduce the discrimination of the model using the MELDNa score so that the addition of ascites appears to afford greater improvement in the C-index. However, in our sensitivity analysis including patients with elevated creatinine, the increase in the C-index after addition of ascites remained large. Furthermore, our data showed that ascites was only predictive among patients with MELDNa scores lower than 21; in contrast, patients with elevated creatinine are more likely to be associated with MELDNa scores greater than 21. This finding suggests that creatinine and ascites may contribute different prognostic information across the MELDNa spectrum, thereby explaining the prognostic value of ascites. Third, our safety-net population consists of patients with advanced liver disease of diverse etiologies and may receive variable levels of management for ascites. It is unclear how a model including ascites as well as MELDNa would perform among specific subgroups of patients. It is important that future studies validate these early findings, in particular, the interaction between ascites and MELDNa. Furthermore, more objective measures of the hemodynamic derangements in cirrhosis, such as plasma levels of aldosterone, renin, or norepinephrine, may importantly delineate the mortality risk.(17)
In summary, incorporation of radiographic ascites significantly improves upon MELDNa for predicting one-year mortality. The presence of ascites may help identify patients at increased risk for short-term mortality not otherwise captured by MELDNa, in particular when scores are below 21. Future directions may include identifying simple and objective measurements of ascites or a surrogate for ascites that will capture the added mortality risk. In addition, the analysis should be extended to subgroups of liver disease such as those awaiting transplantation, undergoing pre-surgical evaluation, or being considered for treatment of hepatocellular carcinoma.(18) Greater awareness of the mortality risk associated with ascites may impact available treatment options and therefore improve overall delivery of medical care.
Acknowledgments
This work was funded in part by grants from the American Society for Gastrointestinal Endoscopy Endoscopic Research Award (MS) and from the National Center for Research Resources (KL2 RR024130, SWB), from the National Institute of Diabetes and Digestive and Kidney Diseases (DK076565, SWB) (K24 DK080941, JMI), and from Agency for Healthcare Research and Quality (DK076565, SWB).
Abbreviations
- MELD
Model for End-Stage Liver Disease
- Na
serum sodium
- CT
computed tomography
- ICD-9
International Classification of Diseases, 9th Revision
- IDI
integrated discrimination improvement
- NRI
net reclassification index
- INR
international normalized ratio
Footnotes
Statement of Interests
No conflicts of interest exist.
References
- 1.D’Amico G, Morabito A, Pagliaro L, et al. Survival and prognostic indicators in compensated and decompensated cirrhosis. Dig Dis Sci. 1986;31:468–75. doi: 10.1007/BF01320309. [DOI] [PubMed] [Google Scholar]
- 2.Child CG, Turcotte JG. Surgery and portal hypertension. Major Probl Clin Surg. 1964;1:1–85. [PubMed] [Google Scholar]
- 3.Pugh RN, Murray-Lyon IM, Dawson JL, et al. Transection of the oesophagus for bleeding oesophageal varices. Br J Surg. 1973;60:646–9. doi: 10.1002/bjs.1800600817. [DOI] [PubMed] [Google Scholar]
- 4.Kamath PS, Wiesner RH, Malinchoc M, et al. A model to predict survival in patients with end-stage liver disease. Hepatology. 2001;33:464–70. doi: 10.1053/jhep.2001.22172. [DOI] [PubMed] [Google Scholar]
- 5.Wiesner R, Edwards E, Freeman R, et al. Model for end-stage liver disease (MELD) and allocation of donor livers. Gastroenterology. 2003;124:91–6. doi: 10.1053/gast.2003.50016. [DOI] [PubMed] [Google Scholar]
- 6.Heuman DM, Abou-Assi SG, Habib A, et al. Persistent ascites and low serum sodium identify patients with cirrhosis and low MELD scores who are at high risk for early death. Hepatology. 2004;40:802–10. doi: 10.1002/hep.20405. [DOI] [PubMed] [Google Scholar]
- 7.Heuman DM, Mihas A. Utility of the MELD score for assessing 3-month survival in patients with liver cirrhosis: one more positive answer. Gastroenterology. 2003;125:992–3. doi: 10.1016/s0016-5085(03)01149-1. author reply 994–5. [DOI] [PubMed] [Google Scholar]
- 8.Saab S, Landaverde C, Ibrahim AB, et al. The MELD score in advanced liver disease: association with clinical portal hypertension and mortality. Exp Clin Transplant. 2006;4:395–9. [PubMed] [Google Scholar]
- 9.Biggins SW, Kim WR, Terrault NA, et al. Evidence-based incorporation of serum sodium concentration into MELD. Gastroenterology. 2006;130:1652–60. doi: 10.1053/j.gastro.2006.02.010. [DOI] [PubMed] [Google Scholar]
- 10.Biggins SW, Rodriguez HJ, Bacchetti P, et al. Serum sodium predicts mortality in patients listed for liver transplantation. Hepatology. 2005;41:32–9. doi: 10.1002/hep.20517. [DOI] [PubMed] [Google Scholar]
- 11.Kim WR, Biggins SW, Kremers WK, et al. Hyponatremia and mortality among patients on the liver-transplant waiting list. N Engl J Med. 2008;359:1018–26. doi: 10.1056/NEJMoa0801209. [DOI] [PMC free article] [PubMed] [Google Scholar]
- 12.Ruf AE, Kremers WK, Chavez LL, et al. Addition of serum sodium into the MELD score predicts waiting list mortality better than MELD alone. Liver Transpl. 2005;11:336–43. doi: 10.1002/lt.20329. [DOI] [PubMed] [Google Scholar]
- 13.Harrell FE, Jr, Lee KL, Mark DB. Multivariable prognostic models: issues in developing models, evaluating assumptions and adequacy, and measuring and reducing errors. Stat Med. 1996;15:361–87. doi: 10.1002/(SICI)1097-0258(19960229)15:4<361::AID-SIM168>3.0.CO;2-4. [DOI] [PubMed] [Google Scholar]
- 14.Pencina MJ, D’Agostino RB, Sr, D’Agostino RB, Jr, et al. Evaluating the added predictive ability of a new marker: from area under the ROC curve to reclassification and beyond. Stat Med. 2008;27:157–72. doi: 10.1002/sim.2929. discussion 207–12. [DOI] [PubMed] [Google Scholar]
- 15.Ware JH. The limitations of risk factors as prognostic tools. N Engl J Med. 2006;355:2615–7. doi: 10.1056/NEJMp068249. [DOI] [PubMed] [Google Scholar]
- 16.Wang TJ, Gona P, Larson MG, et al. Multiple biomarkers for the prediction of first major cardiovascular events and death. N Engl J Med. 2006;355:2631–9. doi: 10.1056/NEJMoa055373. [DOI] [PubMed] [Google Scholar]
- 17.Asbert M, Gines A, Gines P, et al. Circulating levels of endothelin in cirrhosis. Gastroenterology. 1993;104:1485–91. doi: 10.1016/0016-5085(93)90360-o. [DOI] [PubMed] [Google Scholar]
- 18.Altman DG, Royston P. What do we mean by validating a prognostic model? Stat Med. 2000;19:453–73. doi: 10.1002/(sici)1097-0258(20000229)19:4<453::aid-sim350>3.0.co;2-5. [DOI] [PubMed] [Google Scholar]


