

Abstract
The introduction of total prostate specific antigen (tPSA) testing in serum has revolutionized the detection and management of men with prostate cancer (PCa). This review will highlight some of the exciting new developments in the field of PCa screening in general and from our SPORE research program at Memorial-Sloan Kettering Cancer Center. First, it is important to understand that the inherent variability of tPSA levels affects the interpretation of any single results. Total variation in tPSA includes both analytical (i.e., pre-analytical sample handling, laboratory processing, assay performance, and standardization) and biological variation (i.e., metabolism, renal elimination, medication, physical and sexual activity, size and integrity of the prostate). Second, recent evidence demonstrates that no single tPSA cut-off separates men at high-risk for PCa from men at low-risk or men with “significant” (high-grade, high-volume) cancer from those with low-grade, indolent cancer. Taken together with a man’s age, family history, ethnicity, and digital rectal exam results, tPSA levels add to the overall estimate of the risk of cancer, allowing men to share in the decision about a biopsy. Third, men who will eventually develop PCa have increased tPSA levels years or decades before the cancer is diagnosed. These tPSA levels may reflect the long duration of prostate carcinogenesis and raise the question about a causal role for tPSA in PCa development and progression. tPSA measurements before age 50 could help risk-stratify men for intensity of PCa screening. Fourth, enhancing the diagnostic accuracy of tPSA, especially its specificity, is of particular importance, since higher specificity translates into fewer biopsies in men not affected by PCa. While tPSA velocity has been shown to improve the specificity of tPSA, its sensitivity is too low to avoid prostate biopsy in a patient with an elevated tPSA level. Moreover, prospective screening studies have reported that tPSA velocity does not add diagnostic value beyond tPSA level. At this time, tPSA velocity appears most useful after diagnosis and after treatment, but its value in screening and prognostication remains to be shown. Finally, while free PSA molecular isoforms and human kallikrein-related peptidase 2 (hK2) hold the promise for detection, staging, prognosis, and monitoring of PCa, evidence from large prospective clinical trials remain to be reported.
Keywords: prostate-specific antigen, human glandular kallikrein, prostate cancer, prognosis, detection
Introduction
Prostate cancer (PCa) is the most commonly diagnosed cancer in American men and the second leading cause of cancer-related deaths. The wide availability of total prostate-specific antigen (tPSA) revolutionized PCa screening and ushered in the tPSA era. This has resulted in earlier PCa detection and an increase in incidence. However, it remains unclear whether screening for PCa results in lower PCa mortality. Indirect evidence from observational and case control studies is not consistent but does suggest the highly prevalent screening in this country has played a substantial role in the decrease in PCa mortality in the United States.1 Advocates of screening point to an increased rate of discovery of lower-stage cancer, a decline in the incidence of metastatic disease, and a reduction in cancer-related mortality after widespread tPSA screening. Critics of tPSA screening, on the other hand, point to high rates of over-detection: the lifetime risk of diagnosis is currently ~18%, whereas that for death from PCa is ~3%. A major problem with tPSA is its lack of cancer specificity. An elevated tPSA level can reflect the presence of cancer but can also be caused by benign prostatic hyperplasia (BPH), infection, and/or chronic inflammation. All prostate epithelial cells, whether normal, hyperplastic or cancerous, synthesize PSA. Neoplastic cells produce somewhat lower tissue levels of tPSA compared to BPH cells although both conditions cause tPSA elevation in the blood. Therefore, it has been suggested that tPSA should be considered as a marker of BPH-related prostate volume, growth, and outcome rather than a reliable marker of PCa.2-4 In addition, there is continuing disagreement over the threshold level of tPSA that should indicate biopsy. Finally, tPSA levels do not directly correlate with the biologic behavior of PCa. This can lead to over-detection and over-treatment, resulting in increased cost, side effects, complications, and patient anxiety.
In addition to its use for early detection, use of tPSA testing has been found useful as an aid to predict PCa risk and of treatment outcome. Indeed, tPSA is one of the key variables in pre- and post-treatment prognostic models for clinically localized prostate cancer.5-7 However, Stamey et al. have reported that for patients with a tPSA level of < 9 ng/mL, tPSA poorly reflected the risk of biochemical recurrence (BCR) after radical prostatectomy but was significantly correlated with the volume of the radical prostatectomy specimen, a direct reflection of the degree of BPH present.8-10
The purpose of this review is to discuss (1) the inherent variability of serum tPSA levels, (2) the need to replace tPSA cut-offs with prediction tools that incorporate established risk factors, (3) the predictive value of tPSA in young man and the impact it could have on the age of onset and intensity of PCa screening, (4) the controversies of tPSA velocity (tPSAV), and (5) the association of free PSA and its isoforms as well as human kallikrein-related peptidase 2 (hK2) with PCa-risk and outcomes.
PSA Variability
It is important to consider the variability of tPSA and its derivatives in screening and monitoring of individuals over time. Total variation in tPSA includes analytical and biological variation. Analytical variation depends on assay performance, sample handling, and laboratory processing.11,12 Biological variation relates to individual factors such as tPSA metabolism, renal elimination, and physical and sexual activity.13,14
First, transitory tPSA outliers, which may be due to infection, or following digital rectal examination (DRE) or prostate biopsies, may lead to non-cancer-related higher tPSA value and result in a higher tPSA velocity (tPSAV). Oscillations up to 20–30% in the tPSA range 0.1–20 ng/mL may be due to biological variation.15,16 Second, the use of different detection assays may be another important cause of variation. Differences in assay standardization can give an artifactually high or low estimate of tPSA and tPSAV.17-19 Assays are not interchangeable and caution should be exercised when comparing results from different commercial tPSA assays. Patients and physicians should be aware of which assay was used each time a tPSA measurement is performed, and an effort should be made to use the same assay at the next screening visit. In addition, studies of tPSA kinetics over time using different assays should be interpreted with caution.
Third, the effect of previous BPH treatment on tPSA remains mostly unpredictable. For example, the effect of commonly used 5-α-reductase inhibitors on the predictive value of tPSA kinetics for tumor progression is uncertain. Because 5-α-reductase inhibitors are known to decrease the PSA level with ~50% and mostly suppress the benign components of PSA secretion, they may enhance the utility of tPSA and tPSAV.20 In addition, by shrinking the prostate gland, finasteride may increase the likelihood of detecting a small cancer on needle biopsy. It was initially implicated but recently refuted that finasteride also may induce the regression of low-grade but not high-grade PCa.21
This large normal variability of tPSA requires larger changes between two consecutive measurements to distinguish pathologic changes from changes resulting from analytical and biological variations. Nixon et al. calculated the coefficient of variation (CV) over 2 weeks and demonstrated that a change between two tPSA measurements of approximately 25% indicated a significant change.22,23 Bunting et al. reported a critical difference, defined as the minimum percent change between two consecutive measurements that suggests a significant change beyond the normal variation, close to 60% over a time period of 1 year.24 Bruun et al. recently assessed the long-term variability of the different forms of tPSA at several different tPSA levels in a randomly selected population of asymptomatic and apparently healthy men whose tPSA levels were <2.0 ng/mL at the end of the 8-year observation period.25 They found that the total intra-individual variation of tPSA was much less than that reported by Bunting et al.24 and somewhat higher than the intra-individual variation for either free PSA or percent free PSA. This suggests that free PSA concentration in blood may vary less than complexed PSA concentration, which is the major contributor to tPSA. One explanation is that free PSA and complexed PSA may have different elimination pathways, and hence different elimination rates.13,26-28
Recently, Eastham et al. evaluated the year-to-year fluctuations in tPSA levels over a period of 4 years in a cohort of men selected from a polyp-prevention trial study group.29 Several cut-off points for tPSA were studied; 30% and 26% of the men with a tPSA level >4 ng/mL and >2.5 ng/mL, respectively, had a tPSA value below these cut-offs at the next tPSA-testing.
Optimal tPSA Cut-off Values: no single tPSA cut-off separates men at high risk for PCa from men at low risk, nor men affected with high-grade disease from those with low-grade disease
At a tPSA cut-off of ≥4 ng/mL, a significant cancers remain undetected30 and intervention at lower tPSA levels has been proposed to improve patient outcomes.31,32 Catalona et al. found that 22% of men with a normal digital rectal examination and a serum tPSA level between 2.6 and 4.0 ng/mL have PCa, and 81% of them have organ-confined disease.33 Data from the Prostate Cancer Prevention Trial (PCPT) revealed that as many as 15% of men with normal digital rectal examination and a serum tPSA less than 4.0 ng/mL have PCa.30 Among men with tPSA levels ≤0.5, 0.6–1.0, 1.1–2.0, 2.1–3.0, and 3.1–4.0 ng/mL, PCa was detected in 6.6%, 10.1%, 17.0%, 23.9%, and 26.9%, respectively. Moreover, approximately 25% of these men had a tumor with Gleason score of 7 or higher. These and other investigators demonstrated that increasing levels of tPSA are associated with increasing probability of PCa risk within the 0-4.0 ng/mL interval.30,34,35 There is no tPSA threshold at age 62-91 below which PCa can be ruled out with high specificty.30 No single tPSA cut-off separates men with “significant” (high grade, high volume) cancer from those with low-grade, possibly insignificant cancer. Similar to PCa presence, high-grade cancer can be found in men with low tPSA levels.
On the other hand, as of now, there is no evidence that lowering the tPSA threshold below 4 ng/mL improves the long-term survival in men with PCa, while continuing to maintain the cost-effectiveness of screening programs. Lowering the tPSA threshold combined with decreasing the age of tPSA screening may be beneficial for men who are at an increased risk for PCa (i.e., strong family history of PCa and/or African-American race). However, consideration must be given to the possibility that lowering the tPSA threshold could result in unnecessary biopsies and an increased detection of indolent cancers. Finally, determination of the optimal, institution-specific, and management-guiding threshold involves not only clinical and epidemiologic features but should also consider the social and psychological implications of prostate biopsy and possible PCa detection.
The difficulty in selecting a cut-off to define what constitutes an abnormal tPSA suggests that tPSA is most useful as a continuous variable, providing a spectrum of prostate cancer risk. Therefore, we prefer to include serum tPSA levels in an overall estimate of the risk of cancer, inform the patient of his particular risk, then make a shared decision about a biopsy.7,30,34,36-40 Nam et al., for example, developed a model that predicts an individual’s risk for PCa in a cohort of 3,108 men who underwent a prostate biopsy for the first time.40 The model comprises factors that can be easily determined at the time of screening such as age, ethnicity, family history of PCa, the presence of urinary symptoms, tPSA, percent free PSA, and digital rectal examination (Figure 1). Addition of all these risk factors improved the predictive accuracy of a base model from 0.62 to 0.74. The main advantage of this and other predictive tools7 is that clinicians can assess PCa risk on an individual basis and make management decisions. However, despite the reasonable accuracy, similar to all predictive tools, the exact probability cut-off for undergoing or foregoing a biopsy is left with the treating physician and patient and should be individualized.
Figure 1. Nomogram prediction model for predicting prostate cancer at the time of biopsy.

The nomogram is used by first locating a patient’s position for each variable on its horizontal scale and then a point value is assigned according to the points scale (top axis) and summed for all variables. Total points correspond to a probability value for having prostate cancer or aggressive prostate cancer. PSA, prostate-specific antigen; DRE, digital rectal examination. (Reproduced, with permission, from Nam, RK et al. Assessing individual risk for prostate cancer. J Clin Oncol. 25(24):3582-8, 2007).40
Long-term prediction of the future risk of PCa using tPSA
Several studies have suggested that tPSA levels are associated with the risk of PCa years, or even decades, before its diagnosis. The first long-term prediction study, which reported that tPSA levels >2.5 ng/mL predicted diagnosis of PCa over the subsequent decade was limited by the small number of cancer cases (n=44) and by the degradation of tPSA in archived serum samples.41 In a prospective study involving a large number of cases, the lead time between tPSA levels ≥4 ng/mL and the subsequent clinical diagnosis of PCa was estimated at 5.5 years.42 Similarly, Fang et al. studied the risk of PCa diagnosis in a cohort of 549 men following a baseline tPSA measurement at age 40–60 while providing a median follow-up of ~13 years.43 They concluded a tPSA value above the age-adjusted median carried a relative risk of subsequent cancer diagnosis of ~3.6.
Two larger studies extended prediction models to lower tPSA ranges and longer follow-up intervals. Loeb et al. examined 1,178 men in their 40s who had risk factors for PCa.44 The risk of subsequent PCa diagnosis was 14.6-fold higher for men with a baseline tPSA level between 0.7 and 2.5 ng/mL compared to men with tPSA <0.7 ng/mL. Lilja et al. assessed PCa risk among 21,277 men younger than 50 years when they attended the Malmö Preventive Medicine study (MPM), a cardiovascular risk assessment study conducted between 1974 and 1986 in Malmö, Sweden.45 The investigators measured tPSA levels in archived plasma obtained from 462 participants diagnosed with PCa within a median of 18 years from start of the study and from 1,222 matched controls. Of note, the attendance rate was high (74%) and the rate of tPSA testing in Sweden was low during most of the study period, leaving this study largely free of over-detection or selection biases. tPSA level at age 44–50 was very strongly associated with the likelihood of developing PCa up to 25 years later (Figure 2). The odds ratio for a PCa diagnosis at a tPSA value of 0.51–1.0 ng/mL was 2.51 compared to tPSA ≤0.50 ng/mL, which roughly corresponded to the population average. The odds ratio inreased to 7.02 for a tPSA of 1.0-1.5 ng/mL, and further up to 19.01 for a tPSA of 2.01-3.0 ng/ml compared to a tPSA ≤0.50 ng/mL. In a follow-up study, the authors have further shown that tPSA level at age 44–50 predicts the likelihood of developing advanced PCa, defined as either locally advanced (clinical T3 or higher) or metastatic disease at the time of diagnosis.46 In another analysis of the MPM-study cohort, the value of PSA-assessments in these younger men were compared with the blood taken from 1,167 men of ages 59–61 years.47 In this study, the prognostic accuracy of PSA (both tPSA and complexed PSA, described below) decreased with age. The authors hypothesized that these findings result from a greater prevalence of BPH (and therefore of non-cancer-related tPSA increase) among older men.
Figure 2. Early prediction of prostate cancer risk.

The predicted probability of a prostate cancer diagnosis before the age of 75 years by total prostate-specific antigen (tPSA) measured at age 44–50 years, with 95% confidence intervals. The vertical lines represent the 25th, 50th, 75th and 90th percentiles of baseline tPSA, and the horizontal line represents the average lifetime risk (10%) of a prostate cancer diagnosis before the age of 75 years. Note that the tPSA levels reported from this study are approximately 13% lower than values derived from assays calibrated against the World Health Organization standard.
(Reproduced, with permission, from Lilja, H. et al. Long-term prediction of prostate cancer up to 25 years before diagnosis of prostate cancer using prostate kallikreins measured at age 44 to 50 years. J. Clin. Oncol. 25, 431–436, 2007).45
In summary, these studies indicate that men who will eventually develop PCa have increased tPSA levels years or decades before the cancer is diagnosed. These tPSA levels may reflect the long duration of prostate carcinogenesis or could reflect a causal role of tPSA in PCa development and/or progression (Figure 3). A tPSA measurement before age 50 could help risk-stratify men for frequency and/or type of later PCa screening.
Figure 3. Three non-exclusive hypotheses to explain the association between total prostate-specific antigen (tPSA) level in younger men and prostate cancer diagnosed up to 25 years subsequently.

a) A carcinogenic process causes premalignant changes in prostate cells, which in turn increases leaking of PSA into the bloodstream.
b) A carcinogenic process causes premalignant changes in prostate cells. These changes are not sufficient to cause increased levels of serum PSA; however, carcinogenesis independently causes increased serum PSA by a separate process.
c) An unknown process causes an increase in serum PSA; extracellular PSA is causally influencing the carcinogenic process, which leads to premalignant changes in the prostate.
(Reproduced, with permission, from Lilja, H. et al. Prostate-specific antigen and prostate cancer: prediction, detection and monitoring. Nature reviews cancer. 8, 268–278, 2008).48
Approaches to Enhance the Diagnostic Accuracy of tPSA for Detecting Prostate Cancer
Enhancing the diagnostic accuracy of tPSA, particularly specificity, is critical, since higher specificity would reduce the number of biopsies performed in men not affected by PCa. Several different strategies have been investigated, including the use of age-specific tPSA cut-offs, tPSA density, tPSA density of the transition zone, tPSA velocity (tPSAV), and the measurement of various molecular forms of PSA.7,48-50 We will focus on tPSAV and the measurement of various molecular forms of PSA since they have the highest potential for improving our predictive accuracy.
Total PSA Velocity
tPSAV refers to the serial evaluation of serum tPSA concentration over time.51,52 Different methods of calculating tPSAV are available (eg, based on the first and the last measured values only or on a regression line through all available measurements, based on normal or logarithmic values), but only small differences in predictive value have been found among these derivatives. Connolly et al found that using all available PSA measurements in a linear regression analysis should be the method of choice for calculating tPSAV.53 When using the first and last measurements only, these should at least be separated by a sufficiently long time period.
Carter et al. showed that patients with BPH demonstrated a linear increase in tPSA levels over time, whereas patients with PCa had an initial linear increase with a subsequent exponential rise that occurred approximately 5 years before cancer detection.51 In men with an initial tPSA level between 4 and 10 ng/mL, a tPSAV cut-off value of 0.75 ng/mL/y provided a sensitivity and specificity for PCa of 79% and >90%, respectively. If the initial tPSA concentration was less than 4 ng/mL, the specificity of remained >90%, but the sensitivity dropped to an abysmal 11%. These results were questioned using relatively short tPSA intervals of 1 and 2 years.54 Subsequently, Carter et al. showed that tPSAV values are useful if a minimum of three consecutive measurements are taken over a two year period.55 While the specificity of tPSAV is high, its sensitivity is too low to advise against prostate biopsy in a patient with an elevated tPSA level who is otherwise healthy and a good candidate for curative therapy. Other limitations of tPSAV include imprecision due to biological and analytical intra-individual variability (see section on PSA variability) and tPSA stability. Moreover, to date, appropriate tPSAV cut-offs have not been determined for men with tPSA levels below 4 ng/mL. Finally, while tPSAV may be of most use in patients whose serum tPSA concentration at initial screening is below 4 ng/mL, in deciding whether patients with a serum tPSA concentration between 4 and 10 ng/mL should be biopsied.49,56-58
Prospective screening studies have reported that tPSAV does not appear to add diagnostic value for PCa detection beyond that of a single tPSA level. In an analysis of PCPT data, Thompson et al. found that when tPSAV was used alone, it was an independent predictor of PCa presence and aggressiveness.36 However, when tPSAV was adjusted for the effect of tPSA and other standard variables, it lost independent predictive value. Similarly, the first two screening rounds of the Rotterdam section of the ERSPC found that tPSAV did not improve accuracy when combined with tPSA in the prospective setting.57,58 Finally, a recent analysis from the Prostate, Lung, Colon, and Ovarian (PLCO) cancer screening trial showed that although tPSAV was an independent predictor of high-grade disease, addition of tPSAV to tPSA only slightly increased its performance for prediction of high-grade tumors.59 Finally, using a large population-based cohort of men in early middle age who were likely to have a low incidence of BPH, Ulmert et al. found no benefit to calculating tPSAV or the velocity of any other PSA form over tPSA for long-term PCa prediction.60 Of note, the predictive value of tPSAV alone was 0.712, while the predictive value of a single tPSA was higher (concordance index: 0.771) and the combined model including both PSA velocity and tPSA did not alter the predictive accuracy. The observed lack of additional predictive value for tPSAV indicates that tPSA levels do not increase sharply before PCa diagnosis but rise gradually and slowly over many years, also in those men who later present with advanced cancer.
The most compelling support for the role of tPSAV in PCa comes from prognostic studies. Several studies have shown that that a high pre-treatment tPSAV is strongly associated with a poor disease-specific survival following diagnosis and could help identify men with low tPSA values who are at increased risk of harboring a potentially lethal tumor.61-64 Carter et al. found a strong association between survival and higher tPSAV as early as 10-15 years before diagnosis in the Baltimore Longitudinal Study of Aging project.64 Based on these findings, they proposed that a tPSAV threshold of 0.35 ng/mL/year be used in screening men with low tPSA levels to increase the detection of potentially lethal tumors still in the window of curability. These data have prompted debate as to whether this would suffice as evidence to warrant the National Comprehensive Cancer Network to recommend a prostate biopsy if the tPSAV is greater than 0.5 ng/mL/year.65
D’Amico et al. reported that men with a pre-operative tPSAV greater than 2.0 ng/mL/year had a 9.8-fold increased relative risk of death from PCa than men with a lower tPSAV.61 In a more recent study, these investigators reported that tPSAV was also significantly associated with the risk of cancer-specific mortality following external beam radiation therapy.62 Conversely, using data from 267 Scandinavian men with localized PCa and baseline tPSA levels <50 ng/mL, Fall and colleagues found that, although prognostically relevant, baseline tPSA levels and relative tPSAV in the first 2 years following diagnosis were not able to predict accurately which patients would have a lethal PCa outcome.66 Nevertheless, there exists substantial evidence that tPSAV before treatment is associated with outcome, albeit, there is lack of evidence as to whether the predictive accuracy is improved by the combination of tPSAV and tPSA compared to a single tPSA alone.
This discrepancy between the prognostic and screening setting can be partially explained by the mode of detection, the lead time bias, and how tPSAV was measured. Due to the retrospective nature of these articles, there is no proof that the prospective use of tPSAV thresholds can identify men with an unfavorable prognosis at the time when curative treatment is still possible. The observation period necessary for obtaining a valid calculation of tPSAV that is not disturbed by considerable short-term fluctuations may be too long, or the number of tPSA measurements may be too high for use in clinical practice. In addition, tPSAV may not correlate with early tumor progression, but could be a mere indicator of aggressive disease for which the window of curability has already closed. Furthermore, a quickly rising tPSA is more common in men with a high starting tPSA level.67 This proportion of men is expected to be much smaller in a screened cohort than in a clinically diagnosed cohort. In the absence of better alternatives, tPSAV is an important and very practical parameter after diagnosis and/or treatment, but its value in screening and prognostication remains to be proven.
Free PSA
The serine protease, PSA, circulates in the serum in multiple molecular forms consisting of both free (unbound to other proteins) and complexed PSA (i.e. mainly bound to the protease inhibitor alpha-1-antichymotrypsin, ACT) (Figure 4 and 5). The FDA has approved the use of percent free PSA testing [i.e., (free PSA/tPSA) × 100] as an adjunct to tPSA in men with a serum tPSA concentration between 4 and 10 ng/mL. While several studies have shown that percent free PSA helps discriminate men with BPH from those with PCa, the magnitude of this effect varies across populations.68,69 Explanations for these inconsistencies may lie in the limited stability of free PSA in blood, particularly in stored sera.12,70 In addition, PCa patients with larger prostate volumes have higher percent free PSA thereby resulting in lower specificity due to the dilution effect.71 Finally, the most appropriate percent free PSA cut-off value for clinical decision-making remains controversial and percent free PSA may be more valuable as a continuous risk variable. Despite all these limitations, in a recent meta-analysis of 66 studies, percent free PSA has been shown to outperform tPSA and complexed PSA as a predictor for biopsy outcome.72
Figure 4. Time line for the discovery of various forms of PSA.
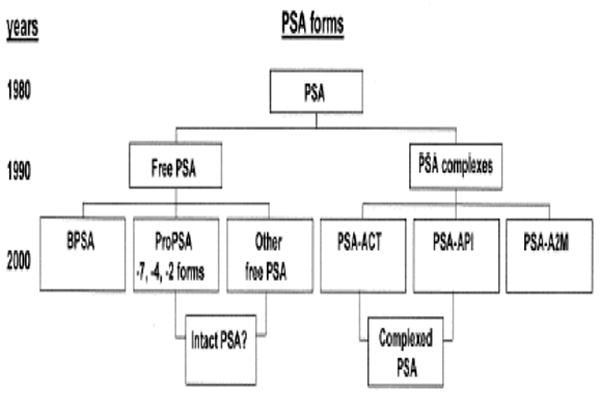
BPSA, benign or BPH-associated free PSA (fPSA); proPSA = precursor propeptide form of fPSA with an intact 7 amino acid-containing peptide leader sequence (-7proPSA) or with either a 3 amino acid peptide [leaving a 4 amino acid peptide remaining (-4proPSA)] or a 5 amino acid peptide (-2proPSA) clipped from the leader sequence of the parent pPSA molecule; other fPSA, refers to other truncated, enzymatically inactive forms of fPSA; intact PSA?, refers to other, as yet unidentified, intact enzymatically inactive forms of free PSA; PSA-ACT, PSA bound to alpha1-antichymotrypsin; PSA-API, PSA bound to alpha1-protease inhibitor; PSA-A2M, PSA bound to alpha2-macroglobulin. (Reproduced, with permission, from Stephan C, Jung K, Diamandis EP, Rittenhouse HG, Lein M, Loening SA.: Prostate-specific antigen, its molecular forms, and other kallikrein markers for detection of prostate cancer. Urology 2002;59:2-8.)95
Figure 5. Prostate-specific antigen (PSA) subforms and interactions.

Active forms of PSA and kallikrein-related peptidase 2 (hK2) are shown in red, inactive forms in blue or green. In the prostate, pro-peptides (grey wedge) are removed from proPSA and prohK2, leaving the mature, catalytic forms. hK2 might be one of the proteases responsible for these processing events. PSA and hK2 are released at high concentrations into prostatic fluid, then into seminal fluid, and at low concentrations into blood. PSA forms in prostatic fluid are active PSA, nicked PSA and PSA complexed with protein C inhibitor (PCI, encoded by SERPINA2), a protease inhibitor. The sizes in the figure indicate the relative abundances of the forms. In seminal fluid, active PSA is believed to be responsible for liquefaction of seminal fluid by proteolysing gel proteins (SEMG1 and SEMG2, which are secreted primarily by the seminal vesicles, though SEMG2 is also secreted in small amounts by the epididymis). Blood contains a variety of forms of PSA: free PSA forms (nicked, intact and proPSA) and complexed PSA. The most abundant form in blood is PSA complexed with α1-antichymotrypsin (ACT); complexes with α2-macroglobulin (A2M) or α1-protease inhibitor (API) are estimated to comprise only a 1–2% or lower proportion of PSA in blood. A2M envelopes PSA, masking the epitopes recognized by commercial PSA assays and thus rendering this form invisible to the assays. PSA levels in seminal fluid are 0.5–3.0 mg/ml (~106-fold higher than in blood) and hk2 levels in seminal fluid are 2–12 microg/ml (~104-fold higher than in blood).
(Reproduced, with permission, from Lilja, H. et al. Prostate-specific antigen and prostate cancer: prediction, detection and monitoring. Nature reviews cancer. 8, 268–278, 2008).48
Overall, percent free PSA might be less useful as a long-term predictor of PCa presence in younger men. Ulmert et al. investigated the value of PSA isoforms in a retrospective study comprising a highly representative subset with over 4,900 men aged ≤50 at the baseline blood draw from the MPM-study cohort.59 They found that among all men aged 44 to 50 years, the combination of tPSA, free PSA, percent free PSA, did not improve the predictive power of tPSA alone, albeit enhancements were found for men with tPSA ≥1.2 ng/mL, and more notably in men with tPSA ≥2.0 ng/ml. In addition, Vickers et al showed that in men aged 59 to 61 years, the combination of percent free PSA, hK2 and tPSA was significantly superior to tPSA alone (AUC 0.819 versus 0.794, respectively), whereas thid combination of markers was unable to enhance cancer risk predictions among men aged ≤50 at baseline. A hypothesis for this finding is that a shorter time delay between tPSA measurement and cancer diagnosis and increased frequency of BPH enhances the predictive value of both percent free PSA and hK2 among older men, whereas increased frequency of BPH decreases the predictive value of tPSA in older men.47
Measuring distinct subfractions of free PSA: proPSA, intact PSA, nicked PSA, and BPSA
The free PSA in the blood is (micro)heterogeneous and exists mainly as four distinctly defined sub-fractions, all of which are enzymatically inactive (Figure 5). Similar to most secreted peptide enzymes, PSA is initially produced as a 261-amino-acid pre-pro-protein. Co-translational removal of an amino-terminal leader generates a non-catalytic zymogen (proPSA). Subsequent removal of the 7-residue pro-peptide generates the catalytically active mature form, a 237-residue single-chain enzyme containing five intra-chain disulphide bonds.
ProPSA
Compared to BPH-associated transition zone epithelium, PCa tissues have been found to contain higher levels of truncated versions of proPSA with either two (-2proPSA) or four (-4proPSA) extending N-terminal of the mature 237-amino acid single-chain sequence.73 In a preliminary study of men with a tPSA value between 6 and 24 ng/mL, the fraction of -2proPSA in the men with and without PCa ranged from 25% to 95% and 6% to 19%, respectively.73 In this study, -2proPSA was also reported to be a stable (i.e., not cleaved by either hK2 or trypsin), enzymatically inactive form of free PSA. In a follow-up study, Sokoll et al. found that in men with tPSA levels between 2.5 to 4.0 ng/mL, the percentage of proPSA to free PSA ratio was 50.1% in men with PCa versus 35.5% in men with a negative prostate biopsy.74 A higher percentage of proPSA-to-fPSA also has been associated with a higher risk for PCa in men with tPSA levels between 4.0 and 10 ng/ml.75 Finally, a higher pre-operative proPSA to free PSA ratio has been associated with higher Gleason grade, extracapsular tumor extension, and BCR after radical prostatectomy.76-78 After validation in large, prospective studies, addition of preoperative proPSA to free PSA ratio measurements to standard preoperative predictive models may improve prediction of PCa features and outcomes.
Intact PSA
Other assays recognizing distinctly different antigenic epitopes on free PSA have also been implicated to be useful tools to distinguish critical free PSA heterogeneity in blood as it measures only intact (i.e. both mature and proPSA single-chain PSA), but does not recognize any nicked mutli-chain PSA-forms that are cleaved between Lys145 and Lys146. The level of intact PSA and the ratio of nicked to tPSA have shown potential for improving the discrimination of PCa from BPH.79,80 Similarly to free PSA, intact PSA levels degrade with freezing, storage, and thawing.79
Vickers et al. evaluated whether a multivariable model including tPSA, free PSA, intact PSA, and hK2 predict the results of a prostate biopsy in previously unscreened men with elevated tPSA from the Göteborg cohort of the European Randomized study of Screening for Prostate Cancer screening (ERSPC).70 They found that a statistical model including the four markers predicts the result of biopsy more accurately than a model incorporating tPSA and age alone. The area-under-the-curve (AUC) for a predictive “base” model including age and tPSA was 0.680; incorporating the additional markers into the model significantly increased predictive accuracy to an AUC of 0.832. A similar significant increment in predictive accuracy was seen if the digital rectal exam was added to the base model. Moreover, decision analytic methods revealed that application of the model would lead to notably superior clinical outcomes than the current strategy of biopsying all men with elevated tPSA.
BPSA
Another distinct form of the mutli-chain cleaved free PSA, BPSA, forms through the clipping of intact single-chain free PSA between amino-acid residues Lys182 and Ser183 resulting in a neo-epitope. BPSA is present in prostatic tissue, blood, and seminal plasma.73 BPSA expression has been localized to the nodular hyperplasia of the transition zone of men with BPH.81 Serum levels of BPSA are higher in men with symptomatic BPH compared to men without lower urinary tract symptoms suggestive of BPH.73 Moreover, serum BPSA levels are almost undetectable in healthy men. Further studies have confirmed that serum levels of BPSA correlate with pathologic nodular hyperplasia of the prostate.82,83 Therefore, measurements of BPSA may hold most promise as a serum marker for BPH.
In summary, while assays capable of distinguishing distinct free PSA sub-fractions in the blood hold the promise of providing new tools for detection, staging, prognosticating, and monitoring of PCa, independent replication of data from large prospective clinical trials remain to be reported. In addition, BPSA or nicked PSA, either alone or (quite likely) in combination with free or total PSA, may be useful in studying the development, clinical progression, and response to therapy of BPH.
Human kallikrein-related peptidase 2
Human kallikrein-related peptidase 2 (hK2) is a serine protease that shares 78% and 80% identity at the amino acid and DNA level with PSA. Moreover, both enzymes are mainly expressed in the prostate and are under androgen regulation. hK2 mRNA amounts to 10–50% of the PSA mRNA in the prostate tissue but in serum and seminal plasma, hK2 concentration is only 1–3% that of PSA. The low levels in serum pose analytical challenges for hK2 measurements but reliable assays are available in several research laboratories.
Some studies have suggested that tissue expression of hK2 may be more strongly associated with PCa presence and progression than tPSA.84,85 In addition, serum levels of hK2 and its ratios to free PSA and percent free PSA have been reported to outperform tPSA for PCa detection.85-88 Furthermore, pre-operative serum hK2 has been suggested to be a stronger predictor of PCa grade, stage, and volume in the prostatectomy specimens than tPSA or free PSA.89-93 Recently, preoperative serum hK2 has also been shown to predict BCR with high accuracy.93 In a cohort of 867 patients treated with radical prostatectomy for clinically localized disease, the predictive accuracy of hK2 for BCR after surgery was 0.721 (concordance index) versus 0.691 for tPSA. This difference in predictive accuracy was more pronounced in men with a tPSA <10 ng/mL (0.739 for hK2 vs. 0.599 for tPSA, p<0.0005). Moreover, addition of hK2 significantly improved the predictive accuracy of a preoperative nomogram for prediction of BCR consisting of tPSA, clinical stage and biopsy Gleason grade.
In summary, hK2 seems to add statistically and clinically important information for PCa detection and, more importantly, for PCa prognostication, especially in the tPSA range below 10 ng/mL. This is particularly important, as most men diagnosed nowadays with PCa have a tPSA below 10 ng/mL and this is the range where risk stratification using tPSA alone does not perform very well. Nevertheless, these findings need to be externally validated using independent large, well-designed studies before hK2 can applied in clinical practice.
Decision analysis tools that integrate risk factors with markers to improve clinical decision-making
In addition to tPSA and digital rectal examination findings, there are other risk factors of importance, such as age, family history of PCa, ethnicity, other hereditary and environmental factors and attributes (e.g., diet, body mass index, supplement use), and a prior biopsy with negative results for cancer. Historically, physicians estimated a patient’s risk based on clinical and anecdotal experience combined with an understanding of the medical literature, but such an approach is clearly biased.7,37,94 Formal predictive/prognostic tools based on statistical models provide more accurate estimates and are widely available.7,37,94 These models routinely perform as well as or better than clinical judgment.7,37,94 The estimates of risk and their potential consequences, the advantages and disadvantages of this knowledge, and subsequent treatment options can be discussed with the patient prior to undergoing biopsy or repeat biopsy.7,37,94 Patients can then use their own priorities regarding disease, treatment and functional changes after treatment to decide whether to proceed with a biopsy. Ultimately, this counseling process will create a better-informed patient if a prostate biopsy is performed and cancer is detected.
Acknowledgments
Grant sponsor: National Cancer Institute; Grant number: P50-CA92629, SPORE Pilot Project 7.
Grant sponsor: National Institute of Health; T32 training grant (T32CA082088).
Abbreviations
- AUC
area under the receiver operative characteristic curve
- BCR
biochemical recurrence
- BPH
benign prostatic hyperplasia
- CV
coefficient of variation
- c-index
concordance index
- free PSA
free prostate-specific antigen
- percent free PSA
free-to-total prostate specific antigen ratio
- hK2
human glandular kallikrein 2
- PSA
prostate-specific antigen
- RP
radical prostatectomy
- tPSA
total prostate-specific antigen
Footnotes
Financial disclosures: Dr. Hans Lilja holds patents for free PSA and hK2 assays.
References
- 1.Loeb S, Catalona WJ. Prostate-specific antigen in clinical practice. Cancer Lett. 2007;249:30–9. doi: 10.1016/j.canlet.2006.12.022. [DOI] [PubMed] [Google Scholar]
- 2.Roehrborn CG, McConnell JD, Lieber M, et al. Serum prostate-specific antigen concentration is a powerful predictor of acute urinary retention and need for surgery in men with clinical benign prostatic hyperplasia. PLESS Study Group. Urology. 1999;53:473–80. doi: 10.1016/s0090-4295(98)00654-2. [DOI] [PubMed] [Google Scholar]
- 3.Roehrborn CG, McConnell J, Bonilla J, et al. Serum prostate specific antigen is a strong predictor of future prostate growth in men with benign prostatic hyperplasia. PROSCAR long-term efficacy and safety study. J Urol. 2000;163:13–20. [PubMed] [Google Scholar]
- 4.Roehrborn CG, Boyle P, Gould AL, et al. Serum prostate-specific antigen as a predictor of prostate volume in men with benign prostatic hyperplasia. Urology. 1999;53:581–9. doi: 10.1016/s0090-4295(98)00655-4. [DOI] [PubMed] [Google Scholar]
- 5.Kattan MW, Eastham JA, Stapleton AM, et al. A preoperative nomogram for disease recurrence following radical prostatectomy for prostate cancer. J Natl Cancer Inst. 1998;90:766–71. doi: 10.1093/jnci/90.10.766. [DOI] [PubMed] [Google Scholar]
- 6.Partin AW, Kattan MW, Subong EN, et al. Combination of prostate-specific antigen, clinical stage, and Gleason score to predict pathological stage of localized prostate cancer. A multi-institutional update. Jama. 1997;277:1445–51. see comments published erratum appears in JAMA 1997 Jul 9;278(2):118. [PubMed] [Google Scholar]
- 7.Shariat SF, Karakiewicz PI, Margulis V, et al. Inventory of prostate cancer predictive tools. Curr Opin Urol. 2008;18:279–296. doi: 10.1097/MOU.0b013e3282f9b3e5. [DOI] [PubMed] [Google Scholar]
- 8.Stamey TA. Preoperative serum prostate-specific antigen (PSA) below 10 microg/l predicts neither the presence of prostate cancer nor the rate of postoperative PSA failure. Clin Chem. 2001;47:631–4. [PubMed] [Google Scholar]
- 9.Stamey TA, Johnstone IM, McNeal JE, et al. Preoperative serum prostate specific antigen levels between 2 and 22 ng./ml. correlate poorly with post-radical prostatectomy cancer morphology: prostate specific antigen cure rates appear constant between 2 and 9 ng./ml. J Urol. 2002;167:103–11. [PubMed] [Google Scholar]
- 10.Noguchi M, Stamey TA, McNeal JE, et al. Preoperative serum prostate specific antigen does not reflect biochemical failure rates after radical prostatectomy in men with large volume cancers. J Urol. 2000;164:1596–600. [PubMed] [Google Scholar]
- 11.Piironen T, Pettersson K, Suonpaa M, et al. In vitro stability of free prostate-specific antigen (PSA) and prostate-specific antigen (PSA) complexed to alpha 1-antichymotrypsin in blood samples. Urology. 1996;48:81–7. doi: 10.1016/s0090-4295(96)00616-4. [DOI] [PubMed] [Google Scholar]
- 12.Ulmert D, Becker C, Nilsson JA, et al. Reproducibility and accuracy of measurements of free and total prostate-specific antigen in serum vs plasma after long-term storage at -20 degrees C. Clin Chem. 2006;52:235–9. doi: 10.1373/clinchem.2005.050641. [DOI] [PubMed] [Google Scholar]
- 13.Djavan B, Shariat S, Ghawidel K, et al. Impact of chronic dialysis on serum PSA, free PSA, and free/total PSA ratio: is prostate cancer detection compromised in patients receiving long-term dialysis?PG - 1169-74. Urology. 1999;53 doi: 10.1016/s0090-4295(99)00010-2. [DOI] [PubMed] [Google Scholar]
- 14.Bruun L, Bjork T, Lilja H, et al. Percent-free prostate specific antigen is elevated in men on haemodialysis or peritoneal dialysis treatment. Nephrol Dial Transplant. 2003;18:598–603. doi: 10.1093/ndt/18.3.598. [DOI] [PubMed] [Google Scholar]
- 15.Soletormos G, Semjonow A, Sibley PE, et al. Biological variation of total prostate-specific antigen: a survey of published estimates and consequences for clinical practice. Clin Chem. 2005;51:1342–51. doi: 10.1373/clinchem.2004.046086. [DOI] [PubMed] [Google Scholar]
- 16.Roehrborn CG, Pickens GJ, Carmody T., 3rd Variability of repeated serum prostate-specific antigen (PSA) measurements within less than 90 days in a well-defined patient population. Urology. 1996;47:59–66. doi: 10.1016/s0090-4295(99)80383-5. [DOI] [PubMed] [Google Scholar]
- 17.Link RE, Shariat SF, Nguyen CV, et al. Variation in prostate specific antigen results from 2 different assay platforms: clinical impact on 2304 patients undergoing prostate cancer screening. J Urol. 2004;171:2234–8. doi: 10.1097/01.ju.0000127736.86597.e7. [DOI] [PubMed] [Google Scholar]
- 18.Sotelo RJ, Mora KE, Perez LH, et al. Assay standardization bias: different prostate cancer detection rates and clinical outcomes resulting from different assays for free and total prostate-specific antigen. Urology. 2007;69:1143–6. doi: 10.1016/j.urology.2007.02.006. [DOI] [PubMed] [Google Scholar]
- 19.Stephan C, Klaas M, Muller C, et al. Interchangeability of measurements of total and free prostate-specific antigen in serum with 5 frequently used assay combinations: an update. Clin Chem. 2006;52:59–64. doi: 10.1373/clinchem.2005.059170. [DOI] [PubMed] [Google Scholar]
- 20.Thompson IM, Chi C, Ankerst DP, et al. Effect of finasteride on the sensitivity of PSA for detecting prostate cancer. J Natl Cancer Inst. 2006;98:1128–33. doi: 10.1093/jnci/djj307. [DOI] [PubMed] [Google Scholar]
- 21.Lucia MS, Epstein JI, Goodman PJ, et al. Finasteride and high-grade prostate cancer in the Prostate Cancer Prevention Trial. J Natl Cancer Inst. 2007;99:1375–83. doi: 10.1093/jnci/djm117. [DOI] [PubMed] [Google Scholar]
- 22.Nixon RG, Wener MH, Smith KM, et al. Day to day changes in free and total PSA: significance of biological variation. Prostate Cancer Prostatic Dis. 1997;1:90–96. doi: 10.1038/sj.pcan.4500212. [DOI] [PubMed] [Google Scholar]
- 23.Nixon RG, Wener MH, Smith KM, et al. Biological variation of prostate specific antigen levels in serum: an evaluation of day-to-day physiological fluctuations in a well-defined cohort of 24 patients. J Urol. 1997;157:2183–90. doi: 10.1016/s0022-5347(01)64711-6. [DOI] [PubMed] [Google Scholar]
- 24.Bunting PS, DeBoer G, Choo R, et al. Intraindividual variation of PSA, free PSA and complexed PSA in a cohort of patients with prostate cancer managed with watchful observation. Clin Biochem. 2002;35:471–5. doi: 10.1016/s0009-9120(02)00345-4. [DOI] [PubMed] [Google Scholar]
- 25.Bruun L, Becker C, Hugosson J, et al. Assessment of intra-individual variation in prostate-specific antigen levels in a biennial randomized prostate cancer screening program in Sweden. Prostate. 2005;65:216–21. doi: 10.1002/pros.20286. [DOI] [PMC free article] [PubMed] [Google Scholar]
- 26.Birkenmeier G, Struck F, Gebhardt R. Clearance mechanism of prostate specific antigen and its complexes with alpha2-macroglobulin and alpha1-antichymotrypsin. J Urol. 1999;162:897–901. doi: 10.1097/00005392-199909010-00086. [DOI] [PubMed] [Google Scholar]
- 27.Bjork T, Ljungberg B, Piironen T, et al. Rapid exponential elimination of free prostate-specific antigen contrasts the slow, capacity-limited elimination of PSA complexed to alpha 1-antichymotrypsin from serum. Urology. 1998;51:57–62. doi: 10.1016/s0090-4295(97)00572-4. [DOI] [PubMed] [Google Scholar]
- 28.Lilja H, Haese A, Bjork T, et al. Significance and metabolism of complexed and noncomplexed prostate specific antigen forms, and human glandular kallikrein 2 in clinically localized prostate cancer before and after radical prostatectomy. J Urol. 1999;162:2029–34. doi: 10.1016/S0022-5347(05)68093-7. discussion 2034-5. [DOI] [PubMed] [Google Scholar]
- 29.Eastham JA, Riedel E, Scardino PT, et al. Variation of serum prostate-specific antigen levels: an evaluation of year-to-year fluctuations. Jama. 2003;289:2695–700. doi: 10.1001/jama.289.20.2695. [DOI] [PubMed] [Google Scholar]
- 30.Thompson IM, Pauler DK, Goodman PJ, et al. Prevalence of prostate cancer among men with a prostate-specific antigen level < or =4.0 ng per milliliter. N Engl J Med. 2004;350:2239–46. doi: 10.1056/NEJMoa031918. [DOI] [PubMed] [Google Scholar]
- 31.Berger AP, Volgger H, Rogatsch H, et al. Screening with low PSA cutoff values results in low rates of positive surgical margins in radical prostatectomy specimens. Prostate. 2002;53:241–5. doi: 10.1002/pros.10167. [DOI] [PubMed] [Google Scholar]
- 32.Catalona WJ, Ramos CG, Carvalhal GF, et al. Lowering PSA cutoffs to enhance detection of curable prostate cancer. Urology. 2000;55:791–5. doi: 10.1016/s0090-4295(99)00602-0. [DOI] [PubMed] [Google Scholar]
- 33.Catalona WJ, Smith DS, Ornstein DK. Prostate cancer detection in men with serum PSA concentrations of 2.6 to 4.0 ng/mL and benign prostate examination. Enhancement of specificity with free PSA measurements. Jama. 1997;277:1452–5. [PubMed] [Google Scholar]
- 34.Thompson IM, Ankerst DP, Chi C, et al. Operating characteristics of prostate-specific antigen in men with an initial PSA level of 3.0 ng/ml or lower. Jama. 2005;294:66–70. doi: 10.1001/jama.294.1.66. [DOI] [PubMed] [Google Scholar]
- 35.Efstathiou JA, Chen MH, Catalona WJ, et al. Prostate-specific antigen-based serial screening may decrease prostate cancer-specific mortality. Urology. 2006;68:342–7. doi: 10.1016/j.urology.2006.02.030. [DOI] [PubMed] [Google Scholar]
- 36.Thompson IM, Ankerst DP, Chi C, et al. Assessing prostate cancer risk: results from the Prostate Cancer Prevention Trial. J Natl Cancer Inst. 2006;98:529–34. doi: 10.1093/jnci/djj131. [DOI] [PubMed] [Google Scholar]
- 37.Kattan MW. When and how to use informatics tools in caring for urologic patients. Nat Clin Pract Urol. 2005;2:183–90. doi: 10.1038/ncpuro0144. [DOI] [PubMed] [Google Scholar]
- 38.Kattan MW, Eastham JA, Wheeler TM, et al. Counseling men with prostate cancer: a nomogram for predicting the presence of small, moderately differentiated, confined tumors. J Urol. 2003;170:1792–7. doi: 10.1097/01.ju.0000091806.70171.41. [DOI] [PubMed] [Google Scholar]
- 39.Steyerberg EW, Roobol MJ, Kattan MW, et al. Prediction of indolent prostate cancer: validation and updating of a prognostic nomogram. J Urol. 2007;177:107–12. doi: 10.1016/j.juro.2006.08.068. discussion 112. [DOI] [PubMed] [Google Scholar]
- 40.Nam RK, Toi A, Klotz LH, et al. Assessing individual risk for prostate cancer. J Clin Oncol. 2007;25:3582–8. doi: 10.1200/JCO.2007.10.6450. [DOI] [PubMed] [Google Scholar]
- 41.Stenman UH, Hakama M, Knekt P, et al. Serum concentrations of prostate specific antigen and its complex with alpha 1-antichymotrypsin before diagnosis of prostate cancer. Lancet. 1994;344:1594–1598. doi: 10.1016/s0140-6736(94)90405-7. [DOI] [PubMed] [Google Scholar]
- 42.Gann PH, Hennekens CH, Stampfer MJ. A prospective evaluation of plasma prostate-specific antigen for detection of prostatic cancer. Jama. 1995;273:289–94. see comments. [PubMed] [Google Scholar]
- 43.Fang J, Metter EJ, Landis P, et al. Low levels of prostate-specific antigen predict long-term risk of prostate cancer: results from the Baltimore Longitudinal Study of Aging. Urology. 2001;58:411–6. doi: 10.1016/s0090-4295(01)01304-8. [DOI] [PubMed] [Google Scholar]
- 44.Loeb S, Roehl KA, Antenor JA, et al. Baseline prostate-specific antigen compared with median prostate-specific antigen for age group as predictor of prostate cancer risk in men younger than 60 years old. Urology. 2006;67:316–20. doi: 10.1016/j.urology.2005.08.040. [DOI] [PubMed] [Google Scholar]
- 45.Lilja H, Ulmert D, Bjork T, et al. Long-term prediction of prostate cancer up to 25 years before diagnosis of prostate cancer using prostate kallikreins measured at age 44 to 50 years. J Clin Oncol. 2007;25:431–6. doi: 10.1200/JCO.2006.06.9351. [DOI] [PubMed] [Google Scholar]
- 46.Ulmert D, Cronin AM, Bjork T, et al. Prostate-specific antigen at or before age 50 as a predictor of advanced prostate cancer diagnosed up to 25 years later: a case-control study. BMC Med. 2008;6:6. doi: 10.1186/1741-7015-6-6. [DOI] [PMC free article] [PubMed] [Google Scholar]
- 47.Vickers AJ, Ulmert D, Serio AM, et al. The predictive value of prostate cancer biomarkers depends on age and time to diagnosis: towards a biologically-based screening strategy. Int J Cancer. 2007;121:2212–7. doi: 10.1002/ijc.22956. [DOI] [PubMed] [Google Scholar]
- 48.Lilja H, Ulmert D, Vickers AJ. Prostate-specific antigen and prostate cancer: prediction, detection and monitoring. Nat Rev Cancer. 2008;8:268–78. doi: 10.1038/nrc2351. [DOI] [PubMed] [Google Scholar]
- 49.Schroder FH, Carter HB, Wolters T, et al. Early detection of prostate cancer in 2007. Part 1: PSA and PSA kinetics. Eur Urol. 2008;53:468–77. doi: 10.1016/j.eururo.2007.10.047. [DOI] [PubMed] [Google Scholar]
- 50.Shariat SF, Karam JA, Roehrborn CG. Blood biomarkers for prostate cancer detection and prognosis. Future Oncol. 2007;3:449–461. doi: 10.2217/14796694.3.4.449. [DOI] [PubMed] [Google Scholar]
- 51.Carter HB, Morrell CH, Pearson JD, et al. Estimation of prostatic growth using serial prostate-specific antigen measurements in men with and without prostate disease. Cancer Res. 1992;52:3323–8. [PubMed] [Google Scholar]
- 52.Carter HB, Pearson JD, Metter EJ, et al. Longitudinal evaluation of prostate-specific antigen levels in men with and without prostate disease. Journal of the American Medical Association. 1992;267:2215–2220. see comments. [PMC free article] [PubMed] [Google Scholar]
- 53.Connolly D, Black A, Murray LJ, et al. Methods of calculating prostate-specific antigen velocity. Eur Urol. 2007;52:1044–50. doi: 10.1016/j.eururo.2006.12.017. [DOI] [PubMed] [Google Scholar]
- 54.Smith DS, Catalona WJ. Rate of change in serum prostate specific antigen levels as a method for prostate cancer detection. J Urol. 1994;152:1163–7. doi: 10.1016/s0022-5347(17)32528-4. [DOI] [PubMed] [Google Scholar]
- 55.Carter HB, Pearson JD, Waclawiw Z, et al. Prostate-specific antigen variability in men without prostate cancer: effect of sampling interval on prostate-specific antigen velocity. Urology. 1995;45:591–6. doi: 10.1016/S0090-4295(99)80049-1. [DOI] [PubMed] [Google Scholar]
- 56.Shariat SF, Karakiewicz PI. Screening for prostate cancer in 2007: the PSA era and its challenges are not over. Eur Urol. 2008;53:457–60. doi: 10.1016/j.eururo.2007.11.060. [DOI] [PubMed] [Google Scholar]
- 57.Schroder FH, Roobol MJ, van der Kwast TH, et al. Does PSA velocity predict prostate cancer in pre-screened populations? Eur Urol. 2006;49:460–5. doi: 10.1016/j.eururo.2005.12.026. discussion 465. [DOI] [PubMed] [Google Scholar]
- 58.Roobol MJ, Kranse R, de Koning HJ, et al. Prostate-specific antigen velocity at low prostate-specific antigen levels as screening tool for prostate cancer: results of second screening round of ERSPC (ROTTERDAM) Urology. 2004;63:309–13. doi: 10.1016/j.urology.2003.09.083. discussion 313-5. [DOI] [PubMed] [Google Scholar]
- 59.Pinsky PF, Andriole G, Crawford ED, et al. Prostate-specific antigen velocity and prostate cancer gleason grade and stage. Cancer. 2007;109:1689–95. doi: 10.1002/cncr.22558. [DOI] [PubMed] [Google Scholar]
- 60.Ulmert D, Serio AM, O’Brien MF, et al. Long-term prediction of prostate cancer: prostate-specific antigen (PSA) velocity is predictive but does not improve the predictive accuracy of a single PSA measurement 15 years or more before cancer diagnosis in a large, representative, unscreened population. J Clin Oncol. 2008;26:835–41. doi: 10.1200/JCO.2007.13.1490. [DOI] [PubMed] [Google Scholar]
- 61.D’Amico AV, Chen MH, Roehl KA, et al. Preoperative PSA velocity and the risk of death from prostate cancer after radical prostatectomy. N Engl J Med. 2004;351:125–35. doi: 10.1056/NEJMoa032975. [DOI] [PubMed] [Google Scholar]
- 62.D’Amico AV, Renshaw AA, Sussman B, et al. Pretreatment PSA velocity and risk of death from prostate cancer following external beam radiation therapy. Jama. 2005;294:440–7. doi: 10.1001/jama.294.4.440. [DOI] [PubMed] [Google Scholar]
- 63.Patel DA, Presti JC, Jr, McNeal JE, et al. Preoperative PSA velocity is an independent prognostic factor for relapse after radical prostatectomy. J Clin Oncol. 2005;23:6157–62. doi: 10.1200/JCO.2005.01.2336. [DOI] [PubMed] [Google Scholar]
- 64.Carter HB, Ferrucci L, Kettermann A, et al. Detection of life-threatening prostate cancer with prostate-specific antigen velocity during a window of curability. J Natl Cancer Inst. 2006;98:1521–7. doi: 10.1093/jnci/djj410. [DOI] [PMC free article] [PubMed] [Google Scholar]
- 65.National Comprehensive Cancer Network: National Comprehensive, 2004. 2004 http://www.nccn.org/professionals/physician_gls/PDF/prostate_detection.pdf.
- 66.Fall K, Garmo H, Andren O, et al. Prostate-specific antigen levels as a predictor of lethal prostate cancer. J Natl Cancer Inst. 2007;99:526–32. doi: 10.1093/jnci/djk110. [DOI] [PubMed] [Google Scholar]
- 67.Yu X, Loeb S, Roehl KA, et al. The association between total prostate specific antigen concentration and prostate specific antigen velocity. J Urol. 2007;177:1298–302. doi: 10.1016/j.juro.2006.12.003. discussion 1301-2. [DOI] [PubMed] [Google Scholar]
- 68.Catalona WJ, Partin AW, Slawin KM, et al. Use of the percentage of free prostate-specific antigen to enhance differentiation of prostate cancer from benign prostatic disease: a prospective multicenter clinical trial. Jama. 1998;279:1542–7. doi: 10.1001/jama.279.19.1542. [DOI] [PubMed] [Google Scholar]
- 69.Woodrum DL, Brawer MK, Partin AW, et al. Interpretation of free prostate specific antigen clinical research studies for the detection of prostate cancer. J Urol. 1998;159:5–12. doi: 10.1016/s0022-5347(01)63996-x. [DOI] [PubMed] [Google Scholar]
- 70.Vickers AJ, Cronin AM, Aus G, et al. A panel of kallikrein markers can reduce unnecessary biopsy for prostate cancer: data from the European Randomized Study of Prostate Cancer Screening in Goteborg, Sweden. BMC Med. 2008;6:19. doi: 10.1186/1741-7015-6-19. [DOI] [PMC free article] [PubMed] [Google Scholar]
- 71.Stephan C, Lein M, Jung K, et al. The influence of prostate volume on the ratio of free to total prostate specific antigen in serum of patients with prostate carcinoma and benign prostate hyperplasia. Cancer. 1997;79:104–9. [PubMed] [Google Scholar]
- 72.Roddam AW, Duffy MJ, Hamdy FC, et al. Use of prostate-specific antigen (PSA) isoforms for the detection of prostate cancer in men with a PSA level of 2-10 ng/ml: systematic review and meta-analysis. Eur Urol. 2005;48:386–99. doi: 10.1016/j.eururo.2005.04.015. discussion 398-9. [DOI] [PubMed] [Google Scholar]
- 73.Mikolajczyk SD, Marks LS, Partin AW, et al. Free prostate-specific antigen in serum is becoming more complex. Urology. 2002;59:797–802. doi: 10.1016/s0090-4295(01)01605-3. [DOI] [PubMed] [Google Scholar]
- 74.Sokoll LJ, Chan DW, Mikolajczyk SD, et al. Proenzyme psa for the early detection of prostate cancer in the 2.5-4.0 ng/ml total psa range: preliminary analysis. Urology. 2003;61:274–6. doi: 10.1016/s0090-4295(02)02398-1. [DOI] [PubMed] [Google Scholar]
- 75.Khan MA, Partin AW, Rittenhouse HG, et al. Evaluation of proprostate specific antigen for early detection of prostate cancer in men with a total prostate specific antigen range of 4.0 to 10.0 ng/ml. J Urol. 2003;170:723–6. doi: 10.1097/01.ju.0000086940.10392.93. [DOI] [PubMed] [Google Scholar]
- 76.Catalona WJ, Bartsch G, Rittenhouse HG, et al. Serum pro-prostate specific antigen preferentially detects aggressive prostate cancers in men with 2 to 4 ng/ml prostate specific antigen. J Urol. 2004;171:2239–44. doi: 10.1097/01.ju.0000127737.94221.3e. [DOI] [PubMed] [Google Scholar]
- 77.Shariat S, Mikolajczyk S, Singh H, et al. Preoperative serum levels of pro-PSA isoforms are associated with biologically aggressive prostate cancer. SUO Third Annual Meeting: Extraordinary Opportunities for Discovery. Natcher Conference Center, National Institutes of Health; Bethesda, Maryland. December 13 - 14, 2002; 2002. [Google Scholar]
- 78.Catalona WJ, Bartsch G, Rittenhouse HG, et al. Serum pro prostate specific antigen improves cancer detection compared to free and complexed prostate specific antigen in men with prostate specific antigen 2 to 4 ng/ml. J Urol. 2003;170:2181–5. doi: 10.1097/01.ju.0000095460.12999.43. [DOI] [PubMed] [Google Scholar]
- 79.Nurmikko P, Pettersson K, Piironen T, et al. Discrimination of prostate cancer from benign disease by plasma measurement of intact, free prostate-specific antigen lacking an internal cleavage site at Lys145-Lys146. Clin Chem. 2001;47:1415–23. [PubMed] [Google Scholar]
- 80.Steuber T, Niemela P, Haese A, et al. Association of free-prostate specific antigen subfractions and human glandular kallikrein 2 with volume of benign and malignant prostatic tissue. Prostate. 2005;63:13–8. doi: 10.1002/pros.20156. [DOI] [PubMed] [Google Scholar]
- 81.Mikolajczyk SD, Millar LS, Wang TJ, et al. “BPSA,” a specific molecular form of free prostate-specific antigen, is found predominantly in the transition zone of patients with nodular benign prostatic hyperplasia. Urology. 2000;55:41–5. doi: 10.1016/s0090-4295(99)00372-6. [DOI] [PubMed] [Google Scholar]
- 82.Slawin KM, Shariat S, Canto E. BPSA: A Novel Serum Marker for Benign Prostatic Hyperplasia. Rev Urol. 2005;7(Suppl 8):S52–6. [PMC free article] [PubMed] [Google Scholar]
- 83.Canto EI, Singh H, Shariat SF, et al. Serum BPSA outperforms both total PSA and free PSA as a predictor of prostatic enlargement in men without prostate cancer. Urology. 2004;63:905–10. doi: 10.1016/j.urology.2003.12.037. discussion 910-1. [DOI] [PubMed] [Google Scholar]
- 84.Darson MF, Pacelli A, Roche P, et al. Human glandular kallikrein 2 expression in prostate adenocarcinoma and lymph node metastases. Urology. 1999;53:939–44. doi: 10.1016/s0090-4295(98)00637-2. [DOI] [PubMed] [Google Scholar]
- 85.Becker C, Piironen T, Pettersson K, et al. Discrimination of men with prostate cancer from those with benign disease by measurements of human glandular kallikrein 2 (HK2) in serum. J Urol. 2000;163:311–6. [PubMed] [Google Scholar]
- 86.Partin AW, Catalona WJ, Finlay JA, et al. Use of human glandular kallikrein 2 for the detection of prostate cancer: preliminary analysis. Urology. 1999;54:839–45. doi: 10.1016/s0090-4295(99)00270-8. [DOI] [PubMed] [Google Scholar]
- 87.Nam RK, Diamandis EP, Toi A, et al. Serum human glandular kallikrein-2 protease levels predict the presence of prostate cancer among men with elevated prostate-specific antigen. J Clin Oncol. 2000;18:1036–42. doi: 10.1200/JCO.2000.18.5.1036. [DOI] [PubMed] [Google Scholar]
- 88.Magklara A, Scorilas A, Catalona WJ, et al. The combination of human glandular kallikrein and free prostate-specific antigen (PSA) enhances discrimination between prostate cancer and benign prostatic hyperplasia in patients with moderately increased total PSA. Clin Chem. 1999;45:1960–6. [PubMed] [Google Scholar]
- 89.Haese A, Graefen M, Steuber T, et al. Total and Gleason grade 4/5 cancer volumes are major contributors of human kallikrein 2, whereas free prostate specific antigen is largely contributed by benign gland volume in serum from patients with prostate cancer or benign prostatic biopsies. J Urol. 2003;170:2269–73. doi: 10.1097/01.ju.0000095794.04551.0c. [DOI] [PubMed] [Google Scholar]
- 90.Recker F, Kwiatkowski MK, Piironen T, et al. Human glandular kallikrein as a tool to improve discrimination of poorly differentiated and non-organ-confined prostate cancer compared with prostate-specific antigen. Urology. 2000;55:481–5. doi: 10.1016/s0090-4295(99)00611-1. [DOI] [PubMed] [Google Scholar]
- 91.Haese A, Becker C, Noldus J, et al. Human glandular kallikrein 2: a potential serum marker for predicting the organ confined versus non-organ confined growth of prostate cancer. J Urol. 2000;163:1491–7. doi: 10.1016/s0022-5347(05)67649-5. [DOI] [PubMed] [Google Scholar]
- 92.Haese A, Graefen M, Steuber T, et al. Human glandular kallikrein 2 levels in serum for discrimination of pathologically organ-confined from locally-advanced prostate cancer in total PSA-levels below 10 ng/ml. Prostate. 2001;49:101–9. doi: 10.1002/pros.1123. [DOI] [PubMed] [Google Scholar]
- 93.Steuber T, Vickers AJ, Serio AM, et al. Comparison of free and total forms of serum human kallikrein 2 and prostate-specific antigen for prediction of locally advanced and recurrent prostate cancer. Clin Chem. 2007;53:233–40. doi: 10.1373/clinchem.2006.074963. [DOI] [PubMed] [Google Scholar]
- 94.Vickers AJ, Jang K, Sargent D, et al. Systematic review of statistical methods used in molecular marker studies in cancer. Cancer. 2008;112:1862–8. doi: 10.1002/cncr.23365. [DOI] [PMC free article] [PubMed] [Google Scholar]
- 95.Stephan C, Jung K, Diamandis EP, et al. Prostate-specific antigen, its molecular forms, and other kallikrein markers for detection of prostate cancer. Urology. 2002;59:2–8. doi: 10.1016/s0090-4295(01)01449-2. [DOI] [PubMed] [Google Scholar]