

Abstract
Myeloid translocation gene (MTG) proteins are transcriptional repressors that are highly conserved across species. We studied the expression of three members of this gene family, MTGR1, MTG8, and MTG16 in developing mouse central nervous system by in situ hybridization. All of these genes are detected as early as embryonic day 11.5. Because these genes are known to be induced by proneural genes during neurogenesis, we analyzed the expression of MTG genes in relation to two proneural genes, Neurog2 (also known as Ngn2 or Neurogenin 2) and Ascl1 (also known as Mash1). While MTGR1 are generally expressed in regions that also express Neurog2, MTG8 and MTG16 expression is associated more tightly with that of Ascl1-expressing neural progenitor cells. These results suggest the possibility that expression of MTG genes is differentially controlled by specific proneural genes during neurogenesis.
Keywords: MTG8, MTG16, MTGR1, CBFA2T1, CBFA2T2, CBFA2T3, ETO, ETO-2, ETO-R, EHT, Neurog2, Ngn2, Neurogenin, Ascl1, Mash1, achaete-scute homolog, neurogenesis, differentiation, neuronal progenitor, spinal cord, telencephalon, diencephalon, thalamus, retina, central nervous system, CNS, lineage tracing, basic helix-loop-helix, bHLH, transcription factor, transcriptional repressor, histone deacetylase, HDAC, N-CoR, Sin3A, AML, acute myeloid leukemia, Nvy, nervy
INTRODUCTION
MTGR1 (also known as ETOR/Cbfa2t2/EHT), MTG8 (also ETO/Cbfa2t1), and MTG16 (also ETO-2/Cbfa2t3/MTGR2) are members of the MTG (myeloid translocation gene) protein family. These proteins are transcriptional repressors that are highly conserved across species. A large body of research on the function of MTG proteins has been done focusing on oncogenesis, in which chromosomal translocation of MTG genes was associated with acute myeloid leukemia and breast cancer (for reviews, see Davis et al., 2003; Hug and Lazar, 2004; Rossetti et al., 2004). It was believed that MTG proteins are expressed rather ubiquitously, because Northern blot analysis showed that a large number of organs express MTG transcripts (Miyoshi et al., 1993; Wolford and Prochazka, 1998; Morohoshi et al., 2000; Calabi et al., 2001). However, each transcript seems to be expressed in specific cell types. For example, MTG8 mutant mice showed impaired midgut development, whereas MTGR mutant mice failed to maintain secretory cell lineage in the small intestine (Calabi et al., 2001, Amann et al., 2005). Specific interactions of MTG proteins with Delta/Notch signaling and Wnt signaling pathways have also been suggested (Cao et al., 2002; Wildonger and Mann, 2005; Moore et al., 2008).
During early stages of neurogenesis, MTG genes are strongly induced by a number of proneural basic helix-loop-helix (bHLH) proteins including XNGNR-1, Xath3, Xath5, and XNeuroD, suggesting their role as a widely employed regulator of neuronal differentiation (Cao et al., 2002; Koyano-Nakagawa and Kintner, 2005; Logan et al., 2005; Seo et al., 2007). In the mouse telencephalon, MTG8 was identified as a potential target of Neurog2 (also known as Ngn2 or Neurogenin 2; Gohlke et al., 2008). In addition, a later role of MTGR1 as a repressor of β1 integrin-dependent neurite outgrowth via regulation of EGF and FGF expression was recently reported (Ossovskaya et al., 2009). In this report, we performed a detailed analysis of expression for each of the three members of the MTG family during neurogenesis in mice. Interestingly, we noticed that the domains of MTGR1 expression generally coincided with that of Neurog2, whereas expression of MTG8 and MTG16 was largely confined to the lineage of progenitor cells expressing Ascl1 (also known as Mash1). This correlation was further confirmed by analyzing gene expression in transgenic mice that express EGFP under the control of Ascl1 gene. These findings suggest that during neural development, each of the MTG genes may play specific roles in modulating the activity of bHLH transcription factors.
RESULTS AND DISCUSSION
Expression in the Telencephalon
MTGR1
MTGR1 started to be clearly detectable in the dorsal telencephalon at embryonic day 10.5 (E10.5). Expression was highly enriched in the preplate (PP, Fig. 1A), where newly formed neurons reside. At this stage, Neurog2 was expressed in the ventricular zone (VZ) in a salt-and-pepper pattern (Fig. 1B; Gradwohl et al., 1996). MTGR1 and Neurog2 appeared to share the same ventral border (Fig. 1A,B, arrow), and were not detected in the ventral telencephalon. At E11.5, both MTGR1 and Neurog2 continued to be expressed in the dorsal telencephalon. MTGR1 was now more broadly expressed across the cortical wall (Fig. 2A–C, Cx), similar to Neurog2 (Fig. 2E–G, Cx). In addition, very weak MTGR1 expression was detected in the ventral telencephalon, including the lateral (LGE) and caudal (CGE) ganglionic eminences (Fig. 2A,B). At E13.5, MTGR1 was expressed in the dorsal telencephalon with a clear laminar preference (Fig. 3A–D). A high expression was found in the PP (Fig. 3A–D) and the subventricular zone (SVZ, Fig. 3A–D). Scattered cells in the VZ also expressed MTGR1 (Fig. 3A–D). At this stage, Neurog2 was most densely expressed in the VZ (Fig. 3E–H), with less dense expression in the SVZ (Fig. 3E–H; Gradwohl et al., 1996). High-magnification images on adjacent sections show that there is some overlap of expression between MTGR1 and Neurog2 in the SVZ (Fig. 3D,H). At E15.5, MTGR1 was down-regulated in the neocortex; only the medial (Fig. 4B, mCx) and lateral (Fig. 4A,B, lCx) parts of the dorsal telencephalon continued to express MTGR1. The same pattern of expression continued to postnatal day 0 (P0, not shown).
Fig. 1.
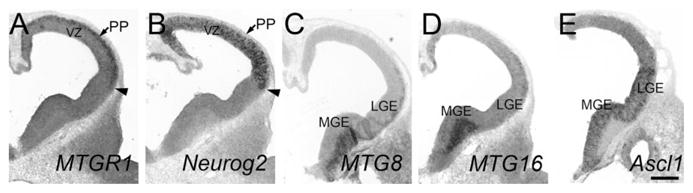
Telencephalon at E10.5. Adjacent frontal sections are shown. Midline is to the left. In situ hybridization for MTGR1 (A), Neurog2 (B), MTG8 (C), MTG16 (D), and Ascl1 (E) is shown. PP, preplate; VZ, ventricular zone. Scale bar = 200 μm.
Fig. 2.

Forebrain at E11.5. Frontal sections are shown. Sections in the same column are adjacent to each other. Left columns are more frontal than right columns. Midline is to the left. In situ hybridization for MTGR1 (A–D), Neurog2 (E–H), MTG8 (I–L), MTG16 (M–P), and Ascl1 (Q–T) is shown. Cx, cortex; MGE, medial ganglionic eminence; LGE, lateral ganglionic eminence; CGE, caudal ganglionic eminence; EMT, eminentia thalami; HT, hypothalamus; rPT, rostral pretectum; cPT, caudal pretectum; Th, thalamus; pTH-R, rostral thalamic progenitor domain; ZLI, zona limitans intrathalamica. Scale bar = 500 μm.
Fig. 3.

Forebrain at E13.5. Frontal sections are shown. A and E, B and F, C and G are adjacent sections. D and H are high-magnification views of C and G, respectively. Midline is to the left. In situ hybridization for MTGR1 (A–D), Neurog2 (E–H), MTG8 (I,J), MTG16 (K), and Ascl1 (L) is shown. PP, preplate; SVZ, subventricular zone; VZ, ventricular zone; MGE, medial ganglionic eminence; LGE, lateral ganglionic eminence; Th, thalamus; EMT, eminentia thalami; HT, hypothalamus. Scale bar = 200 μm for D,H and 500 μm for other panels.
Fig. 4.

Forebrain at E14.5 and E15.5. Frontal sections are shown. A–H, J,K are from E15.5, and I is from an E14.5 embryo. Midline is to the left. In situ hybridization for MTGR1 (A,B), MTG8 (C,D), MTG16 (E–G, I,J), Neurog2 (H,K). lCx, lateral cortex; mCx, medial cortex; RT, reticular nucleus; Th, thalamus; STh, subthalamic nucleus; PV, paraventricular nucleus of the thalamus; IGL/vLG, inter-geniculate leaflet/ventral lateral geniculate nucleus; VZ, ventricular zone; SVZ, subventricular zone. Scale bar = 500 μm for A–H, 200 μm for I–K.
MTG8
MTG8 started to be expressed at E10.5 in the mantle zone of the ventral telencephalon (Fig. 1C, LGE and medial ganglionic eminence, MGE), while it was not detected in the cortex. At E11.5, MTG8 was strongly expressed in the mantle zone of MGE, LGE, and CGE (Fig. 2I,J), but it was undetectable in the dorsal telencephalon (Fig. 2I–K, Cx). This ventral-specific expression was similar to that of Ascl1, although Ascl1 was only detected in the VZ, and not in the mantle zone (Fig. 2Q,R). At E13.5, MTG8 was still expressed in the ventral telencephalic mantle zone, which is derived from the MGE and LGE (Fig. 3I,J, double arrows). In addition, starting at this stage, MTG8 was also clearly detected in the cortical PP (Fig. 3I,J). These cells are either derived from the dorsal telencephalon or have migrated from the MGE and CGE (Metin et al., 2006; Butt et al., 2005). At E15.5, MTG8 expression in the cortex was decreased in general, with the exception of the medial (Fig. 4C,D, mCx) and lateral (Fig. 4C, lCx) parts, similar to MTGR1. The same pattern was found at P0 (not shown).
MTG16
Similar to MTG8, MTG16 was also expressed in the mantle zone of the ganglionic eminences starting at E10.5 (Fig. 1D). Unlike MTG8, the level of expression was much higher in the MGE than in the LGE or CGE. The pattern at E11.5 was essentially the same as E10.5 (Fig. 2M,N). Similar to MTG8, MTG16 was detected in the cortical PP at E13.5 (Fig. 3K). At E14.5, after the splitting of the PP by the cortical plate, we saw both the marginal zone (Fig. 4I) and presumptive subplate (Fig. 4I, arrowheads) with significant levels of MTG16 expression. At E15.5, MTG16 was still expressed in the marginal zone (Fig. 4J) and the subplate (Fig. 4J, arrowheads), but expression was higher in the lateral part of the telencephalon (Fig. 4E,F, lCx). At P0, MTG16 was largely down-regulated in the cortex (data not shown). In contrast, at E15.5, Neurog2 expression was largely restricted to the VZ (Fig. 4H,K) and SVZ (Fig. 4H,K), while the cortical plate had much lower expression (Fig. 4H).
Expression in the Diencephalon
MTGR1
Strong expression of MTGR1 in the caudal diencephalon, including the thalamus (Fig. 2B,C, Th) and the rostral pretectum (Fig. 2D, rPT), started at E11.5. Weak expression continued rostrally into the prethalamus (Fig. 2C, PTh). At E13.5, when a prominent mantle zone was formed in the entire diencephalon, MTGR1 was detected along the outer edge of the VZ in the pretectum (not shown), the thalamus (Fig. 3C, Th, shown by arrowheads), and the prethalamus (Fig. 3C, PTh). By E15.5, MTGR1 expression was down-regulated in these regions (Fig. 4B). In addition to the above regions, at both E11.5 and E13.5, MTGR1 was expressed in the eminentia thalami, which is located dorsal to the prethalamus (Figs. 2B and 3C, EMT) (Puelles and Rubenstein, 2003), as well as in the VZ, which is close to the future dorsomedial nucleus of the hypothalamus (Figs. 2B and 3C, HT). Within most of the MTGR1-expressing regions in the diencephalon, Neurog2 was expressed in the VZ (thalamus, Figs. 2F,G and 3G, Th; eminentia thalami, Figs. 2F and 3G, EMT; rostral pretectum, Fig. 2H, rPT), except in the prethalamus (Fig. 2G, PTh). In addition to the VZ, the mantle zone of the thalamus (Figs. 2F, 3G, double arrows) and a part of the hypothalamus (Figs. 2F, 3G, triple arrows) also showed Neurog2 expression at E11.5 and E13.5 (Gradwohl et al., 1996; Nakagawa and O’Leary, 2001). Thus, within the diencephalon, MTGR1 and Neurog2 showed a significant overlap in expression areas. In addition, where these two genes overlap, Neurog2 expression always preceded the induction of MTGR1.
MTG8
MTG8 expression in the mantle zone of the thalamus was first detected at E11.5 (Fig. 2K,L, Th). At this stage, MTG8 was also expressed in the dorso-caudal part of the hypothalamus (paraventricular region; Fig. 2K, HT) where Ascl1 expression was strong and Neurog2 was absent (Fig. 2G,K,S). Unlike MTGR1 and MTG16, expression of MTG8 in the pretectum was not clearly detected (Fig. 2L, rPT). At E13.5, there was a gradient of MTG8 expression in the thalamic mantle zone, which was higher in the caudo-dorsal region (Fig. 3J, double arrowheads) than in the rostro-ventral region (Fig. 3J, single arrowhead) (see Vue et al., 2007, for axial nomenclature of the thalamus). This graded pattern of MTG8 expression in the thalamic mantle zone was already observed at E12.5 on sagittal sections (see Fig. 7F, Th), and continued to E15.5 (Fig. 4D, caudo-dorsal part is shown by double arrowheads, whereas rostro-ventral part is indicated by a single arrowhead). In addition to the thalamus and paraventricular hypothalamus, MTG8 was also expressed in the reticular nucleus of the prethalamus (Fig. 4C, RT) and subthalamic nucleus of the hypothalamus (Fig. 4D, STh). At P0, this region-specific expression pattern of MTG8 was still largely preserved (not shown).
Fig. 7.
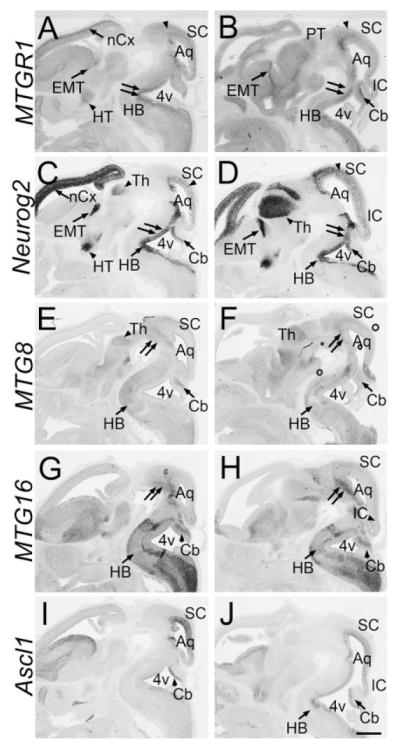
Sagittal sections at E12.5. Sagittal sections of the brain at E12.5. Front is to the left. In situ hybridization for MTGR1 (A,B), Neurog2 (C,D), MTG8 (E,F), MTG16 (G,H), and Ascl1 (I,J) is shown. nCx, neocortex; Th, thalamus; EMT, eminentia thalami; HT, hypothalamus; PT, pretectum; HB, hindbrain; Aq, cerebral aquaduct; 4v, fourth ventricle; SC, superior colliculus; IC, inferior colliculus; Cb, cerebellum. Scale bar = 500 μm.
MTG16
At E11.5, MTG16 was expressed weakly and broadly in the thalamic mantle zone. However, in the most rostro-ventral part of the thalamus, MTG16 was detected in a narrow band (Fig. 2O), which is immediately lateral to the band of Ascl1-expressing domain in the thalamus (Fig. 2S, pTH-R). We previously showed that this Ascl1-expressing progenitor domain, termed pTH-R, gives rise to thalamic nuclei such as intergeniculate leaflet and the ventral lateral geniculate nucleus (Vue et al., 2007). In addition to the thalamus, MTG16 was strongly expressed in the caudal pretectum (Fig. 2P, cPT), which also expressed Ascl1 (Fig. 2T). At E15.5 and later, MTG16 was expressed in the ventral lateral geniculate nucleus and intergeniculate leaflet (Fig. 4G, IGL/vLG), which are derived from the Ascl1-expressing progenitor domain, pTH-R (Vue et al., 2007). We also found that MTG16 was expressed in the paraventricular nucleus of the thalamus (Fig. 4G, PV).
Expression in the Retina
MTGR1
In the retina, Neurog2 started to show a distinctive salt-and-pepper expression pattern in progenitor cells at E11.5 (Fig. 5A). Coinciding with this expression, MTGR1 started to be detectable also at E11.5 (Fig. 5C). Both genes are expressed highly in the central part of the retina (shown by arrows). At E13.5, we detected robust expression of MTGR1 as well as Neurog2 in the VZ (Fig. 6A,C). In addition, MTGR1 was expressed in the ganglion cell layer as well (Fig. 6A, GCL). At E15.5, MTGR1 was still expressed in the retina, but was further enriched in the ganglion cell layer (Fig. 6B, GCL), where Neurog2 was not detected (Fig. 6D, Gradwohl et al., 1996). The expression level appeared to be decreased at P0 (not shown). Thus, the temporal and spatial expression patterns of MTGR1 and Neurog2 in the retina are consistent with the possibility that Neurog2 regulates the expression of MTGR1.
Fig. 5.
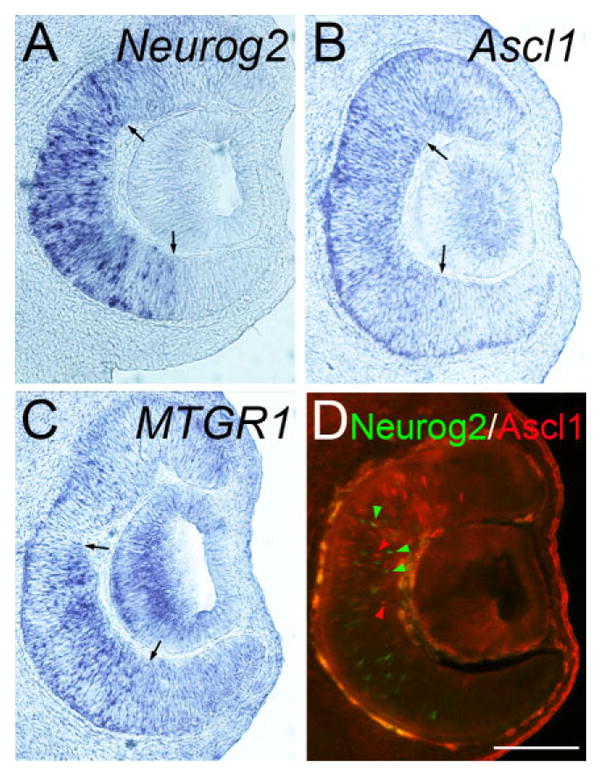
Retina at E11.5. Frontal sections of the retina at E11.5. Midline is to the left. In situ hybridization for Neurog2 (A), Ascl1 (B), MTGR1 (C) as well as double immunohistochemistry of Ascl1 and Neurog2 (D) is shown. Red and green arrowheads in D indicate Neurog2-positive and Ascl1-positive cells, respectively. These two populations do not significantly overlap at this stage. Scale bar = 200 μm.
Fig. 6.
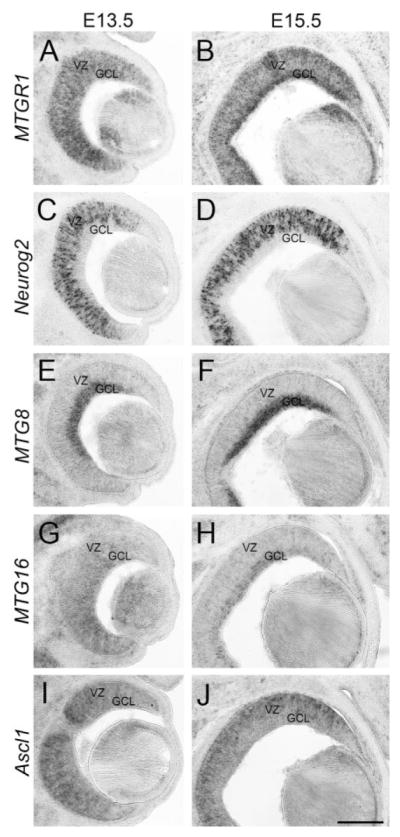
Retina at E13.5 and E15.5. Frontal sections of the forebrain at E13.5 (A,C,E,G,I) and E15.5 (B,D,F,H,J). Midline is to the left. In situ hybridization for MTGR1 (A,B), Neurog2 (C,D), MTG8 (E,F), MTG16 (G,H), and Ascl1 (I,J) is shown. VZ, ventricular zone; GCL, ganglion cell layer. Scale bar = 200 μm.
MTG8 and MTG16
MTG8 expression was first detected in the ganglion cell layer at E13.5 (Fig. 6E, GCL), but not in the VZ. This pattern continued at E15.5 (Fig. 6F). MTG16 expression in the retina was first detected at E13.5 (Fig. 6G). The level of expression appeared to be higher in the ganglion cell layer than in the VZ, but the difference was not as clear as it was for MTG8 expression. At E15.5, MTG16 expression was clearly enriched in the ganglion cell layer (Fig. 6H, GCL). Both MTG8 and MTG16 continued to be expressed in the ganglion cell layer at P0 (data not shown). Scattered expression of Ascl1 was first detected at E11.5 by immunohistochemistry (Fig. 5D) and in situ hybridization (Fig. 5B). With double labeling, it was found that Ascl1 was expressed in a largely non-overlapping population with Neurog2 (Fig. 5D), which was consistent with a previous report (Marquardt et al., 2001). Ascl1 expression was maintained at E13.5 and E15.5, but was more highly expressed in the VZ than in the ganglion cell layer (Fig. 6I,J). At P0, Ascl1 was still expressed in a pattern similar to E15.5 (not shown).
Expression in the Midbrain and Hindbrain
On sagittal sections at E12.5, MTGR1 was expressed broadly in the middle layer of the midbrain (Fig. 7A,B, arrowhead) and the dorsal hindbrain near the 4th ventricle (Fig. 7A,B, double arrows). Neurog2 was also expressed in the VZ of similar regions (Fig. 7C,D, arrowhead and double arrows). MTG8 and MTG16 were both expressed broadly in the midbrain and hindbrain, including much of the ventral midbrain (Fig. 7E–H, double arrows) as well as part of the hind-brain (Fig. 7E–H, HB). MTGR1, MTG8, and MTG16 were also strongly expressed in the cerebellar primordium, outside the VZ (Fig. 7B,E–H, Cb), whereas Ascl1 and Neurog2 were both expressed within the VZ. In summary, in the midbrain and hindbrain including the cerebellum, MTG genes were broadly expressed with significant overlaps. Similarly, Ascl1 and Neurog2 were expressed in the VZ with overlapping patterns (Fig. 7C,D,I,J).
Expression in the Spinal Cord
MTGR1
At E10.5, we detected MTGR1 in the most dorsal progenitor population, presumably the dp1 domain (Fig. 8A, arrowhead; Helms and Johnson, 2003; Zhuang and Sockanathan, 2006). Neurog2, which is known to be expressed in the dp2 domain, was detected immediately ventral to the MTGR1-expressing domain on adjacent sections (Fig. 8C, arrow and arrowhead). MTGR1 was also expressed more ventrally; the dorso-ventral level of this expression domain coincided with that of Neurog2 (Fig. 8A,C, double arrows). In this ventral domain, Neurog2 expression extended more medially than MTGR1. At E12.5, MTGR1 expression became broader, covering most of the dorso-ventral extent, but with weaker expression ventrally. This dorso-ventral distribution of MTGR1-positive cells was very similar to that of Neurog2 (Figs. 8B,D, 9A,B, arrowheads).
Fig. 8.
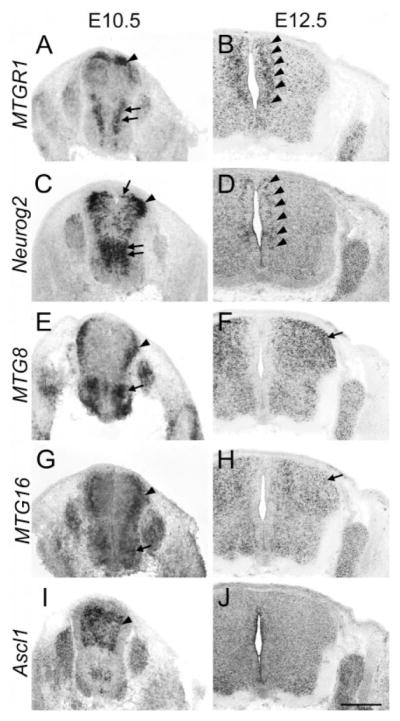
Spinal cord at E10.5 and E12.5. Transverse sections of the spinal cord at the thoracic level at E10.5 (A,C,E,G,I) and E12.5 (B,D,F,H,J). In situ hybridization for MTGR1 (A,B), Neurog2 (C,D), MTG8 (E,F), MTG16 (G,H), and Ascl1 (I,J) is shown. Scale bar = 500 μm.
Fig. 9.

Analysis of Ascl1-BAC-EGFP embryos at E11.5. Transverse sections of the lumber spinal cord (A–F) of the same Ascl1-BAC-EGFP embryo at E11.5. Sections in A–F are adjacent to each other and B and C are from the same section. In situ hybridization for MTGR1 (A), MTG8 (D), MTG16 (E), as well as immunostaining for Neurog2 (B), Ascl1/Neurog2 (C), and EGFP (F) is shown. Scale bar = 200 μm.
MTG8 and MTG16
MTG8 expression was found broadly in the mantle zone of the dorsal spinal cord already at E10.5 (Fig. 8E, arrowhead). Motor neurons also had strong expression (Fig. 8E, arrow). At E12.5, expression became more diffuse and occupied most of the dorsal horn of the spinal cord (Fig. 8F, arrow). Expression in motor neurons became weaker at this stage. MTG16 was expressed in a pattern similar to MTG8 in the spinal cord both at E10.5 and E12.5 (Fig. 8G,H, arrow and arrowhead). At E10.5, Ascl1 was expressed in a broad dorsal domain that encompasses dp3 to dp5 (Fig. 8I, arrowhead) (Helms and Johnson, 2003; Zhuang and Sockanathan, 2006). At E12.5, expression became weak. In order to further evaluate the possible correlation of the expression of MTG genes and proneural genes, we did in situ hybridization and immunohistochemistry on Ascl1-BAC-EGFP mice at E11.5. We find that in the ventral spinal cord, MTG8 expression correlated well with the Ascl1 lineage in the V2 interneuron domain (Fig. 9D,F, arrow). In the ventral spinal cord, the expression of Neurog2 and Ascl1 was mutually exclusive at E11.5 (Fig. 9C, arrow and double arrows). In the dorsal spinal cord, the expression and lineage of Neurog2 and Ascl1 overlapped more extensively than in the ventral cord (Fig. 9B,C, arrowhead). However, the broad expression pattern and medio-lateral boundary of MTGR1 expression correlated better with that of Neurog2 than with Ascl1 (compare Fig. 9A,B,F).
Summary of MTG Gene Expression
Our analysis of the expression of the MTG genes in the developing mouse CNS reveals that the three members of the MTG gene family are expressed in overlapping but distinctive populations of cells. Interestingly, MTG genes can be induced by over-expression of proneural bHLH genes in the neural tube (Cao et al., 2002; Koyano-Nakagawa and Kintner, 2005; Logan et al., 2005; Seo et al., 2007; Gohlke et al., 2008), and bHLH genes such as Neurog2 and Ascl1 show limited overlap in expression within the developing central nervous system (Gradwohl et al., 1996). Thus, it is possible that each bHLH proneural gene preferentially activates the expression of the three MTG genes. We compared the expression of MTG genes with that of Neurog2 and Ascl1, and found that the spatial and temporal expression patterns of all three members of the MTG gene family were compatible with their status as downstream targets of Neurog2 and/or Ascl1. MTGR1 expression was generally associated with that of Neurog2 in the dorsal telencephalon as well as in the thalamus and rostral pretectum. The retina and ventral spinal cord also showed some overlap. In each of these shared expression domains, MTGR1 expression appeared to immediately follow the onset of Neurog2, but was generally expressed only transiently. Few domains in the mantle zone continued to express MTGR1 beyond late embryonic stages. In contrast, MTG8 and MTG16 generally overlapped heavily with Ascl1 expression domains. MTG16 was particularly tightly linked to Ascl1 expression in the ventral telencephalon and diencephalon. MTG16 expression was still detectable at E15.5 and P0 in many regions (e.g., telencephalon, retina, ventral lateral geniculate nucleus). MTG8 was continuously expressed in most of the postmitotic cell populations that express it. These results suggest that Neurog2 and Ascl1 may indeed have preferential regulation on different MTG genes. Further investigations are needed to reveal the significance of this specificity. We recently observed that all members of the MTG protein family inhibit transcriptional activity of proneural bHLH proteins (Aaker et al., unpublished observation). Temporal and spatial specificity of MTG expression found in chick and Xenopus (Koyano-Nakagawa and Kintner, 2005) and in mice (this study) suggests that each MTG protein might have specific bHLH targets to inhibit.
EXPERIMENTAL PROCEDURES
Animals
Care and experimentation on mice were done in accordance with the Institutional Animal Care and Use Committee of the University of Minnesota. Noon of the day on which the vaginal plug was found was counted as embryonic day 0.5 (E0.5). Stages of early embryos were confirmed by morphology (Kaufman, 1992). CD1/ICR mice (Charles River) and Ascl1-BAC-EGFP mice (MMRRC stock number 000295-UNC, Gong et al., 2003) were used.
In Situ Hybridization and Immunohistochemistry
In situ hybridization and immunohistochemistry were performed as described (Vue et al., 2007). Antibodies used are: rabbit anti-GFP (Molecular Probes), goat anti-Neurog2 (Santa Cruz Biotechnology, sc-19233), and mouse anti-Ascl1 (BD Pharmingen, 556604). For each embryonic stage, different layers of the cortex were assessed by (1) DAPI staining; VZ, SVZ, and CP have high cell density compared with SP (subplate)/IZ (intermediate zone) and MZ/PP, and (2) immunostaining of βIII-tubulin, calretinin, and phospho-histone H3 (PH3); βIII-tubulin is in high density in CP, calretinin is strongly expressed in MZ/PP, and PH3 is expressed at the ventricular surface as well as in the SVZ (data not shown).
Probes
A template for MTG8 probe was obtained by PCR-amplifying the 3′UTR based on published sequence (bases 1,318 –2,363 of NCBI D32007) from E12.5 mouse spinal cord cDNA. The fragment was subcloned into pBSII and confirmed by sequencing. Clones of mMTG16b/CBFA2T3 (CA749581) and mMTGR1/CBFA2T2h (6405896) were purchased from the I.M.A.G.E. Consortium.
Acknowledgments
This work was funded in part by the National Institute of Health (MH078998 to N.K-N and NS049357 to Y.N.). DNA sequence analyses were done using resources of the Supercomputing Institute at the University of Minnesota. We thank members of the Nakagawa and Koyano Labs for discussion and help.
Grant sponsor: National Institute of Health; Grant numbers: MH078998 and NS049357.
References
- Amann JM, Chyla BJI, Ellis TC, Martinez A, Moore AC, Franklin JL, McGhee L, Meyers S, Ohm JE, Luce KS, Ouelette AJ, Washington MK, Thompson MA, King D, Gautam S, Coffey RJ, White-head RH, Hiebert SW. Mtgr1 is a transcriptional corepressor that is required for maintenance of the secretory cell lineage in the small intestine. Mol Cell Biol. 2005;25:9576 –9585. doi: 10.1128/MCB.25.21.9576-9585.2005. [DOI] [PMC free article] [PubMed] [Google Scholar]
- Butt SJ, Fuccillo M, Nery S, Noctor S, Kriegstein A, Corbin JG, Fishell G. The temporal and spatial origins of cortical interneurons predict their physiological subtype. Neuron. 2005;48:591– 604. doi: 10.1016/j.neuron.2005.09.034. [DOI] [PubMed] [Google Scholar]
- Calabi F, Pannell R, Pavloska G. Gene targeting reveals a crucial role for MTG8 in the gut. Mol Cell Bio. 2001;21:5658 –5666. doi: 10.1128/MCB.21.16.5658-5666.2001. [DOI] [PMC free article] [PubMed] [Google Scholar]
- Cao Y, Zhao H, Grunz H. XETOR regulates the size of the proneural domain during primary neurogenesis in Xenopus laevis. Mech Dev. 2002;119:35– 44. doi: 10.1016/s0925-4773(02)00285-x. [DOI] [PubMed] [Google Scholar]
- Davis JN, McGhee L, Meyers S. The ETO (MTG8) gene family. Gene. 2003;303:1–10. doi: 10.1016/s0378-1119(02)01172-1. [DOI] [PubMed] [Google Scholar]
- Gohlke JM, Armant O, Parham FM, Smith MV, Zimmer C, Castro DS, Nguyen L, Parker JS, Gradwohl G, Portier CJ, Guillemot F. Characterization of the proneural gene regulatory network during mouse telencephalon development. BMC Biol. 2008;6:15. doi: 10.1186/1741-7007-6-15. [DOI] [PMC free article] [PubMed] [Google Scholar]
- Gong S, Zheng C, Doughty ML, Losos K, Didkovsky N, Schambra UB, Nowak NJ, Joyner A, Leblanc G, Hatten ME, Heintz N. A gene expression atlas of the central nervous system based on bacterial artificial chromosomes. Nature. 2003;425:917–925. doi: 10.1038/nature02033. [DOI] [PubMed] [Google Scholar]
- Gradwohl G, Fode C, Guillemot F. Restricted expression of a novel murine atonal-related bHLH protein in undifferentiated neural precursors. Dev Biol. 1996;180:227–241. doi: 10.1006/dbio.1996.0297. [DOI] [PubMed] [Google Scholar]
- Helms AW, Johnson JE. Specification of dorsal spinal cord interneurons. Curr Opin Neurobiol. 2003;13:42– 49. doi: 10.1016/s0959-4388(03)00010-2. [DOI] [PubMed] [Google Scholar]
- Hug BA, Lazar MA. ETO interacting proteins. Oncogene. 2004;23:4270 – 4274. doi: 10.1038/sj.onc.1207674. [DOI] [PubMed] [Google Scholar]
- Kaufman MH. Atlas of Mouse Development. Academic Press; 1992. p. 512. [Google Scholar]
- Koyano-Nakagawa N, Kintner C. The expression and function of MTG/ETO family proteins during neurogenesis. Dev Biol. 2005;278:22–34. doi: 10.1016/j.ydbio.2004.10.010. [DOI] [PubMed] [Google Scholar]
- Logan MA, Steele MR, Van Raay TJ, Vetter ML. Identification of shared transcriptional targets for the proneural bHLH factors Xath5 and XNeuroD. Dev Biol. 2005;285:570 –583. doi: 10.1016/j.ydbio.2005.06.033. [DOI] [PubMed] [Google Scholar]
- Marquardt T, Ashery-Padan R, Andrejewski N, Scardigli R, Guillemot F, Gruss P. Pax6 is required for the multipotent state of retinal progenitor cells. Cell. 2001;105:43–55. doi: 10.1016/s0092-8674(01)00295-1. [DOI] [PubMed] [Google Scholar]
- Metin C, Baudoin JP, Rakic S, Parnavelas JG. Cell and molecular mechanisms involved in the migration of cortical inter-neurons. Eur J Neurosci. 2006;23:894–900. doi: 10.1111/j.1460-9568.2006.04630.x. [DOI] [PubMed] [Google Scholar]
- Miyoshi H, Kozu T, Shimizu K, Enomoto K, Maseki N, Kaneko Y, Kamada N, Ohki M. The t(8;21) translocation in acute myeloid leukemia results in production of an AML1-MTG8 fusion transcript. Embo J. 1993;12:2715–2721. doi: 10.1002/j.1460-2075.1993.tb05933.x. [DOI] [PMC free article] [PubMed] [Google Scholar]
- Moore AC, Amann JM, Williams CS, Tahinci E, Farmer TE, Martinez JA, Yang GY, Luce KS, Lee E, Hiebert SW. Myeloid translocation gene family members associate with T-cell factors (TCFs) and influence TCF-dependent transcription. Mol Cell Biol. 2008;28:977–987. doi: 10.1128/MCB.01242-07. [DOI] [PMC free article] [PubMed] [Google Scholar]
- Morohoshi F, Mitani S, Mitsuhashi N, Kitabayashi I, Takahashi E, Suzuki M, Munakata N, Ohki M. Structure and expression pattern of a human MTG8/ETO family gene, MTGR1. Gene. 2000;241:287–295. doi: 10.1016/s0378-1119(99)00481-3. [DOI] [PubMed] [Google Scholar]
- Nakagawa Y, O’Leary DD. Combinatorial expression patterns of LIM-home-odomain and other regulatory genes parcellate developing thalamus. J Neurosci. 2001;21:2711–2725. doi: 10.1523/JNEUROSCI.21-08-02711.2001. [DOI] [PMC free article] [PubMed] [Google Scholar]
- Ossovskaya VS, Dolganov G, Basbaum AI. Loss of function genetic screens reveal MTGR1 as an intracellular repressor of beta1 integrin-dependent neurite outgrowth. J Neurosci Methods. 2009;177:322–333. doi: 10.1016/j.jneumeth.2008.10.031. [DOI] [PubMed] [Google Scholar]
- Puelles L, Rubenstein JL. Forebrain gene expression domains and the evolving prosomeric model. Trends Neurosci. 2003;26:469 – 476. doi: 10.1016/S0166-2236(03)00234-0. [DOI] [PubMed] [Google Scholar]
- Rossetti S, Hoogeveen AT, Sacchi N. The MTG proteins: chromatin repression players with a passion for networking. Genomics. 2004;84:1–9. doi: 10.1016/j.ygeno.2004.02.011. [DOI] [PubMed] [Google Scholar]
- Seo S, Lim JW, Yellajoshyula D, Chang LW, Kroll KL. Neurogenin and NeuroD direct transcriptional targets and their regulatory enhancers. EMBO J. 2007;26:5093–5108. doi: 10.1038/sj.emboj.7601923. [DOI] [PMC free article] [PubMed] [Google Scholar]
- Vue TY, Aaker J, Taniguchi A, Kazemzadeh C, Skidmore JM, Martin DM, Martin JF, Treier M, Nakagawa Y. Characterization of progenitor domains in the developing mouse thalamus. J Comp Neurol. 2007;505:73–91. doi: 10.1002/cne.21467. [DOI] [PubMed] [Google Scholar]
- Wildonger J, Mann RS. Evidence that nervy, the Drosophila homolog of ETO/MTG8 promotes mechanosensory organ development by enhancing Notch signaling. Dev Biol. 2005;286:507–520. doi: 10.1016/j.ydbio.2005.08.026. [DOI] [PubMed] [Google Scholar]
- Wolford JK, Prochazka M. Structure and expression of the human MTG8/ETO gene. Gene. 1998;212:103–109. doi: 10.1016/s0378-1119(98)00141-3. [DOI] [PubMed] [Google Scholar]
- Zhuang B, Sockanathan S. Dorsal-ventral patterning: a view from the top. Curr Opin Neurobiol. 2006;16:20 –24. doi: 10.1016/j.conb.2005.11.001. [DOI] [PubMed] [Google Scholar]