

Abstract
We examined the influence of habitual levels of physical activity on bone mass in childhood by studying the relationship between accelerometer recordings and DXA parameters in 4457 11-year-old children. Physical activity was positively related to both BMD and bone size in fully adjusted models. However, further exploration revealed that this effect on bone size was modified by fat mass.
Introduction
Exercise interventions have been reported to increase bone mass in children, but it is unclear whether levels of habitual physical activity also influence skeletal development.
Materials and Methods
We used multivariable linear regression to analyze associations between amount of moderate and vigorous physical activity (MVPA), derived from accelerometer recordings for a minimum of 3 days, and parameters obtained from total body DXA scans in 4457 11-year-old boys and girls from the Avon Longitudinal Study of Parents and Children. The influence of different activity intensities was also studied by stratification based on lower and higher accelerometer cut-points for moderate (3600 counts/minute) and vigorous (6200 counts/minute) activity, respectively.
Results
MVPA was positively associated with lower limb BMD and BMC adjusted for bone area (aBMC; p < 0.001, adjusted for age, sex, socio-economic factors, and height, with or without additional adjustment for lean and fat mass). MVPA was inversely related to lower limb bone area after adjusting for height and lean mass (p = 0.01), whereas a positive association was observed when fat mass was also adjusted for (p < 0.001). Lower limb BMC was positively related to MVPA after adjusting for height and lean and fat mass (p < 0.001), whereas little relationship was observed after adjusting for height and lean mass alone (p = 0.1). On multivariable regression analysis using the fully adjusted model, moderate activity exerted a stronger influence on lower limb BMC compared with light activity (light activity: 2.9 [1.2–4.7, p = 0.001]; moderate activity: 13.1 [10.6–15.5, p < 0.001]; regression coefficients with 95% confidence intervals and p values).
Conclusions
Habitual levels of physical activity in 11-year-old children are related to bone size and BMD, with moderate activity exerting the strongest influence. The effect on bone size (as reflected by DXA-based measures of bone area) was modified by adjustment for fat mass, such that decreased fat mass, which is associated with higher levels of physical activity, acts to reduce bone size and thereby counteract the tendency for physical activity to increase bone mass.
Keywords: DXA, accelerometer, bone size, fat mass
INTRODUCTION
MECHANICAL STRAIN IS an important determinant of skeletal growth and modeling. Therefore, there has been considerable interest in the effect of physical activity on bone development in childhood, and in particular, whether increased levels of activity result in higher levels of peak bone mass that lead to a reduction in the risk of osteoporotic fracture in later life. Several trials have examined effects of exercise interventions on skeletal development in children, with improvements in bone mass generally observed.(1-8) However, the relevance of these interventional studies to general populations with lower levels of habitual activity is unclear.
To examine the role of habitual levels of physical activity in skeletal development, several epidemiological studies have examined relationships between physical activity and bone mass in children and young adults. These studies used questionnaires asking about habitual physical activity patterns and participation in load-bearing and sporting activities. For example, in one prospective cohort study, physical activity and fitness in adolescence was positively related to lumbar and hip BMD at age 28 in 182 men and women.(9) In a retrospective cohort study, femoral neck and whole body BMD of young adult women was inversely related to the amount of sedentary activity before puberty.(10) In a recent cross-sectional study, Ginty et al.(11) reported a positive association between duration of physical activity and BMC of the whole body and hip in 143 men 16–18 years of age. In other cross-sectional studies, time spent participating in sporting activity has been reported to be associated with bone mass in young adult men(12) and women,(13) whereas Neville et al.(14) found a positive relationship between sporting activity and bone mass in men but not women.
A major limitation of these previous epidemiological studies is that traditional epidemiological methods for assessing physical activity, such as self-report questionnaires, perform poorly in children.(15) Physical activity in children is mostly sporadic, comprising numerous short spontaneous bursts of activity that children cannot recall. One objective method for assessing physical activity in children that is being used increasingly is accelerometry. However, to our knowledge, this has only been related to BMD in childhood in one study of 368 preschool children, when a positive association was observed between lumbar and hip bone mass and physical activity.(16)
Recently, we defined population-specific cut-offs that can be readily applied to accelerometer recordings, based on exercise intensity as defined by oxygen consumption (C Mattocks, unpublished data, 2006). Because axial accelerometers detect motion in the vertical plane, which is likely to reflect weight-bearing activity, this technique may be particularly useful in evaluating the relationship between physical activity and skeletal development in childhood. In this study, we aimed to clarify the relationship between habitual level of physical activity and skeletal development in childhood by analyzing associations between accelerometer measures and DXA measurements in 11-year-old children from the Avon Longitudinal Study of Parents and Children (ALSPAC).
MATERIALS AND METHODS
ALSPAC study design
This report is based on ALSPAC, which is a geographically based birth cohort study investigating factors influencing the health, growth, and development of children. All pregnant women resident within a defined part of the former county of Avon in South West England with an expected date of delivery between April 1991 and December 1992 were eligible for recruitment, of whom ~14,000 were enrolled, representing 80–90% of the target population(17) (http://www.alspac.bristol.ac.uk). Ethical approval was obtained from the ALSPAC Law and Ethics committee and relevant local ethics committees. Data in ALSPAC is collected by self-completion postal questionnaires sent to parents, by linkage to computerized records, by abstraction from medical records, and from examination of the children at research clinics. This study is based on the Focus 11 + research clinic to which all ALSPAC children were invited, which was held between January 2003 and January 2005.
DXA variables
Of the 7159 children who attended the Focus 11 + clinic (mean age, 11.8 years), 7057 underwent a whole body DXA scan, which was performed using a Lunar Prodigy with pediatric scanning software. At the same time, sitting and standing height were measured using a Harpenden Stadiometer, as was weight using a Tanita Body Fat Analyser. After exclusion of scans with anomalies (e.g., artefacts caused by movement and jewelry), scans were available for 7006 children (Fig. 1). These were evaluated and reanalyzed as necessary to ensure that borders between adjacent subregions were optimally placed. DXA results were expressed as total body less head (TBLH) bone area, BMC, and areal BMD. Results were also analyzed for upper and lower limb separately. A more rigorous method for adjusting for skeletal size, area-adjusted BMC (aBMC), was also derived to provide a measure of volumetric BMD by using linear regression to adjust BMC for bone area.(18) DXA scans, which use a relatively accurate three-compartment model of body composition,(19) also provided measures of total body fat and lean mass.
FIG. 1.

Derivation of the study sample from F11 + clinic attendees.
Accelerometer recordings
All children who attended the Focus 11 + clinic were asked to wear an MTI Actigraph accelerometer, model WAM 7164 (Manufacturing Technology, Fort Walton Beach, FL, USA) for 7 days. The Actigraph is a small, lightweight, electronic motion sensor comprising a single plane (vertical) accelerometer worn in an elasticated belt on the right hip. Movement in a vertical plane is detected as a combined function of the frequency and intensity of the movement. The Actigraph has been validated in both children and adolescents.(20,21) Children were asked to wear the Actigraph for 7 consecutive days during waking hours and only to take it off for showering, bathing, or any water sports. Of the 7159 children who attended the Focus 11 + clinic, 6622 agreed to wear accelerometers, results were available in 6124, satisfactory recordings were obtained in 5615 (defined as minimum of 3 days of 600 minutes recording per day), and 5519 children had matching DXA data.
Data were downloaded and imported using customized software into a Microsoft Access 2000 database. The raw accelerometer data consists of minute-by-minute activity counts over the 7-day monitoring period, recorded in arbitrary units that represent an integrated measure of movement frequency and intensity (as reflected by rate of acceleration). The device uses a band-pass filter to eliminate signals <0.5 and >2.5 Hz to filter out nonhuman motion such as car driving. The main variable used in subsequent analyses consisted of total activity (accelerometer counts per minute), obtained by dividing the sum of accelerometer counts within a given frequency range by overall recording time. Further activity variables were calculated for each activity band, such as duration of activity (minutes per day), and mean activity (accelerometer counts per minute, obtained by dividing the sum of accelerometer counts by duration of activity).
A cut-point of >3600 counts/minute was used to analyze the amount of moderate and vigorous physical activity (MVPA). MVPA was further subdivided into moderate and vigorous activity using a threshold of 6200 counts/minute. These cut-points were based on a calibration study performed in a subgroup of 260 children, in whom these count frequencies were associated with oxygen consumption of 4 and 6 METS for moderate and vigorous activity respectively (CG Mattocks, S Leary, AR Ness, K Deere, J Saunders, J Kirkby, K Tilling, SN Blair, C Riddoch, unpublished data, 2006). Although these cut-points were primarily designed to relate activity to measures of body composition such as fat and lean mass, they also reflect levels of exercise intensity that are likely to be relevant to the skeletal response. For example, mean count for slow walking fell below the 3600/minute cut-point, mean counts associated with brisk walking and hopscotch were between the 3600 and 6200/minute cut-point, whereas jogging was associated with a mean count >6200/minute (CG Mattocks, S Leary, AR Ness, K Deere, J Saunders, J Kirkby, K Tilling, SN Blair, C Riddoch, unpublished data, 2006).
Other variables
Ethnicity, education, social class, and housing were obtained from self-reported questionnaires during pregnancy completed by the mother. Ethnicity, education, and social class were derived from information relating to both parents. Education was coded on an ascending five-point scale as follows: 1, none/CSE; 2, vocational; 3, O-level; 4, A-level; 5, university degree level (levels 1, 2, and 3 refer to educational qualifications generally gained at school at age 16 years and level 4 to qualifications gained at school at age 18). Social class was derived from occupations using the 1991 Office of Population Censuses and Surveys (OPCS) occupation-based classification. Housing tenure was defined as mortgaged/owned accommodation, private rental, council rental, or other.
Puberty was assessed by self-completion questionnaires using diagrams based on Tanner staging of pubic hair distribution for boys and pubic hair distribution and breast development for girls. These questionnaires had been completed within 16 weeks of the DXA in 2589 children with matching accelerometer and DXA data at age 11. After preliminary analysis, girls were classified according to Tanner stage based on breast and pubic hair development and boys based on pubic hair development alone. Approximately 40%, 40%, 15%, and 5% of boys were found to be Tanner stages 1, 2, 3, and 4, respectively. The equivalent breakdown in girls was 10%, 30%, 35%, 20%, and 5% for Tanner stages 1, 2, 3, 4, and 5, respectively.
Statistical analysis
Student’s t-test was used to explore possible differences in DXA and accelerometer data between boys and girls. Linear regression analysis was used to examine the relationship between DXA data and MVPA expressed as total activity as described above. Because the accelerometer used in this study largely recorded lower limb activity, our analysis focused on DXA parameters of the lower limb. Analysis was restricted to singleton white children. In our basic model, analyses were adjusted for age of DXA scan and sex, as well as housing, education, and social class; inclusion of socio-economic factors reduced the dataset to 4457 children (Fig. 1). To study possible influences of height and lean and fat mass, additional analyses were performed adjusting for these other factors. To examine the relative influence of different activity levels on DXA parameters, multivariable analyses were performed in which light, moderate, and vigorous total activity were simultaneously examined in relation to DXA parameters. In further studies aimed at exploring possible effects of puberty on associations between CSA and DXA data, analyses were restricted to the subset of 2589 children with pubertal stage information at the time of the DXA scan.
RESULTS
Characteristics of the 4457 children included in the study are shown in Table 1, according to sex. Total MVPA was higher in boys compared with girls. Height, fat mass, bone mass, and bone size were greater in girls compared with boys, whereas lean mass was greater in boys. In basic and height-adjusted regression models, strong positive associations were observed between total MVPA and lower limb BMD, aBMC, and BMC (see Table 2 for height-adjusted results). In contrast, no association was evident between total MVPA and lower limb bone area. Adjusting for lean mass or lean and fat mass had little effect on the association between total MVPA and lower limb BMD, aBMC, and BMC, with the exception that adjustment for lean mass alone led to attenuation of the association with BMC. An inverse relationship was observed between total MVPA and lower limb area after adjustment for lean mass alone, whereas a positive association was present between total MVPA and lower limb bone area after adjusting for both lean and fat mass. Similar relationships were present between total MVPA and TBLH DXA parameters to those found for the lower limb. Although total MVPA tended to show similar relationships with upper limb DXA parameters, these were generally weaker.
Table 1.
Age, Height, Total MVPA, and DXA-Derived Measures for TBLH and Upper and Lower Limbs in 2121 Boys and 2336 Girls
| Boys |
Girls |
p | |||
|---|---|---|---|---|---|
| Mean | SD | Mean | SD | ||
| Age (months) | 141 | 3 | 141 | 3 | 0.5 |
| Height (cm) | 150.0 | 7.1 | 151.4 | 7.2 | <0.001 |
| Total MVPA (100 counts/minute) |
1.86 | 1.17 | 1.24 | 0.94 | <0.001 |
| TBLH | |||||
| Lean mass (kg) | 30.0 | 4.1 | 29.2 | 4.4 | <0.001 |
| Fat mass (kg) | 10.1 | 6.4 | 12.7 | 6.4 | <0.001 |
| BMC (g) | 1177 | 244 | 1230 | 289 | <0.001 |
| Area (cm2) | 1384 | 202 | 1429 | 226 | <0.001 |
| BMD (g/cm2) | 0.844 | 0.060 | 0.851 | 0.071 | <0.001 |
| aBMC (g) | 1215 | 56 | 1212 | 60 | 0.05 |
| Upper limb | |||||
| BMC (g) | 158 | 35 | 168 | 40 | <0.001 |
| Area (cm2) | 227 | 50 | 242 | 43 | <0.001 |
| BMD (g/cm2) | 0.690 | 0.043 | 0.689 | 0.049 | 0.7 |
| aBMC (g) | 166 | 8 | 163 | 9 | <0.001 |
| Lower limb | |||||
| BMC (g) | 607 | 130 | 616 | 135 | 0.03 |
| Area (cm2) | 600 | 85 | 604 | 82 | 0.1 |
| BMD (g/cm2) | 1.004 | 0.090 | 1.010 | 0.100 | 0.04 |
| aBMC (g) | 614 | 41 | 617 | 42 | 0.05 |
Table 2.
Regression Coefficients (β) With 95% CIs and p Value, for Regression Between TBLH and Upper and Lower Limb BMC (g), Area (cm2), Areal BMD (mg/cm2), Area-Adjusted BMC (g), and Total MVPA, as Well as Age of DXA Scan, Sex, and Socio-Economic Factors
| Height |
Height and lean mass |
Height and lean and fat mass |
|||||||||||
|---|---|---|---|---|---|---|---|---|---|---|---|---|---|
| β | 95% CI | p | β | 95% CI | p | β | 95% CI | p | |||||
| TBLH | BMC | 4.02 | −0.50 | 8.53 | 0.08 | −0.47 | −4.10 | 3.16 | 0.8 | 14.92 | 11.80 | 18.05 | <0.001 |
| Area | −1.98 | −5.23 | 1.26 | 0.2 | −5.04 | −7.72 | −2.37 | <0.001 | 7.82 | 5.65 | 9.98 | <0.001 | |
| BMD | 4.52 | 3.09 | 5.96 | <0.001 | 3.26 | 2.04 | 4.48 | <0.001 | 5.90 | 4.70 | 7.11 | <0.001 | |
| aBMC | 6.46 | 4.88 | 8.04 | <0.001 | 5.74 | 4.22 | 7.25 | <0.001 | 5.30 | 3.75 | 6.86 | <0.001 | |
| Upper Limb |
BMC | 0.55 | −0.11 | 1.22 | 0.1 | −0.13 | −0.65 | 0.40 | 0.6 | 1.05 | 0.53 | 1.57 | <0.001 |
| Area | 0.18 | −0.49 | 0.86 | 0.6 | −0.47 | −1.02 | 0.08 | 0.09 | 0.81 | 0.27 | 1.34 | 0.003 | |
| BMD | 1.86 | 0.74 | 2.99 | 0.001 | 0.94 | −0.04 | 1.92 | 0.06 | 2.10 | 1.11 | 3.10 | <0.001 | |
| aBMC | 0.39 | 0.16 | 0.62 | <0.001 | 0.29 | 0.06 | 0.51 | 0.01 | 0.34 | 0.11 | 0.56 | 0.003 | |
| Lower Limb |
BMC | 3.53 | 1.39 | 5.67 | 0.001 | 1.39 | −0.32 | 3.10 | 0.1 | 9.44 | 8.04 | 10.84 | <0.001 |
| Area | −0.24 | −1.41 | 0.92 | 0.7 | −1.29 | −2.27 | −0.31 | 0.01 | 3.72 | 2.95 | 4.48 | <0.001 | |
| BMD | 6.75 | 4.64 | 8.85 | <0.001 | 5.01 | 3.18 | 6.84 | <0.001 | 9.42 | 7.63 | 11.20 | <0.001 | |
| aBMC | 3.90 | 2.76 | 5.05 | <0.001 | 3.36 | 2.26 | 4.46 | <0.001 | 3.74 | 2.62 | 4.87 | <0.001 | |
Analyses were adjusted for height, height and lean mass, and height and lean and fat mass (n = 4457). β reflects the change in DXA outcome per 100 cpm increase in activity level (height included both linear and quadratic terms).
To explore the effects of fat and lean mass adjustment on the association between total MVPA and lower limb bone area, the latter was analyzed in relation to total MVPA quartiles. Total MVPA was associated with a weak dose-dependent decrease in lower limb area after adjusting for height and lean mass, whereas a dose-dependent increase in lower limb area was observed after adjustment for height and lean mass and fat mass (Fig. 2). After adjusting for height and lean and fat mass, there was also a strong dose–response relationship between total MVPA and lower limb BMC (Fig. 3). In this fully adjusted model, lower limb BMC was 4.9% (0.60 SD) greater in children with MVPA levels in the top versus bottom quartile in contrast to a 1.9% (0.43 SD) difference in lower limb area.
FIG. 2.

Effect of total MVPA on lower limb bone area. Figures show mean bone area (cm2) ± SE according to quartile of total MVPA (0.02–0.74, 0.74–1.26, 1.26–2.06, 2.06–8.81 × 100 cpm for first, second, third, and fourth quarters, respectively). Results were adjusted for age of DXA scan, sex, and socio-economic factors and (A) height, (B) height + lean mass, and (C) height + lean mass + fat mass (n = 4457). p = 0.9, p = 0.1, and p < 0.001 for A, B, and C, respectively (F test for differences between quartiles).
FIG. 3.
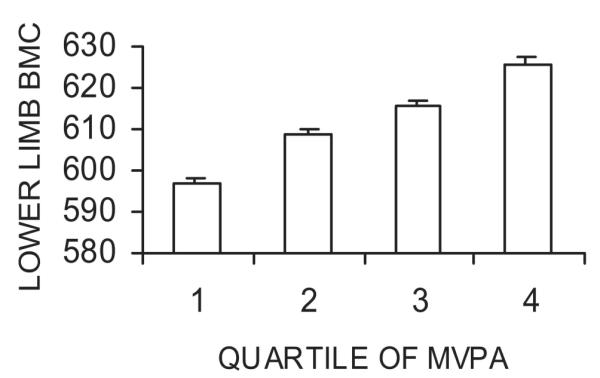
Effect of total MVPA on lower limb BMC. Figure shows mean BMC (g) ± SE according to quartile of total MVPA. Results were adjusted for age of DXA scan, sex, socio-economic factors, and height + lean mass + fat mass (n = 4457). p < 0.001 (F test for difference between quartiles).
We wished to compare the influence of light, moderate, and vigorous activity on DXA variables, characteristics of which are shown separately for boys and girls in Table 3. Total light, moderate, and vigorous activity was greater in boys compared with girls. In the case of light activity, this difference seemed to reflect higher mean activity levels in boys compared with girls. In contrast, sex differences in total moderate and vigorous activity generally reflected differences in activity duration; in the case of vigorous activity, mean activity was actually greater in girls.
Table 3.
Breakdown for Different Activity Levels as Defined by Movement Frequency Cut-Points in 2121 Boys and 2336 Girls
| Boys |
Girls |
p | |||
|---|---|---|---|---|---|
| Mean | sd | Mean | sd | ||
| Total activity (100 counts/minute) | |||||
| Overall | 6.61 | 1.84 | 5.50 | 1.5 | <0.001 |
| Light | 4.76 | 1.00 | 4.25 | 0.87 | <0.001 |
| Moderate | 1.41 | 0.82 | 0.89 | 0.56 | <0.001 |
| Vigorous | 0.45 | 0.53 | 0.36 | 0.61 | <0.001 |
| Moderate and vigorous | 1.86 | 1.17 | 1.24 | 0.94 | <0.001 |
| Activity duration (minutes/day) | |||||
| Overall | 783.2 | 47.0 | 774.9 | 46.4 | <0.001 |
| Light | 754.6 | 47.6 | 756.6 | 46.3 | 0.1 |
| Moderate | 24.6 | 14.1 | 15.5 | 9.6 | <0.001 |
| Vigorous | 4.0 | 4.3 | 2.8 | 3.7 | <0.001 |
| Moderate and vigorous | 28.6 | 17.0 | 18.3 | 11.6 | <0.001 |
| Mean activity (100 counts/minute) | |||||
| Light | 5.0 | 1.1 | 4.4 | 0.9 | <0.001 |
| Moderate | 44.4 | 1.5 | 44.0 | 1.7 | <0.001 |
| Vigorous | 82.9 | 17.4 | 87.2 | 22.4 | <0.001 |
| Moderate and vigorous | 50.0 | 7.4 | 51.1 | 11.0 | <0.001 |
For each level, data show total activity (i.e., total counts divided by overall recording time), duration, and mean activity (i.e., total counts divided by duration).
Multivariable regression analysis was subsequently performed between total light, moderate, and vigorous activity and DXA variables, after adjustment for height and lean and fat mass. Total moderate activity was strongly related to lower limb BMC, area, BMD, and aBMC (Table 4). Little or no independent relationship was present between total vigorous activity and DXA parameters of the lower limb. In contrast, there was a significant independent association between total light activity and lower limb BMC, BMD, and BMD, although the strength of the relationship, as reflected by regression coefficients, was considerably lower than observed for moderate activity. Broadly similar results were obtained for TBLH. In contrast, although total light and vigorous activity were positively related to upper limb BMC, area, and aBMC, no relation was observed between these parameters and moderate activity.
Table 4.
Regression Coefficients (β) With 95% CIs and p Value for Regression Between TBLH and Upper and Lower Limb BMC (g), Area (cm2), Areal BMD (mg/cm2), Area-Adjusted BMC (g), and Total Light, Moderate, and Vigorous Activity
| Light activity |
Moderate activity |
Vigorous activity |
|||||||||||
|---|---|---|---|---|---|---|---|---|---|---|---|---|---|
| β | 95% CI | p | β | 95% CI | p | β | 95% CI | p | |||||
| TBLH | BMC | 3.89 | −0.11 | 7.89 | 0.06 | 18.83 | 13.30 | 24.36 | <0.001 | 6.59 | 0.58 | 12.60 | 0.03 |
| Area | 2.47 | −0.30 | 5.24 | 0.08 | 8.73 | 4.90 | 12.56 | <0.001 | 4.59 | 0.42 | 8.75 | 0.03 | |
| BMD | 1.69 | 0.15 | 3.23 | 0.03 | 7.48 | 5.36 | 9.61 | <0.001 | 2.44 | 0.13 | 4.75 | 0.04 | |
| aBMC | 0.85 | −1.14 | 2.84 | 0.4 | 8.09 | 5.33 | 10.84 | <0.001 | 0.94 | −2.05 | 3.94 | 0.5 | |
| Upper limb | BMC | 1.15 | 0.49 | 1.81 | <0.001 | 0.11 | −0.80 | 1.02 | 0.8 | 1.34 | 0.35 | 2.34 | 0.008 |
| Area | 1.02 | 0.34 | 1.71 | 0.003 | −0.06 | −1.01 | 0.88 | 0.9 | 1.12 | 0.09 | 2.15 | 0.03 | |
| BMD | 2.20 | 0.92 | 3.47 | <0.001 | 0.17 | −1.59 | 1.93 | 0.9 | 2.83 | 0.92 | 4.75 | 0.004 | |
| aBMC | 0.25 | −0.04 | 0.54 | 0.09 | 0.17 | −0.23 | 0.57 | 0.4 | 0.36 | −0.08 | 0.79 | 0.1 | |
| Lower limb | BMC | 2.94 | 1.15 | 4.73 | 0.001 | 13.07 | 10.60 | 15.53 | <0.001 | 2.25 | −0.43 | 4.94 | 0.1 |
| Area | 1.43 | 0.46 | 2.41 | 0.004 | 5.07 | 3.72 | 6.41 | <0.001 | 0.76 | −0.70 | 2.23 | 0.3 | |
| BMD | 2.81 | 0.52 | 5.09 | 0.02 | 12.61 | 9.46 | 15.77 | <0.001 | 2.91 | −0.52 | 6.34 | 0.1 | |
| aBMC | 0.74 | −0.70 | 2.19 | 0.3 | 5.30 | 3.30 | 7.30 | <0.001 | 1.08 | −1.08 | 3.25 | 0.3 | |
Analyses were adjusted for age of DXA scan, sex, socio-economic factors, height, lean mass, and fat mass (n = 4457). β reflects the change in DXA outcome per 100 cpm increase in activity levels, after multiple regression analysis in which all three activity terms were included simultaneously (height included both linear and quadratic terms).
In further analyses based on the subgroup of 2589 children with completed Tanner stage questionnaires, a negative association was observed between Tanner stage and total MVPA in girls (p = 0.003), whereas no association was seen in boys. When associations between total MVPA and DXA parameters were reanalyzed in this subgroup with Tanner stage information and adjusted for pubertal stage, similar results were obtained to those in the study population as a whole. Furthermore, no interactions were observed with either sex or puberty, with two exceptions: the association between total MVPA and TBLH bone area was stronger in boys compared with girls (β = 9.62 and 5.21, respectively, p for interaction = 0.04, adjusted for height and lean and fat mass) and the positive association between total MVPA and upper limb aBMC was attenuated by puberty (β = 0.66, 0.62, −0.39, 0.42, and −2.13 for Tanner stages 1, 2, 3, 4, and 5, respectively, p for interaction = 0.01; adjusted for height and lean and fat mass).
DISCUSSION
We observed a positive relationship between physical activity as assessed by accelerometer recordings and BMD as measured by DXA, in a large population-based cohort of 11-year-old boys and girls, after adjusting for height and lean and fat mass. These findings are consistent with results of previous epidemiological studies in which bone mass was positively related to physical activity as assessed by questionnaire in children and young adults.(9-14) However, unlike previous studies based on questionnaires that generally focus on recalled participation in weight-bearing activities, physical activity as assessed in this study captured all movement, not just activity that the child could recall. As far as we are aware, only one previous study has examined DXA results in relation to accelerometer recordings in children, which was confined to analysis of preschool children.(16)
BMD measurements represent an areal BMD that is only partially corrected for skeletal size.(22) Therefore, further analyses were performed based on aBMC, which represents a more accurate estimate for volumetric BMD, leading to similar results. The finding that habitual level of physical activity in children is related to size-adjusted BMC is consistent with a previous report that participation in high-impact activities is positively associated with size-adjusted whole body and hip BMC in 16- to 18-year-old boys.(11) It is possible that the association between physical activity and volumetric BMD that we found represents an influence on cortical thickness, which has previously been shown to increase after exercise interventions such as tennis playing.(23)
Increased bone mass in response to physical activity in childhood may reduce the risk of osteoporotic fracture in later life, particularly if associated with improvements in bone geometry. For example, because bending strength of long bones is related to the fourth power of their radius, greater periosteal apposition in childhood may improve bone strength and reduce fracture risk in later life.(24) Although physical activity was unrelated to bone area in our basic regression models, we found that lean and fat mass exerted opposite influences on the relationship between physical activity and height-adjusted bone area, suggesting that important inter-relationships exist as shown in Fig. 4.
FIG. 4.
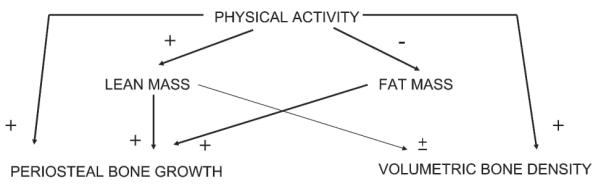
Relationships between physical activity, skeletal development, and body composition. We propose that physical activity exerts a direct positive effect on both periosteal bone growth (reflected by height-adjusted bone area) and volumetric BMD (reflected by aBMC). Moreover, physical activity indirectly stimulates periosteal bone growth as a consequence of effects on lean mass. In contrast, the tendency of physical activity to decrease fat mass acts to reduce periosteal bone growth.
The suggestion that physical activity stimulates periosteal apposition in part through changes in lean mass is consistent with the fact that lean mass is positively related both to physical activity and bone size, as also observed in this study (unpublished observations). However, the positive influence of physical activity on periosteal bone growth in childhood suggested by our results seemed to be opposed by an inverse relationship between physical activity and fat mass. This finding is consistent with evidence that fat mass is positively associated with skeletal size independently of lean mass,(25) as also found in the ALSPAC cohort,(26) and with our observation of a strong negative relationship between physical activity and fat mass in this study population (unpublished data).
Our findings may explain discrepancies between previous studies in which exercise interventions in children have been found to increase bone size in some studies,(3,5-7) but not others,(4,5,8) because these may have had different effects on fat mass (although some of these studies adjusted for effects on weight or body mass index, our findings suggest that fat mass needs to be adjusted for independently of lean mass). Consistent with these findings, a recent cross-sectional pQCT study of 18-year-old men found a positive relationship between physical activity as assessed by questionnaire and bone size after adjusting for height and weight.(12)
To explore the influence of physical activity on skeletal development, we compared the relationship between DXA parameters and exposure to different levels of intensity of physical activity, using movement frequency cut-offs validated against oxygen consumption. Interestingly, the relationship between physical activity intensity and skeletal responsiveness was represented by an inverted U-shaped curve, because the association between moderate activity and lower limb and TBLH DXA parameters was considerably stronger than that for either light or vigorous activity. We are not aware of any previous clinical study evaluating the relationship between different levels of physical activity intensity and skeletal development.
The suggestion from our results that moderate activity levels induce a greater skeletal response compared with light activity as defined by movement frequency and intensity is consistent with previous observations of a positive relationship between strain rate and periosteal bone formation in animal models.(27) However, strain rate was positively related to bone formation across the physiological dose range in the latter studies, with which our observation that vigorous activity elicited a weaker skeletal response compared with moderate activity would seem to be at odds. A likely explanation for this apparent discrepancy is that our accelerometer recordings may have misclassified a substantial proportion of vigorous as moderate activity. For example, activity recordings were averaged out over 1-minute epochs, which may have reduced the detection of short bursts of vigorous activity sustained for <1 minute, which are relatively frequent in children.(28) Moreover, accelerometer devices used in this study filtered out movements with a frequency >2.5 Hz to exclude nonhuman movement, which may have limited the detection of certain high-intensity activities. The observation in our previous calibration study that playing hopscotch is categorized as moderate activity in contrast to jogging, which is classified as vigorous activity (CG Mattocks, S Leary, AR Ness, K Deere, J Saunders, J Kirkby, K Tilling, SN Blair, C Riddoch, unpublished data, 2006), despite the fact that hopscotch consists of intermittent high-impact jumping, is consistent with this interpretation. In contrast, upper limb bone mass showed a greater response to vigorous compared with moderate activity, which may reflect a stronger tendency for activities classified as vigorous, such as jogging, to involve the upper limbs.
Nevertheless, use of a relatively precise instrument to assess habitual levels of physical activity in children in this study enabled us to examine the association between bone development and the broad range of activity levels present within child populations. Because a dose–response relationship was observed between DXA parameters and total MVPA with no evidence for a threshold or plateau effect, our results suggest that relatively minor increments in habitual exposure to moderately intense activity (such as brisk walking) confer beneficial effects on the skeleton in school age children. When comparing results for lower limb BMC (adjusted for height and lean and fat mass) between children with MVPA levels in the top versus bottom quartile, a difference of 0.60 SD was observed, suggesting that habitual levels of physical activity represent an important physiological influence on skeletal development, which is likely to affect bone strength and risk of osteoporotic fracture in later life.
In terms of weaknesses of the study, as described above, use of accelerometers as calibrated in this study may have resulted in the misclassification of a substantial proportion of vigorous as moderate activity. Another weakness is that accelerometers were only worn for 3–7 days. Based on our previous validation study in which 244 11- to 12-year-old children wore the accelerometer device for 7 days four times over the course of a year, measurement over a single time period detects ~50% of the overall variability in activity between children as recorded by repeated measurements (CG Mattocks, S Leary, AR Ness, K Deere, J Saunders, J Kirkby, K Tilling, SN Blair, C Riddoch, unpublished data, 2006). In addition, biases may have arisen in the accelerometer data because of inability to measure certain types of physical activity such as swimming, cycling, and some contact sports. However, time sheets completed by children indicated that relatively little time was spent in these activities. For example, 68% and 78% of the cohort reported no swimming and cycling, respectively, during the 7-day measurement period, whereas 4% and 11% reported three or more episodes of these activities.
In terms of other weaknesses, DXA only enables periosteal bone growth to be estimated from height-adjusted bone area, in contrast to pQCT, which measures periosteal circumference directly. In addition, because our analyses were based on approximately one third of the original cohort, our results may have been influenced by bias caused by loss of follow-up. Another limitation is that Tanner stage information was obtained by self-completed questionnaires as opposed to physical examination and was only available in 55% of our study population. Theoretically, exclusion of the 16% of children with insufficient recorded data may have biased the results, if the relationship between accelerometer and DXA data is altered in this group. However, this is considered unlikely, because DXA parameters in children excluded for this reason were very similar to those in the remainder of the cohort (data not shown).
In conclusion, we found that total MVPA as assessed by accelerometer recordings in 11-year-old children is associated with a dose–response increase in BMD and aBMC. In contrast, in analyses adjusted for height and lean mass, total MVPA was inversely related to bone size as reflected by DXA-based measures of bone area. On the other hand, after adjusting for fat as well as lean mass and height, total MVPA was positively related to bone size. Taken together, our results suggest that habitual levels of physical activity to which children in the wider population are generally exposed increase bone mass through combined effects on BMD and bone size. However, the positive influence of physical activity on bone size seems to be opposed by the tendency of physical activity to reduce fat mass. Therefore, exercise programs may be more effective at enhancing skeletal development in childhood when associated with a minimal reduction in fat mass.
ACKNOWLEDGMENTS
We are extremely grateful to all the families who took part in this study, the midwives for their help in recruiting them, and the whole ALSPAC team, which includes interviewers, computer and laboratory technicians, clerical workers, research scientists, volunteers, managers, receptionists, and nurses. The UK Medical Research Council, the Wellcome Trust, and the University of Bristol provide core support for ALSPAC. This publication is the responsibility of JT and CS who also serve as guarantors for the contents of this paper. This research was specifically funded by National Heart, Lung and Blood Institute Grant R01 HL071248-01A and Wellcome Trust Grant GR068049MA.
Footnotes
The authors state that they have no conflicts of interest.
REFERENCES
- 1.MacKelvie KJ, Khan KM, Petit MA, Janssen PA, McKay HA. A school-based exercise intervention elicits substantial bone health benefits: A 2-year randomized controlled trial in girls. Pediatrics. 2004;112:e447. doi: 10.1542/peds.112.6.e447. [DOI] [PubMed] [Google Scholar]
- 2.MacKelvie KJ, McKay HA, Petit MA, Moran O, Khan KM. Bone mineral response to a 7-month randomized controlled, school-based jumping intervention in 121 prepubertal boys: Associations with ethnicity and body mass index. J Bone Miner Res. 2002;17:834–844. doi: 10.1359/jbmr.2002.17.5.834. [DOI] [PubMed] [Google Scholar]
- 3.Petit MA, McKay HA, MacKelvie KJ, Heinonen A, Khan KM, Beck TJ. A randomized school-based jumping intervention confers site and maturity-specific benefits on bone structural properties in girls: A hip structural analysis study. J Bone Miner Res. 2002;17:363–372. doi: 10.1359/jbmr.2002.17.3.363. [DOI] [PubMed] [Google Scholar]
- 4.Bradney M, Pearce G, Naughton G, Sullivan C, Bass S, Beck TJ, Carlson J, Seeman E. Moderate exercise during growth in prepubertal boys: Changes in bone mass, size, volumetric density, and bone strength: A controlled prospective study. J Bone Miner Res. 1998;13:1814–1821. doi: 10.1359/jbmr.1998.13.12.1814. [DOI] [PubMed] [Google Scholar]
- 5.MacKelvie KJ, Petit MA, Khan KM, Beck TJ, McKay HA. Bone mass and structure are enhanced following a 2-year randomized controlled trial of exercise in prepubertal boys. Bone. 2004;34:755–764. doi: 10.1016/j.bone.2003.12.017. [DOI] [PubMed] [Google Scholar]
- 6.Morris FL, Naughton GA, Gibbs JL, Carlson JS, Wark JD. Prospective ten-month exercise intervention in premenarcheal girls: Positive effects on bone and lean mass. J Bone Miner Res. 1997;12:1453–1462. doi: 10.1359/jbmr.1997.12.9.1453. [DOI] [PubMed] [Google Scholar]
- 7.Fuchs RK, Bauer JJ, Snow CM. Jumping improves hip and lumbar spine bone mass in prepubescent children: A randomized controlled trial. J Bone Miner Res. 2001;16:148–156. doi: 10.1359/jbmr.2001.16.1.148. [DOI] [PubMed] [Google Scholar]
- 8.Heinonen A, Sievanen H, Kannus P, Oja P, Pasanen M, Vuori I. High-impact exercise and bones of growing girls: A 9-month controlled trial. Osteoporos Int. 2000;11:1010–1017. doi: 10.1007/s001980070021. [DOI] [PubMed] [Google Scholar]
- 9.Kemper HC, Twisk JW, van Mechelen W, Post GB, Roos JC, Lips P. A fifteen-year longitudinal study in young adults on the relation of physical activity and fitness with the development of the bone mass: The Amsterdam Growth And Health Longitudinal Study. Bone. 2000;27:847–853. doi: 10.1016/s8756-3282(00)00397-5. [DOI] [PubMed] [Google Scholar]
- 10.Wang MC, Crawford PB, Hudes M, Van Loan M, Siemering K, Bachrach LK. Diet in midpuberty and sedentary activity in prepuberty predict peak bone mass. Am J Clin Nutr. 2003;77:495–503. doi: 10.1093/ajcn/77.2.495. [DOI] [PubMed] [Google Scholar]
- 11.Ginty F, Rennie KL, Mills L, Stear S, Jones SB, Prentice A. Positive, site-specific associations between bone mineral status, fitness, and time spent at high-impact activities in 16- to 18-year-old boys. Bone. 2005;36:101–110. doi: 10.1016/j.bone.2004.10.001. [DOI] [PubMed] [Google Scholar]
- 12.Lorentzon M, Mellstrom D, Ohlsson C. Association of Amount of Physical Activity With Cortical Bone Size and Trabecular Volumetric BMD in Young Adult Men:The GOOD Study. J Bone Miner Res. 2005;20:1936–1943. doi: 10.1359/JBMR.050709. [DOI] [PubMed] [Google Scholar]
- 13.Lloyd T, Petit MA, Lin HM, Beck TJ. Lifestyle factors and the development of bone mass and bone strength in young women. J Pediatr. 2004;144:776–782. doi: 10.1016/j.jpeds.2004.02.047. [DOI] [PubMed] [Google Scholar]
- 14.Neville CE, Murray LJ, Boreham CA, Gallagher AM, Twisk J, Robson PJ, Savage JM, Kemper HC, Ralston SH, Davey Smith G. Relationship between physical activity and bone mineral status in young adults: The Northern Ireland young hearts project. Bone. 2002;30:792–798. doi: 10.1016/s8756-3282(02)00711-1. [DOI] [PubMed] [Google Scholar]
- 15.Kohl HW, Fulton JE, Casperson C. Assessment of physical activity among children and adolescents: A review and synthesis. Prev Med. 2000;31:S54–S76. [Google Scholar]
- 16.Janz KF, Burns TL, Torner JC, Levy SM, Paulos R, Willing MC, Warren JJ. Physical activity and bone measures in young children: The Iowa bone development study. Pediatrics. 2001;107:1387–1393. doi: 10.1542/peds.107.6.1387. [DOI] [PubMed] [Google Scholar]
- 17.Golding J, Pembrey M, Jones R. ALSPAC- The Avon Longitudinal Study of Parents and Children 1. Study methodology. Paediatr Perinat Epidemiol. 2001;15:74–87. doi: 10.1046/j.1365-3016.2001.00325.x. [DOI] [PubMed] [Google Scholar]
- 18.Tobias JH, Cook DG, Chambers TJ, Dalzell N. A comparison of bone mineral density between Caucasian, Asian and Afro- Caribbean women. Clin Sci (Lond) 1994;87:587–591. doi: 10.1042/cs0870587. [DOI] [PubMed] [Google Scholar]
- 19.Veldhuis JD, Roemmich JN, Richmond EJ, Rogol AD, Lovejoy JC, Sheffield-Moore M, Mauras N, Bowers CY. Endocrine control of body composition in infancy, childhood, and puberty. Endocr Rev. 2005;26:114–146. doi: 10.1210/er.2003-0038. [DOI] [PubMed] [Google Scholar]
- 20.Ekelund U, Sjostrom M, Yngve A, Poortvliet E, Nilsson A, Froberg K. Physical activity assessed by activity monitor and doubly labeled water in children. Med Sci Sports Exer. 2001;33:275–281. doi: 10.1097/00005768-200102000-00017. [DOI] [PubMed] [Google Scholar]
- 21.Trost SG, Ward DS, Moorehead SM, Watson PD, Riner W, Burke JR. Validity of the computer science and applications (CSA) activity monitor in children. Med Sci Sports Exer. 1998;30:629–633. doi: 10.1097/00005768-199804000-00023. [DOI] [PubMed] [Google Scholar]
- 22.Heaney RP. BMD: The problem. Osteoporos Int. 2005;16:1013–1015. doi: 10.1007/s00198-005-1855-y. [DOI] [PubMed] [Google Scholar]
- 23.Haapasalo H, Kontulainen SA, Sievanen H, Kannus P, Jarvinen M, Vuori I. Exercise-induced bone gain is due to enlargement in bone size without a change in volumetric bone density: A peripheral quantitative computed tomography study of the upper arms of male tennis player. Bone. 2000;27:351–357. doi: 10.1016/s8756-3282(00)00331-8. [DOI] [PubMed] [Google Scholar]
- 24.Seeman E. Editorial: An exercise in geometry. J Bone Miner Res. 2002;17:373–380. doi: 10.1359/jbmr.2002.17.3.373. [DOI] [PubMed] [Google Scholar]
- 25.Wang MC, Bachrach LK, Van Loan M, Hudes M, Flegal KM, Crawford PB. The relative contributions of lean tissue mass and fat mass to bone density in young women. Bone. 2005;37:474–481. doi: 10.1016/j.bone.2005.04.038. [DOI] [PubMed] [Google Scholar]
- 26.Clark EM, Ness AR, Tobias JH, team As Adipose tissue stimulate bone growth in prepubertal children. J Clin Endocrinol Metab. 2006;91:2534–2541. doi: 10.1210/jc.2006-0332. [DOI] [PMC free article] [PubMed] [Google Scholar]
- 27.Mosley JR, March BM, Lynch J, Lanyon LE. Strain magnitude related changes in whole bone architecture in growing rats. Bone. 1997;20:191–198. doi: 10.1016/s8756-3282(96)00385-7. [DOI] [PubMed] [Google Scholar]
- 28.Bailey RC, Olson J, Pepper SL, Porszasz J, Barstow TJ, Cooper DM. The level and tempo of children’s physical activities: An observational study. Med Sci Sports Exerc. 1995;27:1033–1041. doi: 10.1249/00005768-199507000-00012. [DOI] [PubMed] [Google Scholar]