

Abstract
Context
Fat mass represents a positive influence on bone mass in adults, independently of other factors such as lean mass, but whether a similar action occurs in children is unclear.
Objective
Our objective was to examine the relationship between fat mass and bone mass in children.
Design and Setting
We conducted combined cross-sectional and prospective analyses at university research clinics.
Participants
Participants included children aged 9.9 yr from a large population-based birth cohort in southwest England.
Outcomes
Relationships between total body fat mass were measured by dual-energy x-ray absorptiometry at age 9.9 yr, and 1) total-body-less-head bone mass and area at age 9.9 and 2) increase in bone mass and area over the following 2 yr.
Results
There was a strong positive relationship between total body fat mass and total-body-less-head bone mass and area, even after adjustment for height and/or lean mass (P < 0.001). There was a similar positive association between total body fat mass and increase in bone mass and area over the following 2 yr in boys and Tanner stage 1 girls. In contrast, no association was present between fat mass and gain in bone mass and size in Tanner stage 2 girls, whereas a negative association was seen in Tanner stage 3 girls (puberty-fat mass interaction, P < 0.001).
Conclusions
In prepubertal children, fat mass is a positive independent determinant of bone mass and size and of increases in these parameters over the following 2 yr, suggesting that adipose tissue acts to stimulate bone growth. However, this relationship is attenuated by puberty.
Low body weight is an important risk factor for hip fracture in the elderly (1, 2). Several lines of evidence suggest that this association reflects a positive influence of body weight on bone mass. For example, the relationship between body weight and hip fracture risk disappears after adjusting for areal bone mineral density (BMD) (1), and body weight is one of the strongest predictors of bone mass in both sexes (3). In terms of which component(s) of body weight underlie this association, although lean, fat, and bone mass are all highly correlated, the association between bone and lean mass is strongest (4). Nevertheless, in 921 young adult women, an independent positive association was observed between fat mass and bone mass as reflected by areal BMD and bone mineral content (BMC) (5), suggesting that fat mass contributes to the positive influence of body weight on bone mass. In a recent study of 1068 men aged 18.9 yr, fat mass was positively correlated with tibial cross-sectional area as assessed by peripheral quantitative computed tomography (pQCT), whereas a negative association was observed at the radius, suggesting that adipose tissue acts to stimulate growth of weight-bearing bones only (6).
Contrary to the case in adults, higher body weight has been reported to increase the risk of fracture in children (7, 8). Furthermore, children and adolescents with repeated forearm fractures have been found to have elevated levels of adiposity (9), and obese children have been reported to have a lower bone mass for a given weight in several previous studies (8, 10-13). On the other hand, in a recent study in which indices of proximal femur geometry were derived from hip dual-energy x-ray aborptiometry (DXA) scans in overweight adolescents, fat mass was not found to influence any skeletal parameter independently of lean mass (14). In addition, in a study of 18 obese and 30 nonobese children, bone age in the former group was more advanced, but BMD was similar (15). Therefore, whether fat mass exerts an independent influence on the skeleton in children as in adults is currently unclear.
Several potential mechanisms exist whereby fat mass might exert a negative influence on bone mass in childhood. For example, adipose tissue is known to express aromatase enzymes that convert steroid precursors to estrogen, which suppress periosteal bone growth (16). Furthermore, increased leptin levels secondary to higher fat mass have been suggested to mediate the negative association between fat mass and periosteal growth observed at non-weight-bearing sites (6). Conversely, fat mass may stimulate bone growth via a direct mechanical action of increased load (17), by association with increased lean mass that occurs in obese subjects (18), or by an indirect action on timing of pubertal events (19).
The link between obesity and timing of pubertal events has been documented by many observers (19-22), but the exact mechanism behind this is unclear. Obese children may enter puberty earlier than their normal-weight counterparts because of higher estradiol levels or leptin levels (15). Puberty has a key role for bone development because skeletal mass approximately doubles at the end of adolescence (23). Possible interactions between skeletal growth, fat mass, and puberty are undefined but are likely to be present and require further investigation.
We recently investigated the relationship between socioeconomic status and bone mass in the Avon Longitudinal Study of Parents and Children (ALSPAC) (24), which is a unique population-based birth cohort of around 14,000 children in southwest England (25). As previously found, social position tended to increase bone area in children aged 9.9 yr as a consequence of greater height. However, lower social position also increased bone area because of higher fat mass. These findings raise the possibility that fat mass exerts an important stimulatory influence on bone growth in childhood.
In this study, we aimed to extend our recent observations by exploring the relationship between fat mass and bone size in children from the ALSPAC cohort in more detail. In particular, we wished to determine whether fat mass is positively related to bone size in prepubertal children independently of height and lean mass. We also examined whether fat mass predicts subsequent gain in bone size as assessed prospectively and whether the relationship between fat mass and bone size is altered by the onset of puberty.
Subjects and Methods
Study population
The ALSPAC is a geographically based cohort that recruited pregnant women residing in Avon with an expected date of delivery between April 1, 1991, and December 31, 1992. A total of 14,541 pregnancies were initially enrolled, with 14,062 children born. This represented 80-90% of the eligible population (see www.alspac.bris.ac.uk for further details on the ALSPAC cohort) (25). Of these births, 13,988 were alive at 12 months. The present study is based on results for height, weight, and total-body DXA scans obtained at research clinics to which the whole cohort was invited at mean ages of 9.9 and 11.8 yr (Fig. 1). Ethical approval was obtained from the ALSPAC Law and Ethics Committee and local research ethics committees. Parental consent and the child’s assent were obtained for all measurements made.
Fig. 1.
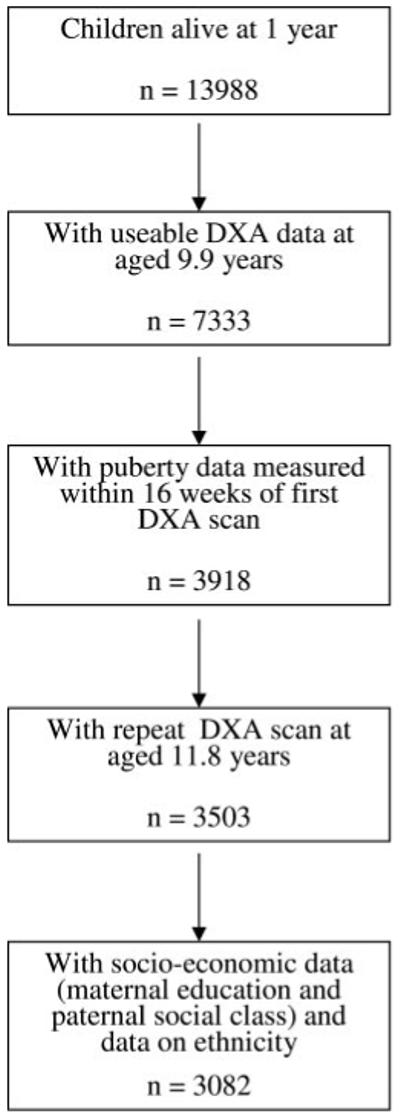
Recruitment pattern of the study sample used to analyze associations between fat mass and bone area.
Measurement of height, weight, and DXA-derived parameters
Height was measured to the last complete millimeter using the Harpenden stadiometer. Weight was measured to the nearest 50 g using the Tanita body fat analyzer (model TBF 305). Total-body DXA scans were performed using a Lunar Prodigy dual-energy x-ray absorptiometer. Variables used in the present study were total body fat (g) and lean mass (g), and total-body-less-head (TBLH) BMC (g), BMD (g/cm2), and bone area (cm2). Total-body DXA scans were not used, because the head is not responsive to environmental stimuli such as physical activity (26). Regional measures derived from total-body scans at age 9.9 yr were also examined. The coefficient of variation for TBLH BMC was 0.8% based on 120 repeat scans.
Other variables
The mother’s, partner’s, and grandparent’s race and ethnic group, mother’s highest educational qualification, and paternal social class were recorded at 32 wk gestation as described elsewhere (24). Gender was obtained from birth notifications. At the time of the DXA scan and measurement of the anthropometric variables, the child’s age was calculated from the date of birth and date of attendance at the research clinic. Puberty was assessed by self-completion questionnaires using diagrams based on Tanner staging of pubic hair distribution for boys and breast development for girls. In view of the major influence of puberty on DXA-derived parameters, the present study was based on the subgroup of children in whom pubertal-stage information was available within 3 months before the age 9.9-yr clinic visit.
Statistical analysis
A two-tailed unpaired t test was used to assess differences between Tanner stage 1 and 2 boys in height, weight, and DXA-derived measures, and differences between Tanner stage 1, 2, and 3 girls were evaluated using an F test. Change (Δ) in height, weight, and DXA values between ages 9.9 and 11.8 yr was expressed as percent increase, obtained by dividing the difference between these two values by the baseline measurement. Linear regression analysis was used to examine associations between total body fat mass and TBLH bone area and BMC at age 9.9 yr and TBLH Δbone area between ages 9.9 and 11.8 yr. Analyses were performed separately in boys and Tanner stage 1, 2, and 3 girls and adjusted for age, ethnicity, and socioeconomic status (maternal education and paternal social class) with or without height and/or total-body lean mass, with TBLH bone area or BMC as the dependent variable. For these regression models, standardized continuous variables (minus mean, divided by sd) were used for fat mass, TBLH bone area, TBLH BMC, height, and lean mass. Coefficients are therefore per sd increase in dependent variable. R2 values presented are the adjusted R2 and represent the proportion of variability in the dependent variable explained by the statistical model. P value for test for trend was calculated by treating the quartiles of fat mass as a continuous variable in the regression models. Interactions between variables were assessed by including a multiplicative interaction term in the regression models and calculating the likelihood ratio test. All statistical analyses were performed with STATA 8.0.
Results
A total of 3503 children were identified in whom DXA data were available from both age 9.9- and 11.8-yr research clinic visits, and measures of puberty had been obtained within 3 months of the age 9 clinic attendance (Fig. 1). Characteristics of these children are shown in Table 1. In girls, differences were observed according to Tanner stage for height, weight, total body fat and lean mass, and TBLH bone area, BMD, and BMC. Tanner stage at age 9 was also related to change in these parameters over the following 2 yr. Differences according to Tanner stage were evident in boys, but their magnitude was considerably smaller than in girls, presumably reflecting the fact that boys in Tanner stage 2 were at a relatively early stage of puberty. In subsequent analyses, results for Tanner stage 1 and 2 boys were pooled.
TABLE 1.
Mean height, weight, and total-body fat mass and lean mass, and TBLH bone area, BMD, and BMC at age 9.9 yr and change (Δ) in these parameters between age 9.9 and 11.8 yr
| Boys |
Girls |
||||||||
|---|---|---|---|---|---|---|---|---|---|
| Stage 1 (n = 1323), mean ± SD | Stage 2 (n = 262), mean ± SD | P | All (n = 1585), mean ± SD | Stage 1 (n = 1227), mean ± SD | Stage 2 (n = 583), mean ± SD | Stage 3 (n = 108), mean ± SD | P | All (n = 1918), mean ± SD | |
| Age 9.9 yr | |||||||||
| Height (cm) | 139.2 ± 6.0 | 140.4 ± 6.0 | 0.004 | 139.4 ± 6.0a | 137.2 ± 5.9 | 140.6 ± 5.9 | 144.1 ± 6.0 | <0.001 | 138.6 ± 6.3a |
| Weight (kg) | 33.6 ± 6.7 | 34.9 ± 6.7 | 0.004 | 33.8 ± 7.1 | 31.6 ± 6.2 | 38.0 ± 6.2 | 44.4 ± 6.2 | <0.001 | 34.3 ± 7.1 |
| Fat mass (kg) | 6.9 ± 4.6 | 7.6 ± 4.6 | 0.021 | 7.0a ± 4.7 | 7.6 ± 4.2 | 11.8 ± 4.2 | 16.0 ± 4.2 | <0.001 | 9.3 ± 4.7a |
| Lean mass (kg) | 25.2 ± 2.9 | 25.8 ± 2.9 | 0.004 | 25.3 ± 2.9a | 22.4 ± 2.7 | 24.4 ± 2.7 | 26.4 ± 2.7 | <0.001 | 23.3 ± 3.0a |
| TBLH bone area (cm2) | 1129 ± 150 | 1162 ± 150 | 0.001 | 1135 ± 157a | 1058 ± 147 | 1176 ± 147 | 1294 ± 147 | <0.001 | 1107 ± 157a |
| TBLH BMD (g/cm2) | 0.778 ± 0.05 | 0.784 ± 0.05 | 0.067 | 0.779 ± 0.05a | 0.755 ± 0.05 | 0.788 ± 0.05 | 0.821 ± 0.05 | <0.001 | 0.769 ± 0.05a |
| TBLH BMC (g) | 884 ± 167 | 918 ± 167 | 0.002 | 889 ± 174a | 803 ± 161 | 934 ± 161 | 1065 ± 161 | <0.001 | 858 ± 174a |
| Age 11.8 vs. 9.9 yr | |||||||||
| ΔHeight (% change) | 7.7 ± 1.8 | 7.8 ± 1.8 | 0.303 | 7.7 ± 2.0a | 9.1 ± 2.1 | 9.4 ± 2.1 | 9.6 ± 2.1 | 0.011 | 9.2a ± 2.0 |
| ΔWeight (%) | 25.4 ± 9.2 | 26.4 ± 9.3 | 0.082 | 25.5 ± 9.6a | 28.4 ± 9.8 | 30.4 ± 9.8 | 32.5 ± 9.9 | <0.001 | 29.2a ± 9.6 |
| TBLH Δbone area (%) | 22.5 ± 6.4 | 23.1 ± 6.4 | 0.203 | 22.6 ± 7.9a | 28.1 ± 8.8 | 30.8 ± 8.8 | 33.5 ± 8.8 | <0.001 | 29.2 ± 7.9a |
| TBLH ΔBMD (%) | 8.6 ± 2.6 | 8.8 ± 2.7 | 0.197 | 8.6 ± 3.6a | 10.0 ± 4.1 | 12.1 ± 4.1 | 14.3 ± 4.1 | <0.001 | 10.9 ± 3.6a |
| TBLH ΔBMC (%) | 33.1 ± 9.2 | 34.0 ± 9.2 | 0.161 | 33.3 ± 12.3a | 41.2 ± 14.0 | 47.0 ± 14.0 | 52.7 ± 14.0 | <0.001 | 43.6 ± 12.3a |
Results are shown separately for boys and girls, who are further subdivided according to results of Tanner stage self-completion questionnaire in 1585 boys and 1918 girls. Seventeen boys and 27 girls whose Tanner stage fell outside the stages reported above were excluded. P values reflect the differences between stages 1 and 2 for boys (unpaired Student’s t test) and stages 1, 2, and 3 for girls (F test for trend).
P < 0.05 with unpaired Student’s t test for the difference between boys and girls.
Results for 3082 children were available for analysis in the minimally adjusted regression model, which included age of DXA scan, ethnic group, and socioeconomic status. A strong positive association was observed between total-body fat mass and TBLH bone area measured at age 9.9 yr in boys and girls combined (Table 2), as previously reported (24). An equivalent relationship was observed between fat mass and TBLH BMC to that seen for fat mass and TBLH bone area, reflecting the fact that bone size is the major determinant of bone mass in growing children. In additional analyses where we examined TBLH bone area according to fat mass quartile, a linear dose-response relationship was found between fat mass and TBLH bone area (Fig. 2A).
TABLE 2.
Associations between total-body fat mass and TBLH BA or TBLH BMC at age 9.9 yr calculated by multivariable linear regression on 3082 boys and girls
| Variables in regression model | n | Fat mass vs. TBLH bone area at age 9.9 yr |
Fat mass vs. TBLH BMC at age 9.9 yr |
||||
|---|---|---|---|---|---|---|---|
| Coefficient (95% CI) | P value | R2 | Coefficient (95% CI) | P value | R2 | ||
| Model 1: age, ethnicity, and socioeconomic status | |||||||
| Boys and girls | 3082 | 0.693 (0.666-0.720) | <0.001 | 0.463 | 0.673 (0.645-0.700) | <0.001 | 0.441 |
| Boys | 1398 | 0.624 (0.583-0.666) | <0.001 | 0.605 (0.562-0.647) | <0.001 | ||
| Tanner stage 1 girls | 1085 | 0.755 (0.697-0.812) | <0.001 | 0.714 (0.657-0.771) | <0.001 | ||
| Tanner stage 2 girls | 508 | 0.674 (0.603-0.746) | <0.001 | 0.646 (0.574-0.718) | <0.001 | ||
| Tanner stage 3 girls | 91 | 0.599 (0.473-0.725) | <0.001 | 0.593 (0.466-0.721) | <0.001 | ||
| Model 1 and height | |||||||
| Boys and girls | 3082 | 0.383 (0.364-0.401) | <0.001 | 0.801 | 0.388 (0.367-0.410) | <0.001 | 0.727 |
| Boys | 1398 | 0.321 (0.294-0.348) | <0.001 | 0.326 (0.293-0.359) | <0.001 | ||
| Tanner stage 1 girls | 1085 | 0.426 (0.387-0.465) | <0.001 | 0.421 (0.377-0.466) | <0.001 | ||
| Tanner stage 2 girls | 508 | 0.434 (0.387-0.482) | <0.001 | 0.417 (0.364-0.470) | <0.001 | ||
| Tanner stage 3 girls | 91 | 0.414 (0.326-0.501) | <0.001 | 0.430 (0.327-0.532) | <0.001 | ||
| Model 1 and lean mass | |||||||
| Boys and girls | 3082 | 0.281 (0.264-0.299) | <0.001 | 0.838 | 0.271 (0.252-0.291) | <0.001 | 0.799 |
| Boys | 1398 | 0.249 (0.224-0.274) | <0.001 | 0.238 (0.209-0.267) | <0.001 | ||
| Tanner stage 1 girls | 1085 | 0.278 (0.241-0.315) | <0.001 | 0.260 (0.220-0.301) | <0.001 | ||
| Tanner stage 2 girls | 508 | 0.334 (0.286-0.383) | <0.001 | 0.309 (0.258-0.361) | <0.001 | ||
| Tanner stage 3 girls | 91 | 0.381 (0.297-0.465) | <0.001 | 0.375 (0.289-0.461) | <0.001 | ||
| Model 1 and height and lean mass | |||||||
| Boys and girls | 3082 | 0.274 (0.258-0.290) | <0.001 | 0.871 | 0.266 (0.247-0.285) | <0.001 | 0.815 |
| Boys | 1398 | 0.234 (0.212-0.256) | <0.001 | 0.228 (0.200-0.256) | <0.001 | ||
| Tanner stage 1 girls | 1085 | 0.276 (0.243-0.309) | <0.001 | 0.259 (0.220-0.297) | <0.001 | ||
| Tanner stage 2 girls | 508 | 0.344 (0.300-0.388) | <0.001 | 0.317 (0.268-0.366) | <0.001 | ||
| Tanner stage 3 girls | 91 | 0.367 (0.290-0.444) | <0.001 | 0.368 (0.283-0.454) | <0.001 | ||
Coefficients with 95% confidence intervals (CI) were calculated for each of the four regression models shown, using standardized continuous variables (minus mean, divided by SD) for fat mass, TBLH bone area, TBLH BMC, height, and lean mass. Coefficients are therefore per SD increase in dependent variable. R2 is the adjusted R2 for each model with the boys and girls combined. In the final model for the association between fat mass and TBLH bone area for boys and girls combined, the coefficient for height is 0.315 (95% CI, 0.293-0.337) and for lean mass is 0.511 (95% CI, 0.487-0.536). In the final model for the association between fat mass and TBLH BMC, the coefficient for height is 0.219 (95% CI, 0.193-0.245) and for lean mass is 0.573 (95% CI, 0.544-0.602).
Fig. 2.
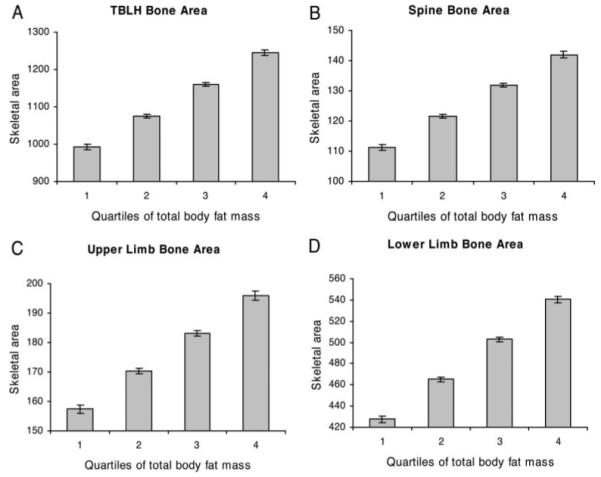
Effect of total-body fat mass on skeletal area adjusted for age at DXA scan, gender, ethnic group, and socioeconomic status. Results show mean ± 95% confidence interval of skeletal area for TBLH (A), spine (B), upper limbs, (C) and lower limbs (D), according to quartile of total-body fat mass in 3082 boys and girls undergoing DXA scans at age 9.9 yr. Test for trend showed statistically significant (P < 0.001) association between fat mass quartile and skeletal area at all four sites.
Analyses were repeated in regression models where fat mass was also adjusted for height and/or lean mass. The relationship between fat mass and TBLH bone area and TBLH BMC was attenuated, particularly when lean mass was included in the model (Table 2). Nevertheless, even when analyses were adjusted for both lean mass and height, a positive association between fat mass and TBLH bone area and BMC persisted. Similar results were obtained after adjusting for both height and height squared (results not shown). This association between fat mass and bone mass showed no evidence of an interaction with puberty. Coefficients were lower in boys compared with Tanner stage 1 girls, but this difference appeared to attenuate with adjustment for lean mass. Analysis of TBLH bone area according to fat mass quartile after adjusting for height and lean mass showed a linear dose-response relationship, albeit with a reduced slope compared with that observed in minimally adjusted analyses (Fig. 3A).
Fig. 3.
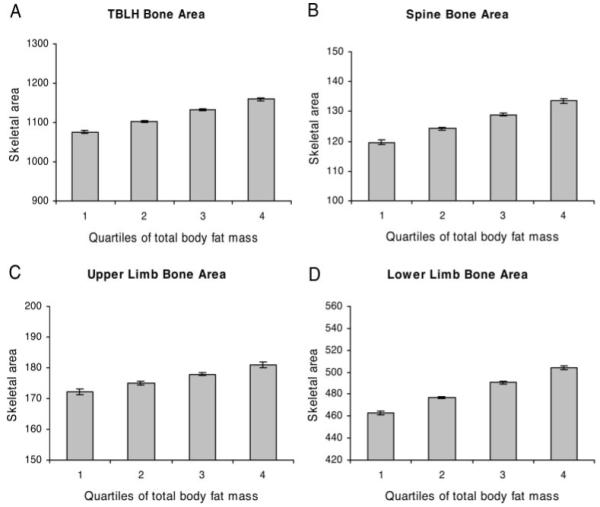
Effect of total-body fat mass on skeletal area adjusted for height, total body lean mass, age at DXA scan, gender, ethnic group, and socioeconomic status. Results show mean ± 95% confidence interval of skeletal area for TBLH (A), spine (B), upper limbs, (C) and lower limbs (D), according to quartile of total-body fat mass in 3082 boys and girls undergoing DXA scans at age 9.9 yr. Test for trend showed statistically significant (P < 0.001) association between fat mass quartile and skeletal area at all four sites.
To determine whether fat mass preferentially influences bone growth at weight-bearing sites, we examined the relationship between fat mass and bone area of the spine and upper and lower limbs. When bone area was examined in relation to quartile of fat mass, an equivalent linear dose-response relationship was observed between fat mass and bone area of the spine and upper and lower limbs to that seen for TBLH, both in minimally adjusted analyses and after adjustment for height and lean mass (Figs. 2 and 3). We also examined whether the relationship between fat mass and bone size is affected by fat mass distribution. A similar relationship was seen between peripheral fat mass and TBLH bone area to that between trunk fat mass and TBLH bone area (results not shown).
We then examined the relationship between total-body fat mass at age 9.9 yr, and TBLH Δbone area over the following 2 yr by comparing DXA scan results obtained at age 9.9 yr with those at age 11.8 yr. In our minimally adjusted model, a strong positive association was observed between fat mass and TBLH Δbone area in boys and girls combined (Table 3). Analysis of TBLH Δbone area according to fat mass quartile revealed a linear dose-response relationship between these two variables (results not shown). An equivalent relationship was observed between fat mass and TBLH ΔBMC to that seen for TBLH Δbone area. In separate analyses of boys and Tanner stage 1, 2, and 3 girls, fat mass was positively related to TBLH Δbone area and ΔBMC in boys and stage 1 girls, but negative associations were observed in Tanner stage 2 and 3 girls. Once again, coefficients were lower in boys compared with Tanner stage 1 girls, but this difference attenuated after adjustment for lean mass.
TABLE 3.
Associations between total-body fat mass at age 9.9 yr and change in (Δ) TBLH BA or TBLH BMC between ages 9.9 and 11.8 yr calculated by multivariable linear regression on 3082 boys and girls
| Variables in regression model | n | Fat mass vs. ΔTBLH bone area |
Fat mass vs. ΔTBLH BMC |
||||
|---|---|---|---|---|---|---|---|
| Coefficient (95% CI) | P value | R2 | Coefficient (95% CI) | P value | R2 | ||
| Model 1: age, ethnicity, and socioeconomic status | |||||||
| Boys and girls | 3082 | 0.120 (0.088-0.151) | <0.001 | 0.275 | 0.157 (0.125-0.188) | <0.001 | 0.288 |
| Boys | 1398 | 0.154 (0.115-0.192) | <0.001 | 0.161 (0.126-0.196) | <0.001 | ||
| Tanner stage 1 girls | 1085 | 0.244 (0.167-0.322) | <0.001 | 0.268 (0.188-0.347) | <0.001 | ||
| Tanner stage 2 girls | 508 | −0.192 (−0.283 to −0.101) | <0.001 | −0.160 (−0.254 to −0.066) | 0.001 | ||
| Tanner stage 3 girls | 91 | −0.303 (−0.455 to −0.151) | <0.001 | −0.220 (−0.376 to −0.063) | 0.006 | ||
| Model 1 and Δheight | |||||||
| Boys and girls | 3082 | 0.098 (0.075-0.122) | <0.001 | 0.560 | 0.135 (0.113-0.156) | <0.001 | 0.613 |
| Boys | 1398 | 0.091 (0.062-0.121) | <0.001 | 0.100 (0.075-0.124) | <0.001 | ||
| Tanner stage 1 girls | 1085 | 0.194 (0.140-0.248) | <0.001 | 0.213 (0.162-0.265) | <0.001 | ||
| Tanner stage 2 girls | 508 | −0.052 (−0.126-0.023) | 0.174 | 0.004 (−0.067-0.075) | 0.918 | ||
| Tanner stage 3 girls | 91 | −0.203 (−0.337 to −0.068) | 0.001 | −0.109 (−0.244-0.025) | 0.110 | ||
| Model 1 and Δlean mass | |||||||
| Boys and girls | 3082 | 0.043 (0.019-0.037) | <0.001 | 0.551 | 0.070 (0.049-0.092) | <0.001 | 0.650 |
| Boys | 1398 | 0.077 (0.045-0.108) | <0.001 | 0.081 (0.055-0.107) | <0.001 | ||
| Tanner stage 1 girls | 1085 | 0.102 (0.048-0.156) | <0.001 | 0.107 (0.059-0.154) | <0.001 | ||
| Tanner stage 2 girls | 508 | −0.079 (−0.156 to −0.002) | 0.043 | −0.014 (−0.083-0.055) | 0.686 | ||
| Tanner stage 3 girls | 91 | −0.234 (−0.371 to −0.097) | 0.001 | −0.140 (−0.274 to −0.005) | 0.042 | ||
| Model 1 and Δheight and Δlean mass | |||||||
| Boys and girls | 3082 | 0.067 (0.044-0.089) | <0.001 | 0.600 | 0.091 (0.072-0.111) | <0.001 | 0.688 |
| Boys | 1398 | 0.078 (0.049-0.106) | <0.001 | 0.082 (0.059-0.105) | <0.001 | ||
| Tanner stage 1 girls | 1085 | 0.134 (0.084-0.184) | <0.001 | 0.136 (0.092-0.180) | <0.001 | ||
| Tanner stage 2 girls | 508 | −0.043 (−0.116-0.030) | 0.247 | 0.019 (−0.046-0.084) | 0.570 | ||
| Tanner stage 3 girls | 91 | −0.201 (−0.334 to −0.067) | 0.004 | −0.107 (−0.238-0.024) | 0.108 | ||
Coefficients with 95% confidence intervals (CI) were calculated for each of the four regression models shown, using standardized continuous variables (minus mean, divided by SD) for fat mass, ΔTBLH bone area, ΔTBLH BMC, Δheight, and Δlean mass. Coefficients are therefore per SD increase in dependent variable. R2 is the adjusted R2 for each model with the boys and girls combined. In the final model for the association between fat mass and ΔTBLH bone area for boys and girls combined, the coefficient for Δheight is 0.420 (95% CI, 0.378-0.462) and for Δlean mass is 0.338 (95% CI, 0.300-0.376). In the final model for the association between fat mass and ΔTBLH BMC, the coefficient for Δheight is 0.365 (95% CI, 0.328-0.402) and for Δlean mass is 0.460 (95% CI, 0.427-0.493).
Subsequently, we investigated the effect of adjustment for change in height and/or lean mass on the relationship between total-body fat mass and TBLH Δbone area and ΔBMC (Table 3). In boys and Tanner stage 1 girls, total-body fat mass at age 9.9 yr was positively related to TBLH Δbone area and ΔBMC after adjusting for change in height and/or lean mass, although regression coefficients were lower than in minimally adjusted analyses. In Tanner stage 2 and 3 girls, the inverse association between fat mass and TBLH Δbone area and ΔBMC in minimally adjusted analyses was attenuated to a greater or lesser extent by adjustment for change in height and/or lean mass. Nevertheless, a strong negative association persisted between fat mass and TBLH Δbone area in Tanner stage 3 girls after adjusting for change in height and/or lean mass.
Statistical analysis confirmed that the association between fat mass and TBLH Δbone area interacted with puberty, both in minimally adjusted analyses and after adjustment for change in height and/or lean mass (likelihood ratio test P value = 0.001). In addition, similar results were obtained using an alternative model to represent change between ages 9.9 and 11.8 yr, in which DXA results at age 11.8 yr were adjusted for DXA measures at age 9.9 yr by linear regression analysis (results not shown). Finally, cross-sectional analyses were performed based on DXA results obtained at age 11.8 yr, which revealed similar relationships between fat mass and TBLH bone area to those seen at age 9.9 yr (results not shown).
Discussion
We found that total-body fat mass is positively related to TBLH bone area independently of lean mass, as assessed in a large population-based cohort of boys and girls aged 9.9 yr. Moreover, in boys and prepubertal girls, fat mass was a positive independent predictor of subsequent gain in bone size over the following 2 yr. Taken together, these observations provide strong evidence that adipose tissue acts to stimulate bone growth in prepubertal children. Because the relationship between fat mass and bone size in models that included lean mass was only minimally affected by additional adjustment for height, our results suggest that fat mass acts to increase bone size by stimulating radial rather than longitudinal bone growth, presumably by increasing the rate of periosteal apposition.
In a recent report based on young adult women (5), fat mass was positively related to areal BMD and BMC independently of lean mass. This observation is consistent with our observation that fat mass is positively related to bone area, in view of the strong positive relationship between bone size and both areal BMD and BMC. On the other hand, several previous investigations have reported reductions in areal BMD, BMC, and/or bone size in obese children after adjusting for lean mass or body weight (8, 10-13). There are two possible explanations for this apparent discrepancy in relation to the present findings. First, because fat mass, lean mass, and skeletal parameters are all highly correlated, large numbers are required to detect independent influences of fat mass on bone size, whereas the majority of previous studies were relatively small and underpowered. Second, several previous studies used methods for adjusting for lean mass that may have limited validity, for example by including weight in the same regression model as fat or lean mass.
Any tendency for fat mass to stimulate radial bone growth is expected to result in a greater long-bone cross-sectional area, which is in turn predicted to improve biomechanical strength. Consequently, the relationship between fat mass and bone size in childhood that we observed might have important implications for the risk of sustaining fragility fractures in later life. At first sight, this conclusion would appear inconsistent with previous reports that obesity is associated with an increased risk of fracture in children (7, 8) and that children with repeated forearm fractures have increased levels of obesity (9). It is possible that these apparently conflicting observations reflect the fact that whereas fat mass generally acts to stimulate periosteal bone growth, there is a subset of children where this response is defective and in whom fracture risk is increased. Hence, bone size relative to fat mass, rather than either of these factors alone, may be the predominant determinant of fracture risk in children. Consistent with this interpretation, in additional studies based on the ALSPAC cohort, TBLH bone area as measured at age 9.9 yr was inversely related to the risk of fracture over the following 2 yr after adjusting for fat mass but not in unadjusted analyses (results not shown). Another explanation may be that although fat mass stimulates periosteal bone growth, obese children are more prone to falls, and there have been reports that obese boys have reduced stability, increased postural sway, and poorer balance compared with nonobese boys (27, 28).
In early pubertal girls, a positive relationship between fat mass and skeletal growth was not seen, and a negative association was observed between these two parameters in Tanner stage 3 girls. This interaction with puberty in girls may reflect an altered effect of fat mass on bone mineral accrual in the presence of rising estrogen levels, through mechanisms that remain to be elucidated. In light of the positive association reported between fat mass and bone mass as measured in young adult women (5), it is possible that our findings represent a transitory alteration in the relationship between fat mass and bone growth during puberty. Because only a very small proportion of boys had entered puberty at the time of baseline assessments, it was not possible to determine whether this apparent reversal of the relationship between fat mass and skeletal growth at the onset of puberty is common to both sexes.
Mechanisms whereby fat mass stimulates periosteal growth include leptin production by adipocytes, in light of evidence that leptin stimulates osteoblast differentiation (29). In support of this possibility, leptin levels have been reported to be positively associated with bone area and change in bone area in girls aged 8-13 yr (30), and in elderly populations, leptin levels were found to be inversely related to fracture risk (31) and positively related to bone mass and bone size (32). On the other hand, leptin has also been reported to act as a negative regulator of bone formation via a central nervous system pathway (33).
Alternatively, fat mass may be a marker of other endocrine factors that affect bone. For example, fat mass in prepubertal children is related to serum levels of IGF-I and estrogen, both of which are known to influence skeletal growth (34). In addition, total fat mass and the proportion of trunk vs. leg fat are greater in girls, presumably because of differences in levels of sex hormones (34). However, because total, trunk, and trunk vs. limb fat mass showed similar associations with bone size, and no interaction was observed with gender, the present study provides no evidence that fat mass is acting as a surrogate marker for endocrine exposure in terms of its effects on bone size. Another mechanism whereby fat mass stimulates periosteal bone formation is via the additional mechanical strain resulting from greater body weight. In support of this possibility, in a recent study of 18-yr-old men, fat mass was positively associated with cross-sectional area of the tibia as measured by pQCT, whereas a negative association was observed at the radius, suggesting that fat mass stimulates periosteal bone formation only at weight-bearing sites (6). However, in this study, fat mass showed a positive association with bone area as measured at age 9.9 yr at the upper as well as lower limb.
Fat mass and skeletal size are related to confounding factors such as socioeconomic factors (24). We attempted to account for these influences by adjusting for certain socioeconomic indicators but cannot exclude residual confounding. Because data were only available for analysis in approximately 30% of the original cohort, our results may be biased because of losses to follow-up. However, this would only have led to a spurious association between fat mass and bone growth if this relationship was different among those children who were lost compared with the remainder of the cohort, which is considered unlikely. Finally, the association between fat mass and height-adjusted bone area, which we interpreted as reflecting an association between fat mass and periosteal bone growth, requires confirmation by additional studies in which cross-sectional area is measured directly using techniques such as pQCT.
In summary, we found that in boys and Tanner stage 1 girls, total-body fat mass at age 9.9 yr is positively related both to TBLH bone area as measured at age 9.9 yr and gain in bone size over the following 2 yr. Because this association persisted after adjusting for both lean mass and height, our findings suggest that fat mass is an important positive independent determinant of periosteal bone formation in prepubertal children. In contrast, a positive relationship between fat mass at age 9.9 yr and subsequent gain in bone size was not observed in Tanner stage 2 and 3 girls, suggesting the onset of puberty leads to attenuation of the tendency for fat mass to stimulate periosteal growth.
Acknowledgments
We are extremely grateful to all the mothers and children who took part and to the midwives for their cooperation and help in recruitment. The whole ALSPAC Study Team comprises interviewers, computer technicians, laboratory technicians, clerical workers, research scientists, volunteers, and managers who continue to make the study possible. This study could not have been undertaken without the financial support of the Medical Research Council, the Wellcome Trust, UK government departments, medical charities, and others. The ALSPAC study is part of the World Health Organization-initiated European Longitudinal Study of Pregnancy and Childhood.
This work was supported by the Wellcome Trust and the Medical Research Council. E.M.C. holds a Wellcome Clinical Research Training Fellowship.
Abbreviations
- ALSPAC
Avon Longitudinal Study of Parents and Children
- BMC
bone mineral content
- BMD
bone mineral density
- DXA
dual-energy x-ray absorptiometry
- pQCT
peripheral quantitative computed tomography
- TBLH
total body less head
References
- 1.Porthouse J, Birks YF, Torgerson DJ, Cockayne S, Puffer S, Watt I. Risk factors for fracture in a UK population: a prospective cohort study. QJM. 2004;97:569–574. doi: 10.1093/qjmed/hch097. [DOI] [PubMed] [Google Scholar]
- 2.Cummings SR, Nevitt MC, Browner WS, Stone K, Fox K, Ensrud KE. Risk factors for hip fracture in white women. N Engl J Med. 1995;332:767–773. doi: 10.1056/NEJM199503233321202. [DOI] [PubMed] [Google Scholar]
- 3.Thomas T, Burguera B. Is leptin the link between fat and bone mass? J Bone Miner Res. 2002;17:1563–1569. doi: 10.1359/jbmr.2002.17.9.1563. [DOI] [PubMed] [Google Scholar]
- 4.Crabtree NJ, Kibirige MS, Fordham JN, Banks LM, Muntoni F, Chinn D, Boivin CM, Shaw NJ. The relationship between lean body mass and bone mineral content in paediatric health and disease. Bone. 2004;35:965–972. doi: 10.1016/j.bone.2004.06.009. [DOI] [PubMed] [Google Scholar]
- 5.Wang MC, Bachrach LK, Van Loan M, Hudes M, Flegal KM, Crawford PB. The relative contributions of lean tissue mass and fat mass to bone density in young women. Bone. 2005;37:474–481. doi: 10.1016/j.bone.2005.04.038. [DOI] [PubMed] [Google Scholar]
- 6.Lorentzon R. Adipose tissue is a negative independent predictor of cortical bone size in non-weight bearing bones in young men; an association mediated by leptin: the GOOD study. J Bone Miner Res. 2005;20(Suppl 1):S13. Abstract. [Google Scholar]
- 7.Goulding A, Jones IE, Taylor RW, Manning PJ, Williams SM. More broken bones: a 4-year double cohort study of young girls with and without distal forearm fractures. J Bone Miner Res. 2000;15:2011–2018. doi: 10.1359/jbmr.2000.15.10.2011. [DOI] [PubMed] [Google Scholar]
- 8.Mobley SL, Ha E, Landoll JD, Badenhop-Stevens NE, Clairmont A, Goel PK, Matkovic V. Children with bone fragility fractures have reduced bone mineral areal density at the forearm and hip and higher percent body fat. J Bone Miner Res. 2005;20(Suppl 1):S34. [Google Scholar]
- 9.Goulding A, Grant AM, Williams SM. Bone and body composition of children and adolescents with repeated forearm fractures. J Bone Miner Res. 2005;20:2090–2096. doi: 10.1359/JBMR.050820. [DOI] [PubMed] [Google Scholar]
- 10.Lazcano-Ponce E, Tamayo J, Cruz-Valdez A, Diaz R, Hernandez B, Del Cueto R, Hernandez-Avila M. Peak bone mineral area density and determinants among females aged 9 to 24 years in Mexico. Osteoporos Int. 2003;14:539–547. doi: 10.1007/s00198-002-1363-2. [DOI] [PubMed] [Google Scholar]
- 11.Skaggs DL, Loro ML, Pitukcheewanont P, Tolo V, Gilsanz V. Increased body weight and decreased radial cross-sectional dimensions in girls with forearm fractures. J Bone Miner Res. 2001;16:1337–1342. doi: 10.1359/jbmr.2001.16.7.1337. [DOI] [PubMed] [Google Scholar]
- 12.Weiler HA, Janzen L, Green K, Grabowski J, Seshia MM, Yuen KC. Percent body fat and bone mass in healthy Canadian females 10 to 19 years of age. Bone. 2000;27:203–207. doi: 10.1016/s8756-3282(00)00314-8. [DOI] [PubMed] [Google Scholar]
- 13.Goulding A, Taylor RW, Jones IE, McAuley KA, Manning PJ, Williams SM. Overweight and obese children have low bone mass and area for their weight. Int J Obes Relat Metab Disord. 2000;24:627–632. doi: 10.1038/sj.ijo.0801207. [DOI] [PubMed] [Google Scholar]
- 14.Petit MA, Beck TJ, Shults J, Zemel BS, Foster BJ, Leonard MB. Proximal femur bone geometry is appropriately adapted to lean mass in overweight children and adolescents. Bone. 2005;36:568–576. doi: 10.1016/j.bone.2004.12.003. [DOI] [PubMed] [Google Scholar]
- 15.Klein KO, Larmore KA, de Lancey E, Brown JM, Considine RV, Hassink SG. Effect of obesity on estradiol level, and its relationship to leptin, bone maturation and BMD in children. J Clin Endocrinol Metab. 1998;83:3469–3475. doi: 10.1210/jcem.83.10.5204. [DOI] [PubMed] [Google Scholar]
- 16.Lorentzon M, Swanson C, Andersson N, Mellstrom D, Ohlsson C. Free testosterone is a positive, whereas free estradiol is a negative, predictor of cortical bone size in young Swedish men: The GOOD Study. J Bone Miner Res. 2005;20:1334–1341. doi: 10.1359/JBMR.050404. [DOI] [PubMed] [Google Scholar]
- 17.Turner CH, Forwood MR, Rho JY, Yoshikawa T. mechanical loading thresholds for lamellar and woven bone formation. J Bone Miner Res. 1994;9:87–97. doi: 10.1002/jbmr.5650090113. [DOI] [PubMed] [Google Scholar]
- 18.Manzoni P, Brambilla P, Pietrobelli A, Beccaria L, Bianchessi A, Mora S, Chiumello G. Influence of body composition on BMC in children and adolescents. Am J Clin Nutr. 1996;64:603–607. doi: 10.1093/ajcn/64.4.603. [DOI] [PubMed] [Google Scholar]
- 19.Fisch RC, Revelle R. Height and weight at menarche and a hypothesis of menarche. Arch Dis Child. 1971;46:695–701. doi: 10.1136/adc.46.249.695. [DOI] [PMC free article] [PubMed] [Google Scholar]
- 20.Marshall WA, Tanner JM. Variations in pattern of pubertal changes in girls. Arch Dis Child. 1969;44:291–303. doi: 10.1136/adc.44.235.291. [DOI] [PMC free article] [PubMed] [Google Scholar]
- 21.Dreizen S, Spirakis CN, Stone RE. A comparison of skeletal growth and maturation in undernourished and well-nourished girls before and after menarche. J Pediatr. 1967;70:256–258. doi: 10.1016/s0022-3476(67)80420-7. [DOI] [PubMed] [Google Scholar]
- 22.Widdowson EM, McCance RA. Some effects of accelerating growth. I. General somatic development. Proc R Soc London B Biol Sci. 1960;152:188–206. doi: 10.1098/rspb.1960.0032. [DOI] [PubMed] [Google Scholar]
- 23.Saggese G, Baroncelli GI, Bertelloni S. Puberty and bone development. Best Pract Res Clin Endocrinol Metab. 2002;16:53–64. doi: 10.1053/beem.2001.0180. [DOI] [PubMed] [Google Scholar]
- 24.Clark EM, Ness A, Tobias JH, the ALSPAC Study Team Social position affects bone mass in childhood through opposing actions on height and weight. J Bone Miner Res. 2005;20:2082–2089. doi: 10.1359/JBMR.050808. [DOI] [PubMed] [Google Scholar]
- 25.Golding J, Pembrey M, Jones R. ALSPAC: The Avon Longitudinal Study of Parents and Children. 1. Study methodology. Paediatr Perinat Epidemiol. 2001;15:74–87. doi: 10.1046/j.1365-3016.2001.00325.x. [DOI] [PubMed] [Google Scholar]
- 26.Taylor A, Konrad PT, Norman ME, Harcke HT. Total body BMD in young children: influence of head BMD. J Bone Miner Res. 1997;12:652–655. doi: 10.1359/jbmr.1997.12.4.652. [DOI] [PubMed] [Google Scholar]
- 27.McGraw B, McClenaghan BA, Williams HG, Dickerson J, Ward DS. Gait and postural stability in obese and non-obese prepubertal boys. Arch Phys Med Rehabil. 2000;81:484–489. doi: 10.1053/mr.2000.3782. [DOI] [PubMed] [Google Scholar]
- 28.Goulding A, Jones IE, Taylor RW, Piggot JM, Taylor D. Dynamic and static tests of balance and postural sway in boys: effects of previous wrist bone fractures and high adiposity. Gait Posture. 2003;17:136–141. doi: 10.1016/s0966-6362(02)00161-3. [DOI] [PubMed] [Google Scholar]
- 29.Thomas T, Gori F, Khosla S, Jensen MD, Burguera B, Riggs BL. Leptin acts on human marrow stromal cells to enhance differentiation to osteoblasts and to inhibit differentiation to adipocytes. Endocrinology. 1999;140:1630–1638. doi: 10.1210/endo.140.4.6637. [DOI] [PubMed] [Google Scholar]
- 30.Matkovic V, Ilich JZ, Skugor M, Badenhop NE, Goel P, Clairmont A, Klisovic D, Nahhas RW, Landoll JD. Leptin is inversely related to age at menarche in human females. J Clin Endocrinol Metab. 1997;82:3239–3245. doi: 10.1210/jcem.82.10.4280. [DOI] [PubMed] [Google Scholar]
- 31.Schett G, Kiechl S, Bonora E, Redlich K, Woloszczuk W, Oberhollenzer F, Jocher J, Dorizzi R, Muggeo M, Smolen J, Willeit J. Serum leptin level and the risk of nontraumatic fracture. Am J Med. 2004;117:952–956. doi: 10.1016/j.amjmed.2004.07.044. [DOI] [PubMed] [Google Scholar]
- 32.Dennison EM, Syddall HE, Fall CH, Javaid MK, Arden NK, Phillips DI, Cooper C. Plasma leptin concentration and change in bone density among elderly men and women: the Hertfordshire Cohort Study. Calcif Tissue Int. 2004;74:401–406. doi: 10.1007/s00223-002-0017-x. [DOI] [PubMed] [Google Scholar]
- 33.Takeda S, Elefteriou F, Levasseur R, Liu X, Zhao L, Parker KL, Armstrong D, Ducy P, Karsenty G. Leptin regulates bone formation via the sympathetic nervous system. Cell. 2002;111:305–317. doi: 10.1016/s0092-8674(02)01049-8. [DOI] [PubMed] [Google Scholar]
- 34.Garnett SP, Hogler W, Blades B, Baur LA, Peat J, Lee J, Cowell CT. Relation between hormones and body composition, including bone, in prepubertal children. Am J Clin Nutr. 2004;80:966–972. doi: 10.1093/ajcn/80.4.966. [DOI] [PubMed] [Google Scholar]