

Abstract
The potential regulation of protein trafficking by calmodulin (CaM) is a novel concept that remains to be substantiated. We proposed that KCNQ2 K+ channel trafficking is regulated by CaM binding to the C-terminal A and B helices. Here we show that the L339R mutation in helix A, which is linked to human benign neonatal convulsions, perturbs CaM binding to KCNQ2 channels and prevents their correct trafficking to the plasma membrane. We used glutathione S-transferase fused to helices A and B to examine the impact of this and other mutations in helix A (I340A, I340E, A343D, and R353G) on the interaction with CaM. The process appears to require at least two steps; the first involves the transient association of CaM with KCNQ2, and in the second, the complex adopts an “active” conformation that is more stable and is that which confers the capacity to exit the endoplasmic reticulum. Significantly, the mutations that we have analyzed mainly affect the stability of the active configuration of the complex, whereas Ca2+ alone appears to affect the initial binding step. The spectrum of responses from this collection of mutants revealed a strong correlation between adopting the active conformation and channel trafficking in mammalian cells. These data are entirely consistent with the concept that CaM bound to KCNQ2 acts as a Ca2+ sensor, conferring Ca2+ dependence to the trafficking of the channel to the plasma membrane and fully explaining the requirement of CaM binding for KCNQ2 function.
M-type channels are generated by the KCNQ (Kv7) family of voltage-gated subtypes (1), and they are found throughout the nervous system where they fulfill dominant roles in the control of excitability and neural discharges (2). Like all Kv channels, the KCNQ α subunits share a common core structure of six transmembrane segments with a voltage sensing domain (S1–S4) and a pore domain (S5 and S6; see Fig. 1) (3). Sequence analysis predicts the presence of four helical regions (A–D) in all family members (4), and helices A and B constitute the binding site for calmodulin (CaM).8 CaM is a prototypical Ca2+ sensor that confers Ca2+ sensitivity to a wide array of proteins, including ion channels (5). CaM is thought to mediate Ca2+-dependent inhibition of KCNQ channels (6), and in addition, we have postulated that a direct association with CaM is required for KCNQ2 channels to exit the endoplasmic reticulum (7).
FIGURE 1.

Topological representation of a KCNQ subunit. The consensus IQ residues are shown in bold. Circles and squares correspond to the residues mutated here (the squares indicate the mutations causing BFNC). The boxes indicate the regions with a high probability of adopting an α helix configuration, and the thick lines delineate the region fused to GST.
To gain a deeper understanding into the involvement of CaM in channel trafficking, we have studied this interaction in vitro with a set of CaM-binding site-specific mutants. Although we had previously explored the impact of some of these mutants on channel trafficking (7), here we have extended this study to the mutant L339R located in helix A. This mutation, as well as the R353G mutation in helix A, has been linked to benign familial neonatal convulsions (BFNC), a human epileptic syndrome of newborn children (2). Accordingly, we demonstrate that there is a strong correlation between the impact of these mutations on the adoption of an “active” conformation by CaM and channel subunit exit from the ER, lending further support to the concept that CaM is a critical regulator for the exit of the channel from the ER.
EXPERIMENTAL PROCEDURES
Molecular Biology
The human KCNQ2 (Y15065) and KCNQ3 (NM004519) cDNAs were kindly provided by T. J. Jentsch (Leibniz-Institut für Molekulare Pharmakologie, Berlin, Germany), and all of the deletions, point mutations, and epitope insertions in KCNQ subunits were constructed by PCR-based mutagenesis. The cDNAs encoding the rat CaM and the Ca2+-independent form of CaM (CaM1234), in which the first aspartate of each EF hand is replaced by alanine, were provided by the group of J. P. Adelman (Vollum Institute, Oregon Health Sciences University, Portland, OR). For immunoprecipitation experiments, the KCNQ2 subunit was tagged at the N terminus with a tandem repeat of five Myc epitopes (MEQKLISEEDLN), whereas the KCNQ3 subunit was tagged with a tandem repeat of two HA epitopes (YPYDVPDYA). All of the constructs were subcloned into pCAGGS (provided by J. C. de la Torre, The Scripps Research Institute, San Diego, CA). For imaging, KCNQ2 was tagged at the N terminus with mCFP in pSRC5, a low copy number vector, and CaM was tagged at the N terminus with YFP and cloned into pCDNA3.1 (Invitrogen). The electrophysiological properties recorded in Xenopus oocytes of tagged KCNQ2 and KCNQ3 constructs were indistinguishable from those of the nontagged equivalents. The Tac-CFP construct was generated using the Tac receptor provided by Dr. Steve Standley (Laboratory of Neurochemistry, NIDCD, National Institutes of Health, Bethesda, MD), which was cloned into a modified version of the expression vector pEGFP (Clontech) where the eGFP has been exchanged by mCFP. The ER marker pDsRed2-ER was obtained from Clontech.
GST Fusion Protein Production
The Gly310–Leu548 region of KCNQ2 (WT and the I340E, I340A, A343D, L339R, and R353G mutants), neurogranin (amino acids 1–78, NP006167), and the C terminus of the NR1a NMDA receptor (amino acids 818–922; NP015566) were subcloned into the pGEX-3X GST fusion vector (Pharmacia). The expression of these fusion proteins in transformed BL21 DE3 bacteria was induced with 0.3 mm of isopropyl-β-d-thiogalactopyranoside for 3 h at 30 °C. The pellet was resuspended in 20 ml of chilled GST buffer that included protease inhibitors (20 mm Tris-HCl, pH 7.4, 100 mm NaCl, 0.5% Triton, 2 mm dithiothreitol, plus half tablet of protease inhibitor mixture; 1× Complete; Roche Applied Science). The resuspended pellet was sonicated at 4 °C and centrifuged at 30,000 rpm (80,000 × g) for 30 min at 4 °C with a TFT 50.38 rotor (Beckman Coulter). Finally, the supernatant was transferred to a fresh tube, whereas the insoluble cell lysate (inclusion bodies) was treated separately.
The initial experiments were performed with proteins purified from the soluble fraction to assure that they were properly folded. In latter experiments, the fusion proteins were solubilized from inclusion bodies with 6 m urea and then refolded. The results obtained with these proteins were indistinguishable from the soluble material.
Refolding and Purification of GST Fusions from Inclusion Bodies
The insoluble cell lysates (inclusion bodies) isolated by centrifugation were suspended three times in 10 ml of the same buffer used for sonication, and they were centrifuged to remove any remaining soluble material. The precipitate was dissolved for 30 min at 4 °C in 5 ml of 20 mm Tris-HCl, 100 mm NaCl, 2 mm dithiothreitol, and 6 m urea (pH 7.4), mixing occasionally. The solution was centrifuged at 20,000 × g for 20 min at 4 °C, and the supernatant was diluted 2-fold with 20 mm Tris-HCl (pH 7.4). The diluted supernatant was centrifuged, and the new supernatant was dialyzed for 14 h against 2 liters of 20 mm Tris-HCl, 100 mm NaCl, 5 mm dithiothreitol, 1 m urea, pH 7.4, and for 10 h against the same buffer without urea. The protein concentration was determined using the Bradford method.
Dispersion of the samples was evaluated by dynamic light scattering using a Zetasizer Nano instrument (Malvern Instruments Ltd.) to exclude the presence of aggregates. The correlation function and the polydispersity index (less than 0.2) demonstrated that the proteins were monodispersed, and no aggregates were found.
Calmodulin Purification and Dansylation
Recombinant rat brain calmodulin was produced in BL21 DE3 bacteria, purified, and dansylated as described (4). Briefly, CaM (100 μl at 10 mg/ml) was diluted 10-fold in 100 mm Tris-HCl, 20 mm CaCl2, pH 8.5. Dansyl chloride dissolved in acetone (2.17 mg/ml) was added (12.5 μl) to a final concentration of 100 μm, and the mixture was incubated at room temperature in the dark for 2 h, vortexing every 20 min. Unincorporated dansyl was eliminated using a 1-ml G-25 Sepharose column.
Fluorescence Spectroscopy
EGTA was added to dansyl-calmodulin (D-CaM) to a final concentration of 500 mm to facilitate the elimination of Ca2+. D-CaM and GST-KCNQ2 fusion proteins were dialyzed against 2 liters of buffer containing 25 mm Tris-HCl, 120 mm KCl, 5 mm NaCl, 2 mm MgCl2 (pH 7.4) for 48 h, changing the buffer every 10–12 h. The levels of contaminant Ca2+ in the D-CaM preparations were determined by inductively coupled plasma mass spectroscopy at the Department of Analytical Chemistry (University of the Basque Country), and they were found to be less than 40 nm. The concentration of D-CaM used was 12.5 nm. The fluorescence emission spectrum was obtained with an Aminco Bowman series 2 (SLM Aminco) fluorescence spectrophotometer in a final volume of 1 ml or 100 μl (using quartz cuvette) at 25 °C. The excitation wavelength was 340 nm, and emissions were registered from 400 to 660 nm.
For the titration experiment, increasing concentrations of each GST‘ protein were added to a cuvette containing D-CaM alone (in the presence of EGTA 10 mm) or in the presence of excess of calcium (by adding 5.1 mm Ca2+ to give a concentration of 1.6 μm free Ca2+) in D-CaM binding buffer (25 mm Tris-HCl, 120 mm KCl, 5 mm NaCl, 2 mm MgCl2, 10 mm EGTA, pH 7.4).
Antibodies
The primary antibodies used were: mouse polyclonal anti-Myc (9E10; a gift of Dr. Sebastian Pons, Instituto de Investigaciones Biomédicas de Barcelona, Spain); rat monoclonal anti-HA (3F10; Roche Applied Science); mouse monoclonal anti-CaM (Upstate Biotechnology); rabbit anti-cAMP-responsive element-binding protein-binding protein (Upstate Biotechnology); mouse monoclonal anti-GFP (clones 7.1 and 13.1; Roche Applied Science); or a mouse monoclonal anti-α tubulin (DM1A; Sigma). The peroxidase-coupled secondary antibodies used were raised against mouse IgG (Bio-Rad), rat IgG, or rabbit IgG (Jackson Immunoresearch).
Electrophysiological Measurements
Standard two-electrode voltage clamp procedures were employed to record currents from Xenopus oocytes (8). Three days after mRNA injection, whole cell currents were recorded in oocytes at room temperature (∼22 °C) using a virtual ground two-electrode voltage clamp Geneclamp 500B amplifier (Axon Instruments, Foster City, CA). Borosilicate electrodes were filled with 3 m KCl and had resistances of ∼1 MΩ. The oocytes were continuously perfused with Xenopus saline containing 100 mm NaCl, 2.5 mm KCl, 1 mm MgCl2, 2 mm MnCl2, and 5 mm HEPES, pH 7.5. The data were acquired at a sampling rate of 1 KHz and filtered at 100 Hz; voltage step protocols, and current analyses were performed with pCLAMP 8.1 software (Axon Instruments). The current values represent the averages (±S.E.) of the maximal conductance obtained from the fit of the γ-V relationship to a Boltzmann equation,
where Gmax = Imax/(Vstep − Vrev), Imax is the maximal current, Vrev is the reversal potential (−87.3 ± 0.34 mV, in our recording conditions; n = 387), γ is the tail current amplitude in a 800-ms voltage step to −20 mV (Vstep) elicited after 800-ms depolarizing voltage pulses from −120 to +50 mV in 10 mV increments (Vm) evoked every 20 s, and V½ is the membrane potential at which the current is half of Imax. To obtain the absolute amplitude, the tail current values were subtracted from the amplitude of the tail current preceded by a voltage step to −120 mV. The Gmax value was normalized to the averaged Gmax obtained the same day using five or more oocytes expressing KCNQ2/KCNQ3 heteromers. The data were normalized in Excel and plotted in Sigmaplot.
Surface Expression
A KCNQ3 subunit tagged with an HA epitope in the extracellular loop connecting transmembrane domains S1 and S2 was used for the single oocyte chemiluminescent assay (8).
Cell Culture and Transfection
HEK293T cells were maintained in Dulbecco's modified Eagle's medium supplemented with 10% fetal bovine serum at 37 °C in 5% CO2. The cells were transiently transfected with cDNAs using a calcium phosphate protocol, and the constructs expressed were analyzed 24–36 h after transfection.
Immunoprecipitation
One day after transfection, HEK293T cells were solubilized for 30 min at 4 °C in immunoprecipitation buffer containing 50 mm Tris-HCl, 150 mm NaCl, 1% Triton X-100, 2 mm EDTA, 5 mm EGTA, pH 7.5, and protease inhibitors (1× Complete; Roche Applied Science). The nuclei were pelleted at 500 × g for 3 min, and the insoluble material was removed after centrifugation at 11,000 × g for 20 min. The lysates were precleared with 40 μl of equilibrated protein A-Sepharose beads (Sigma P3391) for 1 h at 4 °C. Anti-Myc antibodies were immobilized with 40 μl of equilibrated protein A beads overnight at 4 °C and washed twice with immunoprecipitation buffer. Precleared lysates were incubated with protein A-anti-Myc for 4 h at 4 °C, and after four washes with immunoprecipitation buffer, the immunoprecipitated proteins were released by heating at 90 °C 5 min in SDS sample buffer.
Glycosylation
The chimeric Tac-AB-CFP protein was constructed by ligating a KCNQ2 fragment containing the CaM-binding domain (from amino acids Gly310 to Leu548) previously amplified by PCR into the Tac-CFP plasmid. HEK293T cells were transfected by the calcium phosphate precipitation method with 1 μg of DNA/M6 well, and expression of the fusion proteins was analyzed 36 h after transfection. The cells were removed from the plates, pelleted by centrifugation, lysed with 5× SDS-PAGE sample buffer, and boiled before analyzing by SDS-PAGE. The proteins were resolved on a 10% SDS-PAGE gel and transferred to polyvinylidene difluoride membranes. The membranes were blocked with 3% (w/v) bovine serum albumin (A4503; Sigma) in phosphate-buffered saline containing 0.05% Tween 20 for 1 h at room temperature, incubated for 1 h at room temperature with an anti-GFP primary antibody diluted 1:1,000 (Roche Applied Science) that was visualized with a secondary anti-mouse antibody conjugated to peroxidase diluted 1:5,000 in phosphate-buffered saline containing 0.05% Tween 20.
Image Acquisition and Analysis
The HEK293T cells were washed with phosphate-buffered saline for 24 h after transfection using calcium phosphate, and they were then fixed in freshly diluted 3.5% paraformaldehyde (Sigma) for 20 min. Co-localization experiments were performed using a Nikon TE2000-U microscope (Melville, NY) equipped for epifluorescence and with a Nikon D-eclipse C1 Si confocal spectral detector, using a 60×, 1.45 numerical aperture, oil immersion objective. The fluorescent proteins were excited using a 437-nm laser line, and 32 images were acquired simultaneously at different emission wavelengths between 450 and 610 nm at 5-nm intervals. For each cell, ten optical sections (approximately 0.6 μm thick) were acquired using a 30-μm-diameter pinhole, and cells with similar levels of expression (as judged by their brightness) were selected for analysis. The signal from each fluorophore was isolated by performing spectral unmixing with EZ C1 3.00 software (Nikon). The reference spectra were acquired from cells expressing mCFP-KCNQ2, pDsRed2-ER, or YFP-tagged constructs alone. Each image was analyzed for co-localization using ImageJ software (version WCIF; National Institutes of Health), using the plug-in to calculate the Manders' coefficient (9). The images were converted to 8-bits, the background was automatically subtracted, and both the brightness and contrast were adjusted. The perimeter of the cell was drawn manually for analysis.
RESULTS
The induction of conformational changes to 12.5 nm D-CaM was studied in vitro using GST fusion proteins containing helices A and B of KCNQ2 (GST-Q2AB; Figs. 1 and 2). The impact of several mutations in helix A of KCNQ2 was examined, including two that cause BFNC in humans (L339R and R353G) (10, 11). Virtually no difference in fluorescence was observed when the interaction between D-CaM and the reference A343D and I340E mutants was assayed, although the two mutants linked to BFNC and the I340A mutant produced a moderate effect on the maximal fluorescence emission (Fig. 2 and Table 1). These results indicate that CaM adopted at least three configurations in the absence of Ca2+: free CaM, CaM-Q2AB, and CaM-Q2AB*.
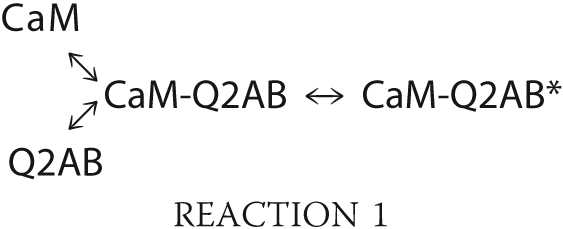 |
These results may be explained if the transition rate from free-CaM to CaM-Q2AB depends on the concentration of Q2AB, whereas the complex CaM-Q2AB undergoes an intramolecular rearrangement to adopt the active configuration CaM-Q2AB*, which displays stronger fluorescent emission. In this simple model, the intramolecular transition from CaM-Q2AB to CaM-Q2AB* does not depend on the concentration of the Q2AB protein.
FIGURE 2.

Mutations in helix A of the KCNQ2 binding site affect the maximal D-CaM fluorescence emission. A, emission spectra of 12.5 nm D-CaM in the presence of 1.6 μm free Ca2+ (dotted lines) and in the absence of Ca2+ (solid lines; 10 mm EGTA added), as well as in the presence (bold traces) and absence (light traces) of the GST-Q2AB fusion protein (200 nm). B, relative concentration-dependent enhancement of 12.5 nm D-CaM fluorescence by the indicated GST-Q2AB proteins in the presence and absence (filled circles) of 1.6 μm Ca2+ (open circles). The parameters used to fit a Hill equation to the data (continuous and dashed lines) can be found in Table 1. The data represent the means ± S.E. from three or more independent experiments. The error bars are smaller than the symbols.
TABLE 1.
Binding parameters obtained using 12.5 nm D-CaM after fitting a Hill equation to the data in Fig. 2
h, Hill coefficient; n, number of independent experiments; ND, not determined.
| Fusion protein | −Ca2+ (10 mm EGTA) |
+Ca2+ (1.6 μm) |
||||
|---|---|---|---|---|---|---|
| Maximal relative fluorescence increase | EC50 (ratio GST/CaM) | h (n) | Maximal relative fluorescence increase | EC50 (ratio GST/CaM) | h (n) | |
| Q2 WT | 102 ± 1.0 | 1.0 ± 0.02 | 1.6 ± 0.3 (6) | 98 ± 0.3a | 2.1 ± 0.01 | 3.4 ± 0.5 (5) |
| Q2 R353G | 41 ± 0.3 | 1.3 ± 0.04b | 3.0 ± 0.6 (5) | 42 ± 0.1c | 2.0 ± 0.01b | 2.4 ± 0.1 (4) |
| Q2 L339R | 28 ± 0.2 | 1.4 ± 0.03b | 1.9 ± 0.8 (5) | 26 ± 0.1d | 1.5 ± 0.01b | 2.0 ± 0.1 (4) |
| Q2 I340A | 19 ± 0.4 | 2.5 ± 0.02b | 2.7 ± 0.3 (4) | 15 ± 0.0d | 3.9 ± 0.04b | 3.0 ± 0.5 (4) |
| Q2 A343D | 6 ± 0.1 | ND | ND (3) | 6 ± 0.1 | ND | ND (3) |
| Q2 I340E | 3 ± 0.0 | ND | ND (3) | 2 ± 0.1 | ND | ND (3) |
ap < 0.05.
b p < 0.001 versus WT EC50, unpaired t test.
c p < 0.01.
d p < 0.001 maximal fluorescence versus absence of Ca2+.
The results indicated that the main consequence of the mutations was a destabilization of the active CaM-Q2AB* conformation. Nevertheless, the relative maximal changes in fluorescent emission were similar in the presence and absence of Ca2+ for all the proteins tested (Table 1). Thus, Ca2+ had little influence on the intramolecular transitions to and from the Ca2+-CaM-Q2AB* conformation, but rather it affected the binding of the peptide (i.e. the first transition), causing a change in the EC50 (note that Ca2+-CaM-Q2AB* and CaM-Q2AB* represent different conformations of the complex).
This model predicts that binding to CaM can take place even if it does not lead to an active configuration being adopted (that causes an enhancement in D-CaM fluorescence emission). We devised a competition assay to test this prediction for the A343D mutant, which barely produces an effect on D-CaM (Table 1). The basis of this assay is that the A343D mutant may displace D-CaM bound to a target peptide, leading to a reduction in fluorescence.
We used two unrelated CaM target proteins as reporters of the interaction in the presence (NR1a) or absence (neurogranin) of Ca2+ (4). A complex of D-CaM (12.5 nm) with the C terminus of the NR1a receptor fused to GST was established in the presence of 1.6 μm free Ca2+, and the effects of introducing 50 nm of the mutant protein were assessed. To make the assay more sensitive, we chose to use the concentration of GST-NR1a that produced 50% of the effect, and hence, 8.75 nm of GST-NR1a was used. To test for competition in the absence of Ca2+, GST fused to neurogranin was used because only a weak signal was obtained with GST-NR1a under these conditions. The concentration of GST-neurogranin that caused 50% enhancement in D-CaM fluorescence was found to be 30 nm. These experiments showed that the mutant displaced D-CaM from the wild type binding site (Fig. 3), both in the presence and the absence of Ca2+. Thus, the results obtained with the A343D presented in Figs. 2B and 3 are consistent with the existence of an “inactive” CaM-peptide intermediate.
FIGURE 3.

The A343D mutant displaces D-CaM from the NR1a receptor-binding site (fused to the C0C1C2 C-terminal region of the NR1 NMDA receptor, amino acids 818–922) and from the neurogranin-binding site (Nrg, amino acids 1–78). The relative effect of 50 nm GST and GST-Q2 A343D on the relative fluorescence emission from 12.5 nm D-CaM complexed with GST-Nrg (taken as 100%) in the absence of Ca2+ (filled bars) and GST-NR1a in the presence of 1.6 μm free Ca2+ (empty bars, n = 3) is shown. To make the assay more sensitive, the concentrations of GST-Nrg and GST-NR1a that caused 50% of the maximal increase in D-CaM fluorescence emission were employed (30 and 8.75 nm in the absence -Nrg- and presence -NR1a- of Ca2+, respectively). The small effect observed after the addition of 50 nm GST was due to the dilution of the sample.
Having an array of mutants that covers a wide range of responses provided us with the opportunity to ask how the in vitro behavior of D-CaM correlates with the proposed role of CaM in channel trafficking. To answer this question, we first characterized the BFNC-causing L339R mutant. To compare this mutant with the data reported for the other mutants (7), we subjected L339R to a battery of assays, including electrophysiology, co-immunoprecipitation, surface expression, and co-localization with an ER marker (Fig. 4).
FIGURE 4.

Characterization of the BFNC causing L339R mutant. A, top panel, representative current trace from Xenopus oocytes injected with a 1:1 ratio of cRNAs for KCNQ3 and KCNQ2-L339R. The dotted line is a reference current trace from oocytes expressing wild type channels. The voltage protocol is depicted in the inset. Bottom panel, averaged maximal current (gray box, n ≥ 5) and the relative surface expression of KCNQ3-HA (hatched boxes, n ≥ 11). The values given are the means (±S.E.) normalized to values obtained from WT-KCNQ2/KCNQ3 or WT-KCNQ2/KCNQ3-HA channels from the same batch. B, protein complexes from HEK293T cells expressing YFP-tagged CaM and Myc-tagged KCNQ2 subunits were immunoprecipitated (IP) with an anti-Myc antibody. The YFP-CaM bands revealed with an anti-CaM antibody are indicated by arrows, and the heavy chain of the anti-Myc antibody is labeled with an asterisk. Bottom panel, densitometric quantification of CaM (CaM band density/KCNQ2 band density; n = 2). Similar results were obtained when endogenous CaM was co-immunoprecipitated (see supplemental Fig. S1 and Ref. 7). C, co-immunoprecipitation of HA-tagged KCNQ3 and YFP-tagged CaM assembled with Myc-tagged KCNQ2. The anti-Myc antibody was used to immunoprecipitate proteins from HEK293T cells expressing the constructs indicated, and the proteins were detected with anti-Myc, anti-HA, or anti-CaM antibodies. The asterisk represents the heavy chain of the primary antibody. Right lane, molecular weight marker. Bottom panel, densitometric quantification of YFP-CaM (n = 3). D, the confocal images of HEK293T cells co-transfected with the mCFP-tagged KCNQ2 L339R and with an ER marker were processed as described under “Experimental Procedures” (n ≥ 10). The KCNQ2 subunits and the ER marker were pseudo-colored in green and red, respectively, producing a yellow color upon co-localization. Middle panel, effect of elevated CaM expression. Right panel, effect of elevated expression of a Ca2+ binding incompetent CaM mutant (CaM1234). The bar represents 10 μm. E, Western blot probed with an anti-GFP antibody of HEK293T cell extracts expressing the indicated Tac chimeras (n = 3). The upper bands represent immature (*) and mature (**) Tac chimeras. The mature band indicates a complex glycosylation state acquired after processing in the Golgi system.
When expressed in heterologous systems, homomeric KCNQ2 subunits yield very small currents. However, both the current and their surface expression increase when KCNQ2 and KCNQ3 are co-expressed in a manner that is dependent on the heteromerization of the intracellular C-terminal region (8, 12). Thus, to be able to compare the data with that published previously, we assessed the functional consequences of this mutation when co-expressed with KCNQ3 subunits in Xenopus oocytes, resulting in a >80% reduction in the current and surface expression (Fig. 4A). Co-immunoprecipitation experiments revealed that the amount of CaM associated with KCNQ2-L339R was diminished in both homomeric KCNQ2 (Fig. 4B and supplemental Fig. S1) and heteromeric KCNQ2/KCNQ3 channels (Fig. 4C).
To monitor the intracellular distribution of the channels, the subunits were tagged at the N terminus with the blue emitting fluorescent protein mCFP, and they were co-expressed in HEK293T cells with a red emitting fluorescent ER marker. To compare the extent of co-localization quantitatively, 32 confocal images were acquired simultaneously at different wavelengths and subjected to spectral unmixing (to separate the emission of one fluorophore from another), followed by a pixel to pixel comparison of the mCFP and dsRed images (9). In addition, CaM was overexpressed with the intention of obtaining the maximal CaM mediated effect, whereas in another set of experiments, a CaM mutant unable to bind Ca2+ (CaM1234) was overexpressed to assess the role of this cation.
We have previously assessed the extent to which the WT channel and the I340A and R353G mutants co-localize (7). The data from these mutants and from the L339R mutant were collected and plotted against the increase in D-CaM fluorescence. This analysis demonstrated a remarkable correlation between the extent of ER co-localization and D-CaM fluorescence emission (Fig. 5), suggesting that adopting the active CaM-Q2AB* and Ca2+-CaM-Q2AB* configurations are rate-limiting for homomeric KCNQ2 channels to exit the ER. In addition, more co-localization (i.e. greater retention in the ER) was evident for all of the mutants when CaM1234 was overexpressed, maintaining a linear correlation (Fig. 5) and suggesting that Ca2+ binding facilitates exit from the ER.
FIGURE 5.

Relationship of the in vitro maximal D-CaM fluorescence emission with trafficking parameters. A, plot of the Manders' index of ER co-localization from cells overexpressing CaM (open circles) or CaM1234 (filled circles) and different KCNQ2 mutants (from left to right, WT, R353G, L339R, and I340E). The co-localization indices for WT, R353, and I340E were taken from Ref. 7. The continuous lines are the results of a linear regression fit to the data. For CaM the parameters of the fit were: intercept, 296.9 ± 38.9; slope, −325.5 ± 49.5 (r2 = 0.96). For CaM1234 the parameters of the fit were: intercept, 653.6 ± 24.2; slope, −686.6 ± 17.8 (r2 = 0.88). B, plot of the glycosylation index of the Tac-AB proteins (from left to right: I340E, L339R, R353G, and WT) versus D-CaM fluorescence. The glycosylation index used was the average ratio of the optical density values (mature OD/[immature OD + mature OD]; see Fig. 3E). For CaM the parameters of the fit were: intercept, −80.5 ± 9.6; slope, 4.3 ± 0.3 (r2 = 0.99). For CaM1234 the parameters of the fit were: intercept, −135.5 ± 20.3; slope, 6.8 ± 0.8 (r2 = 0.97). C, the relationship between D-CaM emission and surface expression (filled circles), and the current (empty circles) of heteromeric KCNQ2/KCNQ3 channels expressed in Xenopus oocytes. The lines are the result of the best fit of a transfer function to the data (continuous line, surface expression; dotted line, current). This function has no mechanistic implications, and its purpose is to facilitate the comparison with other sets of data. The function is y = ax/(b + x), where y is fluorescence emission, and x is current or surface expression. The parameters for surface expression were: a = 142.0 ± 22.7, b = 0.42 ± 0.15 (r2 = 0.96), current: a = 133.5 ± 15.5, b = 0.34 ± 0.10 (r2 = 0.98). Small changes in D-CaM emission are reflected by large changes in the number of functional channels at the plasma membrane.
To study the entry into the Golgi apparatus, helices A and B were fused at the intracellular C terminus of the single transmembrane protein, the interleukin-2 receptor α subunit (Tac). Tac harbors two N-glycosylation sites that are processed in the Golgi apparatus, thereby producing more complex forms with substantial differences in molecular weight (13). In addition, when monitoring the transit to the Golgi compartment, the use of the Tac reporter protein simplifies the interpretation of the results because this protein is monomeric, and therefore the results obtained are independent of the possible impact of subunit assembly.
When helices AB from KCNQ2 were attached after the transmembrane domain of a Tac-CFP chimera, a high molecular weight band that corresponded to the mature glycosylated protein was observed. The extent of glycosylation was quantified as described previously (7), and the correlation between D-CaM fluorescence emission and the mature glycosylation of the different constructs was again remarkable. However, in contrast to the clear effect of the complete channel on ER co-localization, there was no significant impact of CaM1234 overexpression on the glycosylation of the Tac-Q2AB mutants. A small but significant reduction (22%) was only detected for the wild type Tac-Q2AB protein. These contrasting results suggested that the Ca2+-dependent regulation of CaM-mediated ER exit may depend on the context in which the helices AB reside. That is, the helices may confer greater Ca2+ dependence to the channel subunit than to the Tac protein.
The relationship between D-CaM fluorescent emission and surface expression or ionic current from heteromeric KCNQ2/KCNQ3 channels expressed in oocytes showed that small reductions in D-CaM fluorescence emission corresponded to a large reduction in the number of functional channels (Fig. 5C). The interpolation of the data using a hyperbolic transfer function revealed that a 20% reduction in maximal D-CaM fluorescence translated into a 50% reduction in the number of channels at the plasma membrane. Conversely, an 80% reduction in the number of channels corresponded to halving the maximal D-CaM emission.
DISCUSSION
The in vitro behavior of the recombinant KCNQ2 CaM-binding site corresponds beautifully with the ER retention observed with the complete channel expressed in a mammalian cell line. Thus, the intrinsic properties of the CaM-KCNQ2 interaction appear to govern the exit from the ER of homomeric KCNQ2 channels. These data imply that CaM binding is a requisite for ER exit but that binding is not sufficient for this event to occur. For instance, the A343D mutant binds CaM, but it does not reach the plasma membrane. The key to this process is the adoption of a novel active conformation that stabilizes the complex. Indeed, the BFNC mutants L339R and R353G and the remaining helix A mutants destabilize this active configuration.
There are contrasting reports on the Ca2+ dependence of the interaction with KCNQ channels; although it has been suggested that such interactions are independent of Ca2+, there is also evidence that the interaction is stronger in the presence or the absence of Ca2+ (4, 14, 15). This apparent controversy is at least in part likely to reflect the inherent limitations of the different methods used to study the association of KCNQ channels with CaM. To clarify this important issue, we have studied the interaction in vitro using a robust and sensitive fluorescent assay under conditions that provide tight control of the free Ca2+ concentration. Our results clearly show that Ca2+ destabilizes the interaction of the KCNQ2-binding site with CaM. As a consequence, Ca2+ binding to CaM is weaker when CaM is complexed to the KCNQ channel binding site.
Strong Ca2+ dependence was recently suggested for the interaction between CaM and KCNQ2 channels in living cells, and a robust interaction with CaM1234 was demonstrated, indicating that the interaction between KCNQ2 and CaM is likely to have Ca2+-dependent and Ca2+-independent components (15). We show here that ER retention is increased by heterologous expression of CaM1234, which presumably displaces endogenous CaM and makes the complex Ca2+ insensitive. This is entirely consistent with the hypothesis that CaM bound to the channel acts as a Ca2+ sensor, conferring Ca2+ dependence to the trafficking of the channel to the plasma membrane and fully explaining the requirement of CaM binding for KCNQ2/3 function. Future experiments will address the influence of intracellular Ca2+ levels on surface expression and ER retention.
Our results are in sharp contrast with those suggesting that CaM binding is not required for mouse KCNQ2 subunits to traffic to the membrane (14). The amino acid sequence of murine KCNQ2 has two insertions when compared with the human subunit used in the present study, one of 10 amino acids (exon 8) and another one of 18 amino acids (exon 11), which may account for the differences observed. This opens the intriguing possibility that alternative splicing could influence how CaM regulates channel trafficking. On the other hand, the evidence currently available does not indicate whether CaM must remain bound when the channel reaches the plasma membrane for the channel to be functional. Hence, the concept that CaM is an auxiliary subunit of KCNQ2/3 channels (14) should perhaps be treated with certain reservation until more convincing evidence is presented.
CaM regulates the trafficking of SK K+ channels by affecting the assembly of subunits (16, 17). For KCNQ2, a different mechanism applies because the impact of helices AB on trafficking can be transplanted to a monomeric protein, indicating that this regulation does not require subunit assembly. This is not to say that assembly has no influence on the CaM-mediated regulation of trafficking. The reduced effect of CaM1234 on Tac-Q2AB trafficking indicates that the full Ca2+-dependent response is modulated by other regions of the channel. In other words, the impact of CaM on trafficking mediated by helix AB depends primarily on CaM binding and then on its subsequent “activation.” Thus, other regions of the channel may assist in the transduction of the Ca2+-dependent rearrangement into a more efficient exit from the ER.
The relationship between D-CaM fluorescent emission and ionic current or surface expression of heteromeric KCNQ2/KCNQ3 channels expressed in oocytes was not linear. This was expected for two reasons. On the one hand, the KCNQ3 subunit can bind CaM, such that there are at least two intact CaM-binding sites available in the heterotetramers. On the other hand, heteromerization causes an increase in surface expression that is dependent on the assembly domain formed by helices C and D (3, 18). It is important to note that small changes in adopting the active configuration translate into a large reduction in the number of functional channels at the plasma membrane. Thus, the effect of CaM appears to be amplified by other processes, and any regulation on the efficiency to adopt the active conformations will have a profound effect on the M-current.
We have summarized our current hypothesis regarding CaM regulation of KCNQ2 trafficking in Fig. 6. In the absence of Ca2+, CaM binds transiently to helices A and B of KCNQ2, which undergoes a conformational change that stabilizes the complex and that partly conceals retention/retrieval signals, thereby facilitating the translocation of the channel to the plasma membrane. Ca2+ binding triggers a rearrangement of CaM that masks additional retention/retrieval signals that may be present in other regions of the channel. In the monomeric Tac protein, these additional retention signals may not be present or are not functional, and the conformational change triggered by Ca2+ barely improves ER exit.
FIGURE 6.

Model of Ca2+-CaM regulation of KCNQ2 trafficking. At resting intracellular Ca2+ concentrations, CaM binds to helices A and B of KCNQ2, and subsequently, it suffers a conformational change that stabilizes the complex and conceals the retention/retrieval signals within the binding site, thereby facilitating the exit of the channel from the ER. Subsequent Ca2+ binding triggers an additional conformational change that allows CaM to occlude other retention/retrieval signals located at the binding site or elsewhere, further facilitating the translocation of the channel to the plasma membrane.
Supplementary Material
Acknowledgment
We thank Mark Sefton for comments and editorial assistance with the manuscript.
This work was supported by Grant PI071316 from the VII European Framework Program, Spanish Ministry of Education Grant SAF2006-13450, and Consolider Project Grant CSD2008-00005.

The on-line version of this article (available at http://www.jbc.org) contains supplemental Fig. S1.
- CaM
- calmodulin
- dansyl
- 5-dimethylaminonaphthalene-1-sulfonyl
- D-CaM
- dansyl-calmodulin
- BFNC
- benign familial neonatal convulsions
- Q2
- KCNQ2
- ER
- endoplasmic reticulum
- Nrg
- neurogranin
- NR1a
- NMDA receptor subunit 1a
- GST
- glutathione S-transferase
- HA
- hemagglutinin
- GFP
- green fluorescent protein
- YFP
- yellow fluorescent protein
- CFP
- cyan fluorescent protein
- WT
- wild type.
REFERENCES
- 1.Wang H. S., Pan Z., Shi W., Brown B. S., Wymore R. S., Cohen I. S., Dixon J. E., McKinnon D. (1998) Science 282, 1890–1893 [DOI] [PubMed] [Google Scholar]
- 2.Jentsch T. J. (2000) Nat. Rev. Neurosci. 1, 21–30 [DOI] [PubMed] [Google Scholar]
- 3.Haitin Y., Attali B. (2008) J. Physiol 586, 1803–1810 [DOI] [PMC free article] [PubMed] [Google Scholar]
- 4.Yus-Nájera E., Santana-Castro I., Villarroel A. (2002) J. Biol. Chem. 277, 28545–28553 [DOI] [PubMed] [Google Scholar]
- 5.Saimi Y., Kung C. (2002) Annu. Rev. Physiol. 64, 289–311 [DOI] [PubMed] [Google Scholar]
- 6.Gamper N., Shapiro M. S. (2003) J. Gen. Physiol. 122, 17–31 [DOI] [PMC free article] [PubMed] [Google Scholar]
- 7.Etxeberria A., Aivar P., Rodriguez-Alfaro J. A., Alaimo A., Villacé P., Gómez-Posada J. C., Areso P., Villarroel A. (2008) FASEB J. 22, 1135–1143 [DOI] [PubMed] [Google Scholar]
- 8.Etxeberria A., Santana-Castro I., Regalado M. P., Aivar P., Villarroel A. (2004) J. Neurosci. 24, 9146–9152 [DOI] [PMC free article] [PubMed] [Google Scholar]
- 9.Manders E. M., Stap J., Brakenhoff G. J., van Driel R., Aten J. A. (1992) J. Cell Sci. 103, 857–862 [DOI] [PubMed] [Google Scholar]
- 10.Moulard B., Picard F., le Hellard S., Agulhon C., Weiland S., Favre I., Bertrand S., Malafosse A., Bertrand D. (2001) Brain Res. Brain Res. Rev. 36, 275–284 [DOI] [PubMed] [Google Scholar]
- 11.Richards M. C., Heron S. E., Spendlove H. E., Scheffer I. E., Grinton B., Berkovic S. F., Mulley J. C., Davy A. (2004) J. Med. Genet. 41, e35. [DOI] [PMC free article] [PubMed] [Google Scholar]
- 12.Schwake M., Pusch M., Kharkovets T., Jentsch T. J. (2000) J. Biol. Chem. 275, 13343–13348 [DOI] [PubMed] [Google Scholar]
- 13.Bonifacino J. S., Suzuki C. K., Klausner R. D. (1990) Science 247, 79–82 [DOI] [PubMed] [Google Scholar]
- 14.Wen H., Levitan I. B. (2002) J. Neurosci. 22, 7991–8001 [DOI] [PMC free article] [PubMed] [Google Scholar]
- 15.Bal M., Zaika O., Martin P., Shapiro M. S. (2008) J. Physiol 586, 2307–2320 [DOI] [PMC free article] [PubMed] [Google Scholar]
- 16.Joiner W. J., Khanna R., Schlichter L. C., Kaczmarek L. K. (2001) J. Biol. Chem. 276, 37980–37985 [DOI] [PubMed] [Google Scholar]
- 17.Lee W. S., Ngo-Anh T. J., Bruening-Wright A., Maylie J., Adelman J. P. (2003) J. Biol. Chem. 278, 25940–25946 [DOI] [PubMed] [Google Scholar]
- 18.Schwake M., Athanasiadu D., Beimgraben C., Blanz J., Beck C., Jentsch T. J., Saftig P., Friedrich T. (2006) J. Neurosci. 26, 3757–3766 [DOI] [PMC free article] [PubMed] [Google Scholar]
Associated Data
This section collects any data citations, data availability statements, or supplementary materials included in this article.