Abstract
Cold stress in rodents increases the expression of UCP1 and PGC-1α in brown and white adipose tissue. We have previously reported that C/EBPβ specifically binds to the CRE on the proximal Pgc-1α promoter and increases forskolin-sensitive Pgc-1α and Ucp1 expression in white 3T3-L1 preadipocytes. Here we show that in mice exposed to a cold environment for 24 h, Pgc-1α, Ucp1, and C/ebpβ but not C/ebpα or C/ebpδ expression were increased in BAT. Conversely, expression of the C/EBP dominant negative Chop10 was increased in WAT but not BAT during cold exposure. Reacclimatization of cold-exposed mice to a warm environment for 24 h completely reversed these changes in gene expression. In HIB-1B, brown preadipocytes, forskolin increased expression of Pgc-1α, Ucp1, and C/ebpβ early in differentiation and inhibited Chop10 expression. Employing chromatin immunoprecipitation, we demonstrate that C/EBPβ, CREB, ATF-2, and CHOP10 are bound to the Pgc-1α proximal CRE, but CHOP10 does not bind in HIB-1B cell lysates. Forskolin stimulation and C/EBPβ overexpression in 3T3-L1 cells increased C/EBPβ and CREB but displaced ATF-2 and CHOP10 binding to the Pgc-1α proximal CRE. Overexpression of ATF-2 and CHOP10 in 3T3-L1 cells decreased Pgc-1α transcription. Knockdown of Chop10 in 3T3-L1 cells using siRNA increased Pgc-1α transcription, whereas siRNA against C/ebpβ in HIB-1B cells decreased Pgc-1α and Ucp1 expression. We conclude that the increased cAMP stimulation of Pgc-1α expression is regulated by the combinatorial effect of transcription factors acting at the CRE on the proximal Pgc-1α promoter.
A remarkable feature of rodent adipose tissue is the ability to undergo a transition from white to brown adipose during cold exposure. This transition is driven by the sympathetic nervous system and enables the animal to defend its body temperature by increasing heat production due to the oxidation of fatty acids by brown adipose mitochondria, which contain the tissue-specific UCP1 (uncoupling protein 1). The inherent plasticity that allows this transition from white to brown adipose tissue is not due to a change in the number of adipocytes in a depot but to modification of white adipocytes to the brown adipocyte phenotype, sometimes referred to as “transdifferentiation” (1). This change in adipocyte cell type is orchestrated by the sympathetic nervous system neurotransmitter, noradrenaline, which stimulates intracellular cAMP and activates a protein kinase A-dependent increase in UCP1 expression.
Transdifferentiation from white to brown adipose tissue and/or vice versa has been reported in many species, including rodents, cats, dogs, ruminants (2–9), and humans (10). Studies have suggested the existence of brown adipocytes in humans not only at birth but also within white fat depots in adult humans (11). There is evidence that human brown adipocytes may be able to proliferate under certain circumstances, such as chronic cold exposure (12, 13), suggesting that transdifferentiation of WAT2 to BAT in adult humans is a potential strategy to reduce obesity. The proposal that BAT is present in adult humans (1) has recently been supported by the use of fluorodeoxyglucose positron emission tomography to reveal BAT human depots localized to the supraclavicular, neck, spinal cord, and mediastinum areas (14).
The nuclear receptor coactivator, PGC-1α (peroxisome proliferator-activated receptor γ (PPARγ) coactivator-1α) has also been shown to be involved in the expression of the BAT phenotype (15). PGC-1α is expressed in a number of tissues, including brown adipose tissue, muscle, liver, and brain (16). PGC-1α is induced by cold exposure or adrenergic stimulation in BAT but not WAT, and ectopic expression of PGC-1α in WAT cells induces expression of UCP1 (15). It is also expressed in non-adipose cells under circumstances when increased metabolic energy expenditure is favored (e.g. in the liver in response to glucagon stimulation during fasting (17) or in exercise-conditioned muscle tissue, where it plays a role in the stimulation of oxidative capacity via its interaction with the NRF1 and -2 (nuclear respiratory factor 1 and 2) family (16, 18)). Expression of PGC-1α is cAMP-dependent in liver and BAT, and a major role of PGC-1α is to augment cAMP-mediated transactivation of effector genes, such as UCP1 in BAT or PEPCK in the liver (15), (17). cAMP-induction of PGC-1α appears to depend primarily on a single conserved cAMP-response element (CRE) found within 200 bp of the transcription start site. Although this proximal CRE can drive PGC-1α expression in both BAT and liver, additional unidentified mechanisms operate to silence cAMP-inducible PGC-1α expression in WAT, although a range of other WAT expressed genes are cAMP-regulated (19). CRE sites are regulatory elements that can bind a wide range of transcription factors, typically belonging to the bZIP family (20). Transcription factors of the bZIP family can act as activators, non-activators, or repressors, which are regulated by different signaling pathways and influence gene expression (21). CREB was the first protein characterized as a target of cAMP acting through CRE sites (20). Subsequent to the characterization of CREB, ATF-2, c-JUN, CREM, and the C/EBPs have been described as functioning as CRE-binding proteins connecting cellular stimulation with transcription of CRE-containing genes, thus adding another layer of complexity to the CRE sites (22–24). Protein kinase A activation of PGC-1α expression has been proposed to be mediated by interaction of ATF-2 and CREB, in brown adipose tissue and liver, respectively. Our previous study has demonstrated that C/EBPβ binding to the CRE on the Pgc-1α promoter is able to induce cAMP-responsive expression of Pgc-1α and Ucp1 in the white preadipocyte cell line 3T3-L1 (25).
White adipocyte differentiation is the result of a chain of transcriptional events involving CCAAT/enhancer-binding proteins C/EBPα, C/EBPβ, and C/EBPδ (26–28) and the nuclear hormone receptor PPARγ (29, 30), which combine to induce adipogenic genes. Within 6 h of adding the hormonal mixture to induce differentiation, there is an increased expression of C/EBPβ, but this lacks DNA binding activity until much later due to the simultaneous expression of CHOP10 (C/EBP homologous protein), which sequesters and inactivates C/EBPβ by heterodimerization with its leucine zipper (31). After a lag period, CHOP10 undergoes down-regulation, releasing C/EBPβ from inhibitory constraint, allowing transactivation of the C/EBPα and PPARγ genes, transcription factors required for terminal differentiation. The transcriptional events involved in brown adipocyte differentiation are not as well characterized, but genetic ablation studies have demonstrated that PPARγ, C/EBPβ, and C/EBPδ but not C/EBPα are also essential for this process (32, 33).
Therefore, a number of bZIP transcriptional factors interact with the CRE on the Pgc-1α proximal promoter, suggesting that adipose tissue-specific responses to cAMP may come about by different combinations of transcriptional factors binding to the CRE as has been proposed for the Pepck and Il-10 (34–36). Here we provide evidence that conversion of WAT to BAT during exposure to a cold environment involves combinatorial transcriptional factor regulation of the Pgc-1α proximal CRE, which gives rise to adipose tissue-specific expression of Pgc-1α and Ucp1 during stimulation by cAMP.
EXPERIMENTAL PROCEDURES
Animal Experiments
Three groups of C57BL/6 mice were used, each consisting of four female individuals. All three groups were housed individually in cages measuring 48 × 15 × 13 cm with a 16-h light and 8-h dark cycle with access to bedding material. All groups had access ad libitum to a standard mouse chow diet. Mouse weight and feed consumption was measured at 24-h intervals. One group was kept at 22 ± 2 °C for 72 h; these mice comprised the warm acclimatized group. A second group was kept at 22 ± 2 °C for 48 h, followed by 8 ± 2 °C for 24 h and comprised the cold acclimatized group. The third group of 12 individuals was kept at 22 ± 2 °C for 24 h and then at 8 ± 2 °C for 24 h, followed by a return to 22 ± 2 °C for 24 h and comprised the reacclimatized group. All experiments followed institutional guidelines at the University of Aberdeen as well as those set out for animal care by the United Kingdom Home Office. Animals were euthanized by concussion, followed by cervical dislocation following Home Office guidelines.
Plasmids
The firefly luciferase reporter gene construct containing 264 bp (264PGC1α-pGL3) from the region upstream of the rat Pgc-1α transcription start site ligated to the pGL3-Basic vector (Promega) has been described (25). The pMSVC/EBPβ (mouse) expression plasmid that contains the respective cDNAs under the control of the mouse sarcoma virus long terminal repeat was kindly provided by S. McKnight (University of Texas Southwestern Medical Center, Dallas, TX). The mock plasmid pcDNA3 was from Invitrogen. The CRE-positive vector (pCRE-LUC) that contains four juxtapose copies of the consensus CRE sequence upstream of a TATA box to drive expression of the firefly luciferase gene was purchased from Stratagene. Expression vector for the truncated isoform (pSG/LIP) of C/EBPβ was provided by Birgit Gellersen (Institute for Hormone and Fertility Research, University of Hamburg, Hamburg, Germany). The expression plasmids pEBG2T-ATF2, which contained human ATF-2, and pCMV5CREB1, which contained human CREB1, were kindly provided by Philip Cohen (University of Dundee, UK). Mouse CHOP10 wild type and dominant negative (deletion of the leucine zipper domain) plasmids were supplied by David Ron (New York, NY).
Cell Culture, Transfections, and Luciferase Assays
3T3-L1 cells (ECACC) and HIB-1B cells (kindly provided by B. Spiegelman) were maintained in Dulbecco's modified Eagle's medium with 10% fetal bovine serum (Invitrogen) in 5% CO2. For differentiation, HIB-1B cells were cultured to confluence (day 0), and then they were exposed to the differentiation mixture (0.5 mm isobutylmethylxanthine, 250 nm dexamethasone, 170 nm insulin, 10 nm T3). After 48 h, cells were maintained in medium containing 5% fetal bovine serum, 170 nm insulin, and 10 nm T3 until day 7 for harvest, and this medium was replaced daily. HIB-1B cells were transfected with luciferase plasmids using Fugene 6 (Roche Applied Science) at a charge ratio of 3:1, and 3T3-L1 cells were transfected with Lipofectamine 2000 (Invitrogen) at a charge ratio of 2:1 at 80% confluence in combination with expression vectors, where indicated, or pcDNA3 as a control. The pRL-SV40 (from Promega) that carries Renilla luciferase was also co-transfected as an internal control for monitoring the transfection efficiency. Thirty-six hours later, cells were treated with forskolin in serum-free conditions, and after 12 h, cells were harvested, and luciferase activities were analyzed using the Dual-Luciferase assay kit (Promega), as recommended by the manufacturer. Values were expressed relative to the control Renilla to allow for differences in transfection efficiency.
Immunofluorescence Studies
HIB-1B and 3T3-L1 preadipocytes were grown in CultureWell™ chambered coverglasses (Invitrogen). Cells were treated with 10 μm forskolin or vehicle solution (DMSO) for 30 min and fixed with 4% paraformaldehyde in phosphate-buffered saline for 15 min. Cells were permeabilized with 0.3% (v/v) Triton X-100 for 5 min and blocked with 3% (w/v) bovine serum albumin for 1 h. After blocking, cells were incubated in 3% bovine serum albumin in phosphate-buffered saline containing 0.1% Tween 20 and anti-pCREB, anti-pATF-2 (Cell Signaling), or anti-C/EBPβ (C-19; Santa Cruz Biotechnology) overnight at 4 °C. Cells were washed three times with 0.1% Tween 20 and incubated at room temperature for 1 h in the dark after adding fluorescence-labeled secondary antibody (fluorescein isothiocyanate-conjugated anti-rabbit IgG from Sigma). After washing in phosphate-buffered saline, antifade solution with 4′,6-diamidino-2-phenylindole (Molecular Probes) was applied, and cells were covered with mounting solution until they were examined by fluorescence microscopy.
C/ebpβ and Chop10 Gene Silencing
Commercially available mouse siRNA oligonucleotides targeting C/EBPβ and CHOP10 as well as control (non-targeting) siRNA (Dharmacon) were employed to transfect HIB-1B and 3T3-L1 cells (100 nm siRNA), respectively, by the use of Dharmafect 3 (Dharmacon) according to the manufacturer's protocol. In cotransfection experiments involving siRNAs, the siRNA was added to the well when cells reached 60% confluence, and plasmid transfection was performed 24 h later. HIB-1B cells were kept in serum-free medium for 4 h after transfection, which was replaced with medium containing 20% fetal bovine serum to maximize cell growth and prevent potential cytotoxicity. Cells were harvested 72 h after transfection for RNA extraction.
ChIP Assays
Chromatin immunoprecipitation (ChIP) assays were performed according to the manufacturer's protocol (Upstate Biotechnology, Inc., Lake Placid, NY). Briefly, HIB-1B and 3T3-L1 preadipocytes were transfected with pcDNA3 or pMSVC/EBPβ, and 48 h later (at confluence), they were stimulated with forskolin (10 μm) or DMSO for 1 h. Protein-DNA cross-linking was achieved by adding formaldehyde (1% final concentration) for 1 h at 37 °C. The cells were washed twice with ice-cold phosphate-buffered saline and lysed in SDS lysis buffer (3% SDS, 1% Triton X-100, 0.5% sodium deoxycholate, 10 mm EDTA, and 50 mm Tris-HCl, pH 8.1) supplemented with protease inhibitors. The whole cell lysates were sonicated with a Soniprep 150 for 30 s at the maximum setting. This was repeated eight times with 1-min intervals between each 30-s pulse, yielding chromatin fragments between 200 and 500 bp in size. Lysates were centrifuged at 13,000 rpm for 10 min, and the resulting supernatants were diluted 10-fold with ChIP dilution buffer in the presence of protease inhibitors. Normal rabbit IgG (sc-2027; Santa Cruz Biotechnology) and salmon sperm DNA, 50% protein A-agarose slurry (80 μl) was added to the lysates, which were incubated for 30 min at 4 °C to reduce nonspecific background. Agarose beads were precipitated by brief centrifugation, and the supernatant was collected. Antibodies against CREB (Upstate Biotechnology), C/EBPβ, ATF-2 (N-96; Santa Cruz Biotechnology), CHOP10 (F-168; Santa Cruz Biotechnology), or preimmune serum (negative control) were added to the 2-ml supernatant fraction, and the mixture was incubated overnight at 4 °C with rotation. The immunocomplexes were collected by binding to 60 μl of salmon sperm DNA-Protein A-agarose slurry after incubation for 1 h at 4 °C with rotation. The antibody-histone-DNA complexes were washed sequentially with low salt buffer, high salt buffer, lithium chloride wash buffer, and TE buffer. The pellets were then eluted, and reversal of cross-linking was done by heating at 65 °C overnight in the presence of NaCl. Purification of DNA was done with a QIAquick PCR purification kit (Qiagen), and the obtained DNA fragments were analyzed by PCR using the following primer pairs for the mouse Pgc-1α promoter: forward, 5′-GGGCTGCCTTGGAGTGACGTC-3′; reverse, 5′-AGTCCCCAGTCACATGACAAAG-3′.
Western Blotting
Western blotting on whole cell lysates was performed as reported previously (25). Immunological detection was performed using antibodies directed against CREB (1:1000 dilution), ATF-2 (1:500 dilution), CHOP10 (1:350 dilution), C/EBPβ (1:500 dilution), and actin (1:250 dilution; Sigma). The antigen-antibody complex was detected by incubating the membrane for 1 h at room temperature in buffer containing a 1:1000 dilution of horseradish peroxidase-conjugated anti-rabbit IgG secondary antibody (Cell Signaling) and visualized with SuperSignal West Pico blotting substrate (Pierce).
Real Time PCR
Total RNA was extracted from cultured cells by use of TRI reagent (Sigma). Prior to RT-PCR, samples were treated with DNA-free DNase to remove contaminating genomic or plasmid DNA. cDNA was generated using the cDNA synthesis kit from Qiagen. Quantitative real time PCR (qRT-PCR) was performed using SYBR Green (Qiagen) according to the manufacturer's instructions in a Rotor Gene 3000 thermal cycler (Corbert Research). The sequences of the primers used for real time PCR were Pgc-1α sense (GCGCCGTGTGATTTACGTT) and antisense (AAAACTTCAAAGCGGTCTCTCAA), Ucp1 sense (CCTGCCTCTCTCGGAAACAA) and antisense (TGTAGGCTGCCCAATGAACA), C/ebpα sense (CCGGGAGAACTCTAACTC) and antisense (GATGTAGGCGCTGATGT), C/ebpβ sense (GCAAGAGCCGCGACAAG) and antisense (GGCTCGGGCAGCTGCTT), C/ebpδ sense (ACGACGAGAGCGCCATC) and antisense (TCGCCGTCGCCCCAGTC), Chop10 sense (AGAGGAAGAATCAAAAACCTTCACT) and antisense (ACTCTGTTTCCGTTTCCTAGTTCTT), and 18 S rRNA sense (GTAACCCGTTGAACCCCATT) and antisense (CCATCCAATCGGTAGTAGCG). Expression levels for all genes were normalized to the internal control 18 S rRNA.
Statistical Analysis
All of the data were analyzed with either Student's t test or two-way analysis of variance.
RESULTS
Differential Regulation of C/EBP Isoforms in Brown and White Adipose Tissue of Cold-exposed Adult Mice and HIB-1B Cells
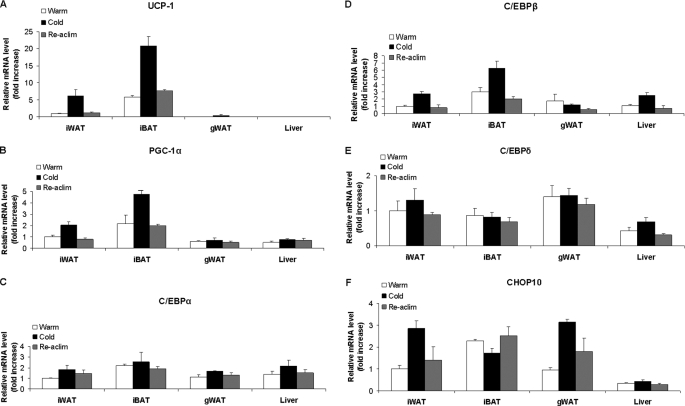
We have previously demonstrated that C/EBPβ overexpression was able to increase Pgc-1α and Ucp1 expression in response to cAMP stimulation in 3T3-L1 cells, suggesting that C/EBPβ is implicated in sympathetic neural stimulation of brown adipose tissue recruitment in white adipose tissue depots. We first set out to demonstrate that the increase in Pgc-1α and Ucp1 expression in adipose tissue in response to cold stress was associated with increased C/ebpβ expression. Maintaining mice for 24 h in a cold environment at 8 °C compared with 22 °C significantly increased mRNA levels for both Pgc-1α (p < 0.05) and Ucp1 (p < 0.01; Fig. 1, A and B) in interscapular BAT (iBAT), and these changes were reversed within 24 h of reacclimatization of cold-maintained animals back to a warm environment. Interscapular WAT (iWAT) represents tissue that was distinguishable from iBAT by visual dissection, and as expected, both Pgc-1α and Ucp1 expression were lower compared with iBAT. The increase in Pgc-1α and Ucp1 expression in iWAT (p < 0.01) in animals maintained in the cold was presumably due to a population of iWAT contaminated with iBAT (Fig. 1, A and B). There was a small but significant (p < 0.01) induction of Ucp1 expression in gonadal WAT, which is likely to be due to BAT recruitment of small pockets of cells previously observed in WAT (Fig. 1A). Ucp1 was not expressed in liver. Pgc-1α was expressed at lower levels in gonadal WAT and liver and was not altered by housing temperature. When tissue mRNA for the three C/EBP isomers was measured (Fig. 1, C–E), there were no significant effects of housing temperature on C/ebpα and C/ebpδ levels in any of the tissues studied, but C/ebpβ expression was significantly (p < 0.01) increased by the cold housing treatment in iBAT, iWAT, and liver but not gonadal WAT. Similar to Pgc-1α and Ucp1, levels of C/ebpβ mRNA were highest in iBAT, and responses to the cold environment were rapidly reversed by 24-h reacclimatization in the warmth. Exposure to cold has previously been reported to increase C/ebpβ but not C/ebpα or C/ebpδ in iBAT (37, 38), indicating a positive association of C/EBPβ gene expression with Pgc-1α and Ucp1. We next assessed the levels of Chop10, which has been reported to act as a dominant negative transcription factor of C/EBPs (Fig. 1F); Chop10 was not altered by environmental temperature in liver and decreased in iBAT (p = 0.05) but was increased (p < 0.01) by the cold treatment in gonadal WAT and iWAT.
FIGURE 1.
UCP1, PGC-1α, and C/EBPβ but not C/EBPα, C/EBPδ, or CHOP10 expression are induced during cold stress in mice in iBAT but not gonadal WAT. Animals were maintained at 22 ± 2 °C for 72 h (warm), at 22 ± 2 °C for 48 h followed by 8 ± 2 °C for 24 h (cold), and at 22 ± 2 °C for 24 h and then at 8 ± 2 °C for 24 h followed by a return to 22 ± 2 °C for 24 h (re-acclimatized; Re-aclim). Values were analyzed by qRT-PCR and normalized against 18 S rRNA expression. Values are the average of four animals in each group ± S.E.
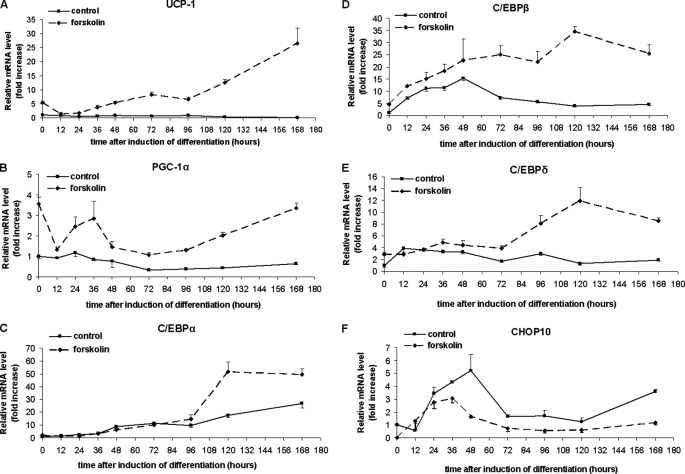
Having demonstrated that changes in adipose tissue expression of C/ebpβ in response to transitions from warm to cold and cold to warm environments followed the same pattern as Pgc-1α and Ucp1 expression, we next sought to examine these associations during differentiation in the brown adipocyte cell line, HIB-1B. Expression of Ucp1 was significantly (p < 0.01) increased by treatment with forskolin, compared with basal DMSO-treated cells at confluence (Fig. 2A), as we have previously demonstrated (25). This response disappeared 12 and 24 h after inducing differentiation but returned by 36 h and increased to 7 days after induction, when lipid droplets can be observed in HIB-1B cells. Basal Ucp1 mRNA expression was low throughout the differentiation protocol unless stimulated by cAMP with forskolin (39). Forskolin-induced expression of Pgc-1α followed a pattern similar to that of Ucp1 (Fig. 2B), with a significant increase (p < 0.01) at confluence followed by a loss of response to forskolin at 12 h postinduction and then a significant response (p < 0.01) up to 7 days of differentiation. Interestingly, there was a biphasic increase in the sensitivity of Pgc-1α expression to forskolin with a second peak at 36 h after induction of differentiation and little change in basal Pgc-1α expression during the differentiation experiment.
FIGURE 2.
cAMP activation by forskolin increases UCP1, PGC-1α, C/EBPβ, and C/EBPδ expression, whereas it decreases CHOP10 expression throughout differentiation. C/EBPα becomes forskolin-inducible only 96 h after inducing differentiation. Cells were treated with forskolin (10 μm) or DMSO for 3 h prior to RNA extraction. Gene expression levels were analyzed by qRT-PCR and normalized against 18 S rRNA expression. Error bars, S.E. of triplicate observations of one of three independent experiments.
Basal expression of C/ebpβ mRNA in HIB-1B cells was increased, peaking at 48 h after the addition of the differentiation induction mixture (Fig. 2D). Forskolin induced a further increase (p < 0.01) in C/ebpβ expression, which was maintained throughout the 7-day differentiation protocol. This contrasted with expression of C/ebpα, which only responded (p < 0.01) to the forskolin addition between 4 and 7 days after inducing differentiation, as previously reported for BAT preadipocytes (37) (Fig. 2C). Some sensitivity of C/ebpδ expression to forskolin was apparent in the early stages of differentiation, but this was dramatically increased by day 3 of differentiation (p < 0.01). The pattern of expression of Chop10 during HIB-1B differentiation was generally the inverse of the other C/EBP homologues in that forskolin treatment decreased (p < 0.01) Chop10 expression at virtually all time points, except for a transient increase in expression 24–48 h after induction of differentiation.
Overexpression of Chop10 Down-regulates the Stimulatory Effect of Overexpression of C/ebpβ on Pgc-1α Transcription in HIB-1B and 3T3-L1 Cells
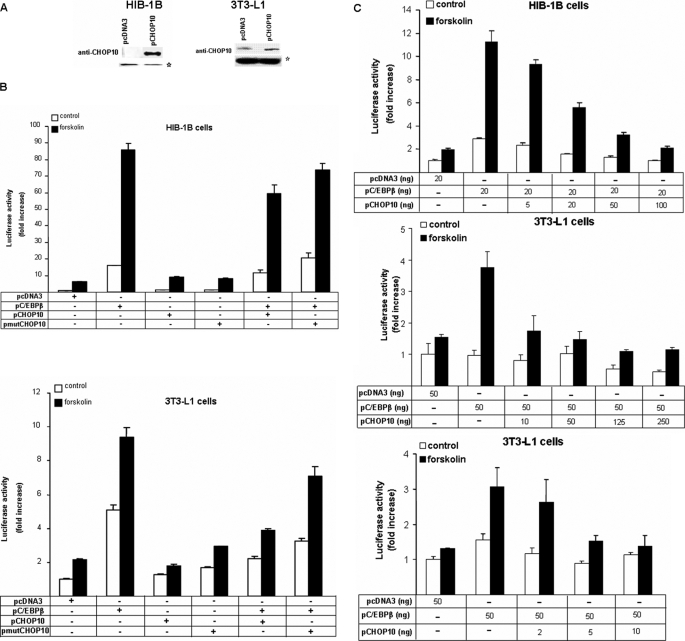
We have previously proposed (25) that combinatorial interactions between bZIP transcription factors acting on the CRE site of the Pgc-1α proximal promoter by forming homo- and/or heterodimers might regulate adipocyte Pgc-1α expression in response to forskolin. We therefore compared the effect of overexpression of C/EBPβ and CHOP10 on the activity of a 264-bp PGC-1α luciferase reporter construct, which we have previously shown to respond differentially to forskolin in HIB-1B and 3T3-L1 cells. We first established successful overexpression of CHOP10 by Western blotting in cell protein extracts (Fig. 3A). Successful transfection of C/EBPβ has previously been shown (25). These studies also demonstrated that confluent HIB-1B cells lack CHOP10 expression compared with 3T3-L1 cells. Overexpression of C/EBPβ increased (p < 0.01) Pgc-1α promoter activation under both basal and forskolin-induced conditions, and this effect was far greater in HIB-1B compared with 3T3-L1 cells (Fig. 3B). On its own, CHOP10 overexpression failed to alter the expression from the Pgc-1α reporter construct, as did overexpression of a mutated CHOP10 construct that lacked the leucine zipper domain, which enables the formation of homo- or heterodimer formation with other bZIP and non-bZIP transcription factors (40). Co-transfection studies with both C/EBPβ and CHOP10 overexpression vectors demonstrated that CHOP10 overexpression down-regulates (p < 0.01) the stimulatory effect of overexpression of C/EBPβ on Pgc-1α transcriptional activation, with this effect being more marked in 3T3-L1 cells (Fig. 3B). Co-expression of the mutated CHOP10 and C/EBPβ suggested that removing the leucine zipper domain decreased this down-regulatory action of CHOP10. We further characterized the interaction between CHOP10 and C/EBPβ on the Pgc-1α promoter by transfecting preadipocytes with increasing amounts of CHOP10 expression vector while maintaining C/EBPβ overexpression constant. CHOP10 down-regulated the stimulatory effect of C/EBPβ overexpression on Pgc-1α transcriptional activation in a dose-dependent manner, with this effect being more sensitive in 3T3-L1 cells (Fig. 3C).
FIGURE 3.
CHOP10 is present in confluent 3T3-L1 but not HIB-1B preadipocytes, and overexpression of CHOP10 down-regulates the stimulatory effect of overexpression of C/EBPβ on PGC-1α transcriptional activation. A, Western blotting showing overexpression of CHOP10 (30 kDa) in confluent HIB-1B and 3T3-L1 cells. *, nonspecific binding that serves as a loading control. B, Pgc-1α promoter activity in HIB-1B and 3T3-L1 cells co-transfected with 264PGC1α-pGL3 and an empty control vector pcDNA3 or expression plasmids for C/EBPβ, CHOP10, or a mutant CHOP10, as indicated, and at confluence were treated with forskolin (10 μm) or DMSO for 12 h. C, Pgc-1α reporter activity in HIB-1B and 3T3-L1 cells co-transfected with 264PGC1α-pGL3, pcDNA3, pC/EBPβ, and increasing amounts of pCHOP10, as indicated; at confluence, they were treated with forskolin (10 μm) or DMSO. Error bars, S.E. of triplicate observations of one of three independent experiments.
The Role of CREB, ATF-2, and LIP in Cell-specific cAMP Inducibility of PGC-1α
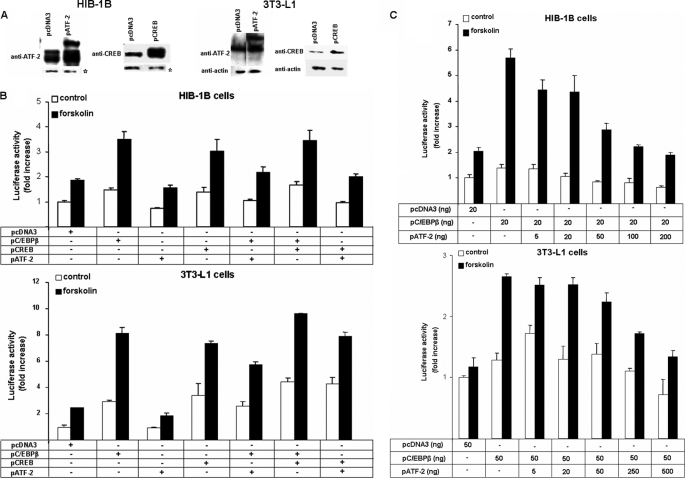
We have previously shown that CREB and C/EBPβ bind to the Pgc-1α proximal promoter CRE region using electromobility shift assays (25). Using this approach, we first established that ATF-2 also specifically binds to the PGC-1α-CRE (results not shown). We next examined the effect of co-overexpression of either CREB or ATF-2 on the stimulatory effect of C/EBPβ on Pgc-1α transcriptional activation. Western blotting of cell extracts first demonstrated successful overexpression of CREB and ATF-2 (Fig. 4A) and also demonstrated that HIB-1B cells have higher concentrations of CREB and ATF-2 than 3T3-L1 cells. Furthermore, ATF-2 is present as a doublet in HIB-1B cells but only as a single band in 3T3-L1 cells.
FIGURE 4.
Cell levels of CREB are higher in confluent 3T3-L1 compared with HIB-1B cells and ATF-2 overexpression decreases the capacity of C/EBPβ and CREB to transactivate the PGC-1α promoter in both 3T3-L1 and HIB-1B cells. A, Western blotting showing overexpression of CREB (43 kDa) and ATF-2 (80 kDa). *, nonspecific binding (loading control). B, PGC-1α promoter activity in HIB-1B and 3T3-L1 cells transiently co-transfected with 264PGC1α-pGL3 and an empty control vector pcDNA3 or expression plasmids for C/EBPβ, CREB, and ATF-2 or combinations, as indicated; at confluence, they were treated with forskolin (10 μm) or DMSO for 12 h. C, Pgc-1α reporter activity in HIB-1B and 3T3-L1 cells co-transfected with 264PGC1α-pGL3, pcDNA3, pC/EBPβ, and increasing amounts of pATF-2 after a 12-h treatment with forskolin (10 μm) or DMSO. Error bars, S.E. of triplicate observations of one of three independent experiments.
Overexpression of CREB stimulated (p < 0.01) Pgc-1α transcriptional activation in response to forskolin in both HIB-1B and 3T3-L1 cells, but there was no further augmentation of the stimulatory effect of C/EBPβ over expression on forskolin-induced expression from the Pgc-1α luciferase reporter construct (Fig. 4B). In contrast, ATF-2 overexpression did not alter transcription from the Pgc-1α promoter, but there was evidence in HIB-1B cells that ATF-2 decreased (p < 0.05) C/EBPβ up-regulation of Pgc-1α transcriptional activation (Fig. 4B). A dose-response experiment with increasing amounts of ATF-2 co-transfected with a constant amount of C/EBPβ expression vector revealed that ATF-2 overexpression inhibited forskolin up-regulation of Pgc-1α transcriptional activity more sensitively in control and C/EBPβ-overexpressing HIB-1B compared with 3T3-L1 cells (Fig. 4C).
The observation that ATF-2 can act as a transcriptional inhibitor of Pgc-1α expression in HIB-1B cells contradicts the evidence presented by Cao et al. (41) that cAMP stimulation of Pgc-1α expression was transduced by p38 MAPK-mediated ATF-2 activation and binding of ATF-2 to the proximal PGC-1α-CRE. We have been unable to repeat the observations of Cao et al. (41) that the MAPK inhibition using either SB202190 or SB203580 inhibited cAMP stimulation of Pgc-1α and Ucp1 in HIB-1B cells.3 Our results are consistent with the proposal that p38 MAPK phosphorylation of ATF-2 acts as a negative regulator of transcription from the Pgc-1α promoter, whereas C/EBPβ and CREB act as transcriptional activators.
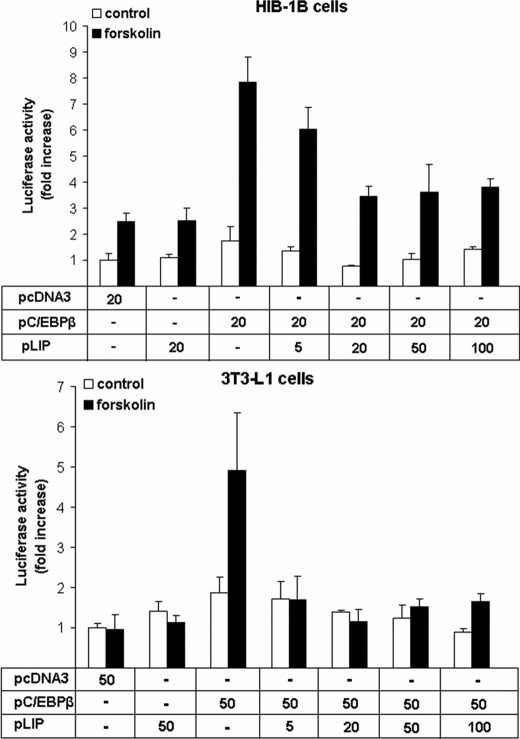
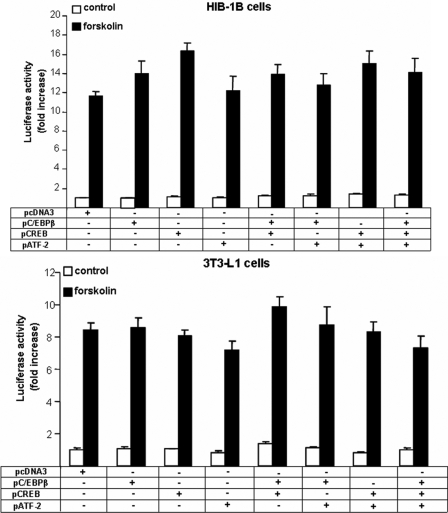
There are several isomers of C/EBPβ, including LIP, a 20-kDa truncated form (also known as liver inhibitory protein), that retain the C-terminal bonding domain but lack the major N-terminal transactivation domain and can dominantly inhibit the activating C/EBP isoforms (42). Co-transfection with a constant amount of C/EBPβ and increasing amounts of the 20-kDa C/EBPβ indicated that the stimulatory effect of C/EBPβ on transcription from the Pgc-1α proximal promoter was decreased but not abolished by co-expression of the 20-kDa C/EBPβ (Fig. 5). To establish that the effects of bZIP transcriptional factor overexpression on Pgc-1α were not due to a general response of promoters containing CREs, we used a control pCRE-LUC firefly reporter construct made up of four tandem CRE repeats and demonstrated that forskolin-induced expression was not altered by co-transfection with expression vectors for C/EBPβ, CREB, and ATF-2 in either HIB-1B or 3T3 (Fig. 6).
FIGURE 5.
Overexpression of LIP down-regulates the stimulatory effect of overexpression of C/EBPβ on PGC-1α transcriptional activation. Pgc-1α promoter activity in HIB-1B and 3T3-L1 cells co-transfected with 264PGC1α-pGL3, pcDNA3, pC/EBPβ, and increasing amounts of pLIP. At confluence, cells were treated with forskolin (10 μm) or DMSO for 12 h. Error bars, S.E. of triplicate observations of one of three independent experiments.
FIGURE 6.
C/EBPβ, CREB, and ATF-2 do not alter the transcription of a control CRE vector in response to cAMP. HIB-1B or 3T3-L1 cells were transiently co-transfected with 4CRE-pGL3 luciferase constructs and expression plasmids for the control pcDNA3, pC/EBPβ, pCREB, pATF-2, or combinations, as indicated, and at confluence, they were treated with forskolin (10 μm) or DMSO for 12 h. Error bars, S.E. of triplicate observations of one of three independent experiments.
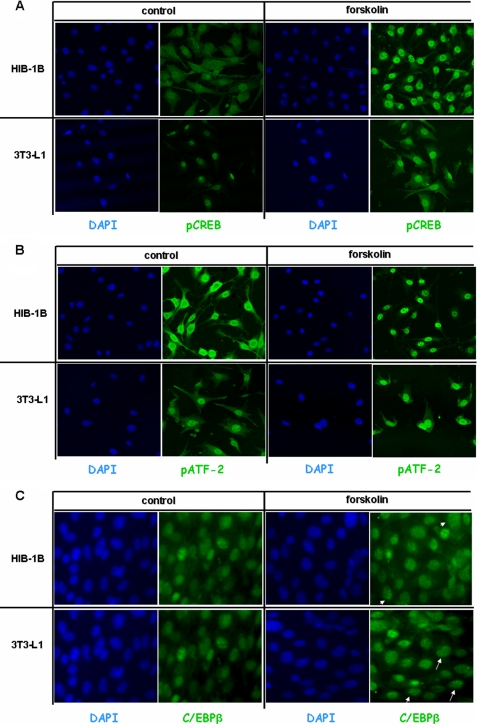
Fluorescence microscopy was then employed to determine the effect of forskolin on the cellular localization of phospho-CREB (pCREB), phospho-ATF-2 (pATF-2) and C/EBPβ in HIB-1B and 3T3-L1 cells. Basal pCREB levels were low in both HIB-1B and 3T3-L1 control cells, but exposure to forskolin resulted in the accumulation of high amounts of pCREB in the nucleus, as judged by the increased fluorescence intensity present in the nucleus (Fig. 7A). In HIB-1B cells, pATF-2 was present in both cytoplasm and nucleus, and exposure to forskolin increased translocation into the nucleus (Fig. 7B). In 3T3-L1 cells, pATF-2 was present in high levels mainly in the nucleus, independent of forskolin stimulation. In HIB-1B and 3T3-L1 in the absence of forskolin, the nuclear staining for C/EBPβ was diffuse, but the addition of forskolin resulted in a shift from diffuse to punctate nuclear immunofluorescent staining in both cell types. The punctate nuclear entities coincide with 4′,6-diamidino-2-phenylindole staining, which is known to localize to centromeres (43). This is a characteristic pattern of C/EBPβ, and it is believed that the association with centromeres correlates with maximum DNA binding activity (44).
FIGURE 7.
Forskolin increases nuclear phospho-CREB but not phospho-ATF-2 in HIB-1B and 3T3-L1 cells. C/EBPβ acquires a punctate fluorescent pattern in the presence of forskolin. HIB-1B and 3T3-L1 preadipocytes were treated with forskolin (10 μm) or DMSO for 30 min, fixed, and treated with antibodies against C/EBPβ, pCREB, and pATF-2, followed by fluorescein isothiocyanate-labeled anti-rabbit IgG, and counterstained by 4′,6-diamidino-2-phenylindole (DAPI). This experiment is representative of similar experiments performed on at least two separate occasions.
C/EBPβ Overexpression Increases C/EBPβ and CREB but Decreases ATF-2 and CHOP10 Binding to the CRE Region of the PGC-1α Promoter in 3T3-L1 Cells in Response to cAMP
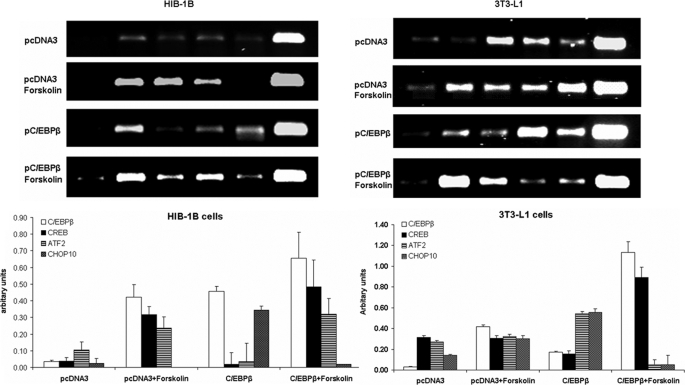
We then employed chromatin immunoprecipitation assays to find out whether forskolin treatment or overexpression of C/EBPβ caused differential binding of bZIP transcription factors to the CRE region of the PGC-1α proximal promoter. In HIB-1B cells, forskolin increased binding of C/EBPβ, CREB (p < 0.01), and ATF-2 (p < 0.05) and abolished CHOP10 binding to the Pgc-1α promoter (Fig. 8A). Overexpression of C/EBPβ increased C/EBPβ binding (p < 0.01) and induced weak CHOP10 binding (p < 0.01), whereas combined C/EBPβ overexpression and forskolin treatment resulted in increased binding of C/EBPβ, CREB, and ATF-2 (p < 0.01) and decreased (p < 0.01) CHOP10 binding to the Pgc-1α promoter in HIB-1B cells. In 3T3-L1 cells, CREB, ATF-2, and, to a much lesser extent, CHOP10 were bound to Pgc-1α promoter chromatin (Fig. 8B). Overexpression of C/EBPβ alone resulted in a weak enrichment of Pgc-1α promoter chromatin with C/EBPβ, whereas ATF-2 and CHOP-10 binding were increased (p < 0.01) compared with control cells. There was a striking increase (p < 0.01) in both CHOP10 and C/EBPβ binding to the Pgc-1α promoter in response to forskolin treatment, but combined overexpression with C/EBPβ and forskolin treatment decreased both CHOP10 and ATF-2 binding (p < 0.01) and increased C/EBPβ and CREB binding (p < 0.01). The results demonstrate that in 3T3-L1 cells, conditions that markedly stimulate Ucp1 expression (C/EBPβ overexpression and forskolin) are associated with increased C/EBPβ and CREB binding and decreased CHOP10 and ATF-2 binding, whereas in HIB1B cells, the same conditions only displace CHOP10 binding to the PGC-1α promoter.
FIGURE 8.
Stimulation with forskolin increases C/EBPβ, CREB, and ATF-2 binding to PGC-1α promoter chromatin in HIB-1B cells, independent of the presence of C/EBPβ overexpression. In 3T3-L1 cells, C/EBPβ overexpression and forskolin stimulation result in strong C/EBPβ and CREB binding while diminishing ATF-2 and CHOP10 binding to the PGC-1α-CRE. Shown is a ChIP analysis of bZIP proteins binding to the proximal PGC-1α promoter in confluent HIB-1B or 3T3-L1 cells transfected with control pcDNA3 or pC/EBPβ expression plasmids and treated with forskolin (10 μm) or DMSO for 1 h. The chromatin-associated DNA was incubated with rabbit preimmune serum (PI) or with antibodies against C/EBPβ, CREB, ATF-2, and CHOP10. An aliquot (0.5%) of the total chromatin DNA was used for input. The immunoblots were quantified by densitometric scanning of the films. Levels are presented as enrichment relative to input, corrected for preimmune serum control levels. The results are averages of at least three independent experiments with error bars indicating S.E. values.
Knockdown of Chop10 in 3T3-L1 Cells Increases Pgc-1α Transcription, whereas siRNA against C/ebpβ in HIB-1B Cells Decreases Pgc-1α and Ucp1 Expression
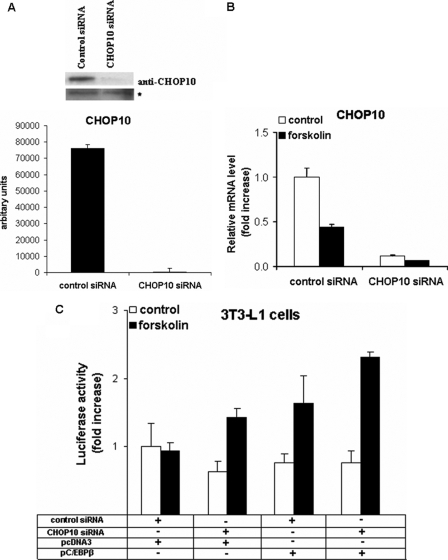
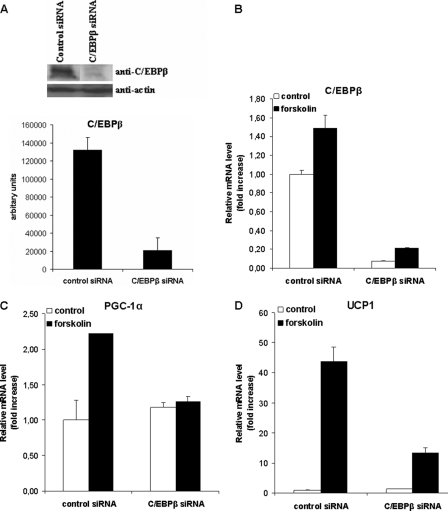
To demonstrate the functional importance of CHOP10 and C/EBPβ in the control of Pgc-1α expression, we next employed siRNA to knockdown theses genes. Transfection of 3T3-L1 cells with CHOP10 siRNA resulted in a highly significant decrease (p < 0.01) in Chop10 expression levels, as judged by Western blotting (Fig. 9A). CHOP10 siRNA decreased (p < 0.01) Chop10 mRNA expression by 88 and 85%, in basal and forskolin-treated 3T3-L1 cells, respectively (Fig. 9B). Importantly, CHOP10 siRNA induced forskolin stimulated expression from the Pgc-1α proximal promoter in 3T3-L1 cells, similar to that observed by C/EBPβ overexpression, and acted additively to stimulate C/EBPβ up-regulation of Pgc-1α transcriptional activity (Fig. 9C). C/EBPβ siRNA resulted in a decrease of C/EBPβ protein and mRNA expression levels ranging from 75 to 85% (p < 0.01) and down-regulated forskolin-induced Pgc-1α and Ucp1 expression (p < 0.01) (Fig. 10).
FIGURE 9.
CHOP10 siRNA in 3T3-L1 cells induces PGC-1α transcription in response to forskolin and C/EBPβ overexpression. A, Western blot analysis showing knockdown of CHOP10 in 3T3-L1 cells. CHOP10 amounts were quantified by densitometric scanning of the films. *, nonspecific binding (loading control). B, 3T3-L1 cells were transfected with control (non-targeting) siRNA and siRNA targeting Chop10, and 48 h later (at confluence), cells were treated with forskolin (10 μm), where indicated, for 3 h in serum-free conditions. Values were analyzed by qRT-PCR and normalized against 18 S rRNA expression. Error bars, S.E. of triplicate observations of one of three experiments. C, 3T3-L1 cells were transfected with control and CHOP10 siRNA and 12 h later were co-transfected with a reporter plasmid containing 264 bp of the proximal Pgc-1α promoter along with pcDNA3 or C/EBPβ expression plasmids. Thirty-six hours later, cells were incubated with forskolin (10 μm) for 12 h prior to harvesting. Error bar, S.E. of triplicate observations of one of two independent experiments.
FIGURE 10.
C/EBPβ siRNA in HIB-1B cells decreases PGC-1α and UCP1 expression in response to forskolin stimulation. HIB-1B cells were transfected with control (non-targeting) siRNA and siRNA targeting C/ebpβ, and 48 h later, confluent cells were treated with forskolin (10 μm), where indicated, for 3 h in serum-free conditions. Values were analyzed by Western blot analysis (A) with specific antibodies against C/EBPβ and actin and quantified by densitometric scanning of the films. B–D, quantitative RT-PCR values of C/ebpβ, Pgc-1α, and Ucp1 normalized against 18 S rRNA expression. Error bars, S.E. of triplicate observations of one of three experiments.
DISCUSSION
The present study differs from previous studies (11, 45), which demonstrated increased expression of Pgc-1α and Ucp1 mRNA in rodent interscapular adipose tissue in response to exposure to a cold environment, in two ways. First, we carefully dissected adipose tissue from the interscapular depot into white and brown tissue so that we could compare white adipose tissue from a well characterized “brown adipose tissue depot” with white adipose tissue in the gonadal depot. Although this approach is confounded by contamination of WAT with BAT in the interscapular tissue, the results clearly demonstrate that the changes in gene expression in iWAT are more similar to iBAT than gonadal WAT, lending support for the proposition that adipocytes from different depots differ in their intrinsic capacity to convert from WAT to BAT. Recently, lineage tracing approaches have surprisingly demonstrated that brown adipocytes in BAT depots share a common progenitor with muscle but not brown adipocytes in WAT depots (46). The second important difference from other studies is that we examined the response to reacclimatization back to a warm environment, 24 h after the adaptation to the cold environment. In previous studies in rodents (47), UCP1 expression was increased within 24 h of exposure to a cold environment. In our study, a similar increase in response to a cold environment was observed, but impressively, this increase in Ucp1 mRNA in adipose tissue from all depots could be reversed within 24 h of reacclimatization to the warm environment.
Previous studies have demonstrated that stimulation by a β3-adrenergic receptor agonist does not alter the total number of adipocytes in an adipose depot of rats but increases the proportion of brown adipocytes at the expense of white adipocytes (48). We observed significant increases in Ucp1 mRNA in both white and brown interscapular and gonadal adipose tissues during exposure to the cold environment, supporting the findings of Himms-Hagen and co-workers (48) that there is an increase in BAT recruitment even in an apparently white adipose tissue depot.
We have previously demonstrated that C/EBPβ overexpression was able to increase Pgc-1α and Ucp1 expression in response to cAMP stimulation in the white preadipocyte 3T3-L1 cell line, suggesting that C/EBPβ is implicated in sympathetic neural stimulation of brown adipocyte recruitment in white adipose tissue depots. In addition, there is physiological evidence to support a role for C/EBPβ in BAT differentiation. Like PGC-1α and UCP1, C/EBPβ (but not C/EBPα or -δ) expression in BAT is cold-inducible during cold exposure, adrenergic stimulation, and early development in rodents (37, 38, 47). Our study on cold-exposed mice clearly demonstrated that the increased expression of Pgc-1α and Ucp1 mRNA in iBAT compared with mice maintained at 28 °C was accompanied by an increase in C/ebpβ but not C/ebpα or C/ebpδ mRNA. This change occurred in both of the interscapular depot sites but not in gonadal WAT or liver. Conversely, expression of the C/EBP dominant negative Chop10 was increased in WAT but not BAT during cold exposure. Reacclimatization of 24-h cold-exposed mice to 28 °C for 24 h completely reversed these changes in gene expression. Observation of gene expression patterns during differentiation of HIB-1B cells recapitulated the changes in gene expression measured in iBAT during cold exposure. Forskolin addition, which mimics the in vivo stimulation of intracellular cAMP levels by the sympathetic nervous system due to cold activation, increased the expression of Pgc-1α, Ucp1, and C/ebpβ and, to a lesser extent, of C/ebpα or C/ebpδ and inhibited expression of Chop10. These results suggest a negative association of C/ebpβ and Pgc-1α with Chop10 in response to adrenergic stimulation in WAT versus BAT. These studies contrast with the well described studies in the white preadipocyte 3T3-L1 cell line, where hormonal induction of differentiation results in an early but transient increase in C/ebpβ and a decrease in Chop10 (31).
We have previously demonstrated that C/EBPβ but not C/EBPα or C/EBPδ binds to the CRE on the proximal Pgc-1α promoter. This finding has been confirmed by a subsequent study on the Pgc-1α promoter in liver, which also identified an additional C/EBPβ binding site upstream of the proximal promoter (49). We next sought to establish whether the PGC-1α-CRE is regulated by the binding of different combinations of bZIP transcription factors, such as CREB, ATF-2, C/EBPβ, and CHOP10. CHOP10 is a likely candidate for influencing differential patterns of gene expression in the two cell types, since Western blot analysis demonstrated that CHOP10 was present in 3T3-L1 but not HIB-1B cells. ChIP assays clearly demonstrated that all of these bZIP factors bind to the Pgc-1α proximal promoter in HIB-1B and 3T3-L1 nuclear extracts but that forskolin treatment elicited different responses in the two cell contexts; in HIB-1B cells, C/EBPβ, CREB, and ATF-2 binding was increased by forskolin, but there was no CHOP10 binding. In 3T3-L1 cells, C/EBPβ, CREB, ATF-2, and CHOP10 were bound to the PGC-1α-CRE in the presence of forskolin. In both cell types, overexpression of C/EBPβ in the presence of forskolin strongly increased C/EBPβ binding and in 3T3-L1 cells decreased both ATF-2 and CHOP10 binding. It is likely that CREB binding observed in control cells was due to non-phosphorylated transcriptionally inactive CREB (50), since immunofluorescent studies demonstrated that exposure to forskolin stimulated phospho-CREB nuclear transfer. Furthermore, the dimers observed in forskolin-treated 3T3-L1 cells are likely to be due to heterodimeric formation of C/EBPs with CREB or ATF-2, since dimerization of C/EBPs is a prerequisite for DNA binding (51), and CHOP10 has an inactive DNA-binding region (40).
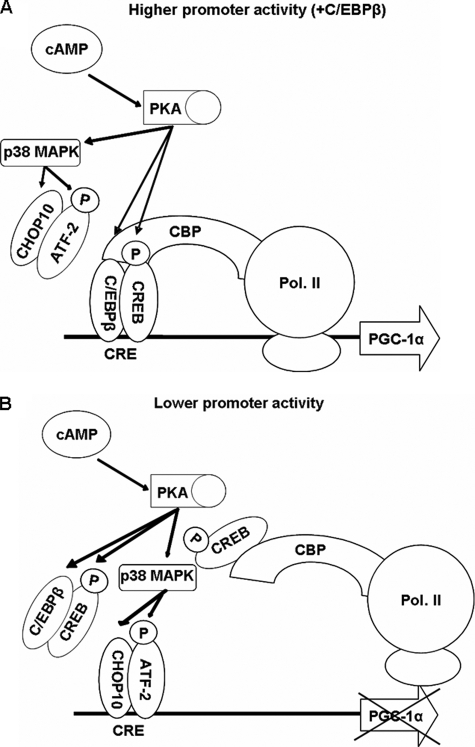
Interestingly, C/EBPβ overexpression in 3T3-L1 cells resulted in increased ATF-2 and CHOP10 binding to the PGC-1α promoter, whereas C/EBPβ was present at lower levels. When C/EBPβ overexpression and forskolin were combined, C/EBPβ and CREB binding was increased, but ATF-2 and CHOP10 binding to the PGC-1α proximal CRE decreased. These results suggest a model in which increased C/EBPβ cellular concentrations facilitate the formation of C/EBPβ/CREB dimers in response to cAMP stimuli by displacing ATF-2/CHOP10 dimers that are potential inhibitors of the cAMP-stimulated PGC-1α promoter in 3T3-L1 cells. When C/EBPβ is overexpressed and the cAMP pathway is stimulated, increased binding of CREB and C/EBPβ but not ATF-2 and CHOP10 occurs, accompanied by high Pgc-1α promoter activity and gene expression levels. Immunofluorescent staining with antibody against C/EBPβ in both HIB-1B and 3T3-L1 cells supported the data obtained from ChIP assay in that the diffused cytoplasmic C/EBPβ staining became a nuclear punctate staining in response to forskolin stimulation, similar to the centromeric localization and DNA binding of C/EBPβ reported by Tang and Lane (44). Hence, forskolin stimulation increases C/EBPβ binding to DNA in both HIB-1B and 3T3-L1 cells. The reason why CHOP10 and ATF-2 binding to the PGC-1α proximal promoter in 3T3-L1 nuclear extracts increased in the presence of extra C/EBPβ and disappeared when forskolin was added is not known. The fact that they both follow the same pattern can partially be explained by the CHOP10 and ATF family sharing many similarities. First, the promoter of CHOP10 contains a C/EBP/ATF element that can be activated by ATF-2 (52) and ATF-4 (53). Second, both ATF-2 and CHOP10 are phosphorylated by p38 MAPK (54, 55). Third, they are both activated by cellular stressors (e.g. oxidative stress, several genotoxic reagents, UV irradiation, and inflammatory cytokines) (56–58).
Our proposed model was further supported by cotransfection studies, which demonstrated a dose-dependent inhibitory role for CHOP10 and ATF-2 overexpression in the ability of overexpressed-C/EBPβ to promote cAMP-induced Pgc-1α transcription. Co-expression of a mutated CHOP10 that carried a deletion in the leucine zipper domain with C/EBPβ did not alter the stimulatory effect of C/EBPβ overexpression on Pgc-1α transactivation, suggesting that the formation of a heterodimer with CHOP10 was necessary for its inhibitory action. Conversely, CREB had overall a positive effect on Pgc-1α transcription, and co-transfection with C/EBPβ failed to further increase Pgc-1α promoter activity in response to cAMP. Use of a multiple CRE reporter construct as a positive control in luciferase experiments also proved that overexpression of the bZIP transcriptional factors did not alter the general cell response of CRE to cAMP, emphasizing the importance of the differential combinations of bZIP family members in conferring tissue-specific cAMP-induced Pgc-1α gene expression in HIB-1B and 3T3-L1 cells. Finally, we used siRNA to demonstrate that knockdown of C/EBPβ in HIB-1B cells decreased forskolin-stimulated Pgc-1α and Ucp1 expression and that knockdown of CHOP10 increased Pgc-1α transcription in 3T3-L1 cells.
Previous studies have demonstrated synergistic cooperation between CREB and C/EBP isoforms at the promoters of several genes in response to cAMP, either by binding to separate sites, as in the Pepck gene (59), or by heterodimer formation and binding to the same response element, as exemplified by the human immunodeficiency virus type 1 long terminal repeat (60) or the human preinterleukin-1β promoter (61). Chen et al. (62) showed that C/EBPβ associates directly through its C-terminal region with the Q1 domain of CREB to increase CREB-mediated transcription in COS7 cells in vitro. C/EBPβ has also been reported to interact with CBP/p300 at a site distinct from that of CREB (63, 64), suggesting that C/EBPβ binding to CREB may recruit CBP to CREB and thus create an active CREB·C/EBPβ·CBP transcriptional complex.
A role for C/EBPβ in conferring the BAT phenotype in white adipose tissue is supported by studies in transgenic mice in which C/ebpβ was inserted in place of C/ebpα in the C/ebpα locus, resulting in maintained C/ebpβ expression during differentiation (β/β mice). β/β mice had higher energy expenditure than the control mice and failed to accumulate lipids in WAT, which was enriched in mitochondria and had increased Ucp1 mRNA and cAMP levels (65). In addition, β/β mice were protected from diet-induced weight gain, whereas no changes in the metabolic state of BAT and muscle were observed. In C/ebpβ−/− mouse fetuses, there is a decrease in Ucp1 expression and lipid accumulation in BAT compared with that from wild type, and when both C/ebpβ and C/ebpδ were deleted, Ucp1 expression was hardly detectable, and fat droplets could not accumulate in BAT, signifying the importance of C/EBPβ and C/EBPδ in Ucp1 gene regulation (33). Positive relationships between the expression of C/ebpβ, Pgc-1α, and Ucp1 mRNA have also been observed in studies during postnatal development in mice (47) and in the adipose tissue depot-specific response of differing mouse strains to cold stress (66).
In rodents, the interscapular BAT depot in non-adrenergically stimulated animals has a predominantly WAT tissue appearance, which upon cold exposure transforms into BAT, due to the increased proliferation of brown adipocytes (2, 48, 67, 68). Until very recently, it was assumed that WAT and BAT shared a common progenitor cell lineage, but recently Seale et al. (46) have demonstrated a complex interplay between myogenic, brown adipogenic, and white adipogenic differentiation, orchestrated by both PGC-1α and the PR domain-containing protein, PRDM16. In light of the results of the present paper, it would be interesting to examine the relationship between PRDM16 and C/EBPβ. In support of our findings, Tseng et al. (69) have observed a sustained increase in C/EBPβ expression during commitment of C3H101/2 mesenchymal progenitor cells to the brown adipocyte lineage induced by bone morphogenetic protein 7.
The key role of β-adrenergic signaling in the recruitment of brown adipocytes suggests that the combinatorial transcriptional factor mechanisms proposed by the present study in the regulation of Pgc-1α expression may be important in inducing Ucp1 expression, mitochondrial biogenesis, and the relative proportions of white and brown adipocytes in a depot (15, 16, 70). We have previously demonstrated that replacement of BAT with WAT in newborn lambs is due to down-regulation of adrenergic induced Ucp1 activation and repression of Pgc-1α expression (7). The question as to whether mature adipocytes can “interconvert” or whether separate pools of white and brown progenitor cells mediate “transdifferentiation” of these tissues has not been resolved. We propose that C/ebpβ plays a key role in reprogramming white adipocytes toward brown adipocyte differentiation. The data described suggest a model (Fig. 11) by which sustained C/ebpβ expression and increased cAMP sensitivity would result in increased Pgc-1α and Ucp1 expression, whereas transient expression of C/EBPβ during early stages of adipogenic conversion would lead to a WAT phenotype.
FIGURE 11.
Model for cAMP stimulation of the proximal PGC-1α promoter in 3T3-L1 cells. A hypothetical model for higher (A) and lower (B) Pgc-1α promoter activity through which the cAMP stimulation of the protein kinase A pathway can give different levels of promoter activity, depending on C/EBPβ cellular concentrations.
This work was supported by the Biotechnology and Biological Sciences Research Council and the Greek State Scholarship's Foundation.
- WAT
- white adipose tissue
- BAT
- brown adipose tissue
- PPAR
- peroxisome proliferator-activated receptor
- CRE
- cAMP-response element
- CREB
- CRE-binding protein
- CBP
- CREB-binding protein
- C/EBP
- CCAAT/enhancer-binding protein
- RT
- real time
- qRT
- quantitative RT
- siRNA
- small interfering RNA
- ChIP
- chromatin immunoprecipitation
- iBAT
- interscapular BAT
- iWAT
- interscapular WAT
- pCREB
- phospho-CREB
- pATF-2
- phospho-ATF-2.
REFERENCES
- 1.Cinti S. (2006) Nutr. Metab. Cardiovasc Dis. 16, 569–574 [DOI] [PubMed] [Google Scholar]
- 2.Loncar D. (1991) Cell Tissue Res. 266, 149–161 [DOI] [PubMed] [Google Scholar]
- 3.Ashwell M., Stirling D., Freeman S., Holloway B. R. (1987) Int. J. Obes. 11, 357–365 [PubMed] [Google Scholar]
- 4.Casteilla L., Champigny O., Bouillaud F., Robelin J., Ricquier D. (1989) Biochem. J. 257, 665–671 [DOI] [PMC free article] [PubMed] [Google Scholar]
- 5.Champigny O., Ricquier D., Blondel O., Mayers R. M., Briscoe M. G., Holloway B. R. (1991) Proc. Natl. Acad. Sci. U.S.A. 88, 10774–10777 [DOI] [PMC free article] [PubMed] [Google Scholar]
- 6.Soppela P., Nieminen M., Saarela S., Keith J. S., Morrison J. N., Macfarlane F., Trayhurn P. (1991) Am. J. Physiol. 260, R1229–R1234 [DOI] [PubMed] [Google Scholar]
- 7.Lomax M. A., Sadiq F., Karamanlidis G., Karamitri A., Trayhurn P., Hazlerigg D. G. (2007) Endocrinology 148, 461–468 [DOI] [PubMed] [Google Scholar]
- 8.Cancello R., Zingaretti M. C., Sarzani R., Ricquier D., Cinti S. (1998) Endocrinology 139, 4747–4750 [DOI] [PubMed] [Google Scholar]
- 9.Loncar D., Afzelius B. A. (1989) J. Ultrastruct. Mol. Struct. Res. 102, 9–23 [DOI] [PubMed] [Google Scholar]
- 10.Lean M. E., James W. P., Jennings G., Trayhurn P. (1986) Clin. Sci. 71, 291–297 [DOI] [PubMed] [Google Scholar]
- 11.Cannon B., Nedergaard J. (2004) Physiol. Rev. 84, 277–359 [DOI] [PubMed] [Google Scholar]
- 12.Oberkofler H., Dallinger G., Liu Y. M., Hell E., Krempler F., Patsch W. (1997) J. Lipid Res. 38, 2125–2133 [PubMed] [Google Scholar]
- 13.Garruti G., Ricquier D. (1992) Int. J. Obes. Relat. Metab. Disord. 16, 383–390 [PubMed] [Google Scholar]
- 14.Nedergaard J., Bengtsson T., Cannon B. (2007) Am. J. Physiol. Endocrinol. Metab. 293, E444–E452 [DOI] [PubMed] [Google Scholar]
- 15.Puigserver P., Wu Z., Park C. W., Graves R., Wright M., Spiegelman B. M. (1998) Cell 92, 829–839 [DOI] [PubMed] [Google Scholar]
- 16.Puigserver P., Spiegelman B. M. (2003) Endocr. Rev. 24, 78–90 [DOI] [PubMed] [Google Scholar]
- 17.Herzig S., Long F., Jhala U. S., Hedrick S., Quinn R., Bauer A., Rudolph D., Schutz G., Yoon C., Puigserver P., Spiegelman B., Montminy M. (2001) Nature 413, 179–183 [DOI] [PubMed] [Google Scholar]
- 18.Lin J., Wu H., Tarr P. T., Zhang C. Y., Wu Z., Boss O., Michael L. F., Puigserver P., Isotani E., Olson E. N., Lowell B. B., Bassel-Duby R., Spiegelman B. M. (2002) Nature 418, 797–801 [DOI] [PubMed] [Google Scholar]
- 19.Rosen E. D., Walkey C. J., Puigserver P., Spiegelman B. M. (2000) Genes Dev. 14, 1293–1307 [PubMed] [Google Scholar]
- 20.Montminy M. R., Bilezikjian L. M. (1987) Nature 328, 175–178 [DOI] [PubMed] [Google Scholar]
- 21.Shaywitz A. J., Greenberg M. E. (1999) Annu. Rev. Biochem. 68, 821–861 [DOI] [PubMed] [Google Scholar]
- 22.Bakker O., Parker M. G. (1991) Nucleic Acids Res. 19, 1213–1217 [DOI] [PMC free article] [PubMed] [Google Scholar]
- 23.Roesler W. J., Park E. A., McFie P. J. (1998) J. Biol. Chem. 273, 14950–14957 [DOI] [PubMed] [Google Scholar]
- 24.Maekawa T., Sakura H., Kanei-Ishii C., Sudo T., Yoshimura T., Fujisawa J., Yoshida M., Ishii S. (1989) EMBO J. 8, 2023–2028 [DOI] [PMC free article] [PubMed] [Google Scholar]
- 25.Karamanlidis G., Karamitri A., Docherty K., Hazlerigg D. G., Lomax M. A. (2007) J. Biol. Chem. 282, 24660–24669 [DOI] [PubMed] [Google Scholar]
- 26.Yeh W. C., Cao Z., Classon M., McKnight S. L. (1995) Genes Dev. 9, 168–181 [DOI] [PubMed] [Google Scholar]
- 27.Umek R. M., Friedman A. D., McKnight S. L. (1991) Science 251, 288–292 [DOI] [PubMed] [Google Scholar]
- 28.Cao Z., Umek R. M., McKnight S. L. (1991) Genes Dev. 5, 1538–1552 [DOI] [PubMed] [Google Scholar]
- 29.Tontonoz P., Hu E., Graves R. A., Budavari A. I., Spiegelman B. M. (1994) Genes Dev. 8, 1224–1234 [DOI] [PubMed] [Google Scholar]
- 30.Rosen E. D., Hsu C. H., Wang X., Sakai S., Freeman M. W., Gonzalez F. J., Spiegelman B. M. (2002) Genes Dev. 16, 22–26 [DOI] [PMC free article] [PubMed] [Google Scholar]
- 31.Tang Q. Q., Lane M. D. (2000) Proc. Natl. Acad. Sci. U.S.A. 97, 12446–12450 [DOI] [PMC free article] [PubMed] [Google Scholar]
- 32.Nedergaard J., Petrovic N., Lindgren E. M., Jacobsson A., Cannon B. (2005) Biochim. Biophys. Acta 1740, 293–304 [DOI] [PubMed] [Google Scholar]
- 33.Tanaka T., Yoshida N., Kishimoto T., Akira S. (1997) EMBO J. 16, 7432–7443 [DOI] [PMC free article] [PubMed] [Google Scholar]
- 34.Park E. A., Gurney A. L., Nizielski S. E., Hakimi P., Cao Z., Moorman A., Hanson R. W. (1993) J. Biol. Chem. 268, 613–619 [PubMed] [Google Scholar]
- 35.Roesler W. J. (2000) Mol. Cell. Endocrinol. 162, 1–7 [DOI] [PubMed] [Google Scholar]
- 36.Brenner S., Prösch S., Schenke-Layland K., Riese U., Gausmann U., Platzer C. (2003) J. Biol. Chem. 278, 5597–5604 [DOI] [PubMed] [Google Scholar]
- 37.Rehnmark S., Antonson P., Xanthopoulos K. G., Jacobsson A. (1993) FEBS Lett. 318, 235–241 [DOI] [PubMed] [Google Scholar]
- 38.Manchado C., Yubero P., Viñas O., Iglesias R., Villarroya F., Mampel T., Giralt M. (1994) Biochem. J. 302, 695–700 [DOI] [PMC free article] [PubMed] [Google Scholar]
- 39.Ross S. R., Choy L., Graves R. A., Fox N., Solevjeva V., Klaus S., Ricquier D., Spiegelman B. M. (1992) Proc. Natl. Acad. Sci. U.S.A. 89, 7561–7565 [DOI] [PMC free article] [PubMed] [Google Scholar]
- 40.Ron D., Habener J. F. (1992) Genes Dev. 6, 439–453 [DOI] [PubMed] [Google Scholar]
- 41.Cao W., Daniel K. W., Robidoux J., Puigserver P., Medvedev A. V., Bai X., Floering L. M., Spiegelman B. M., Collins S. (2004) Mol. Cell. Biol. 24, 3057–3067 [DOI] [PMC free article] [PubMed] [Google Scholar]
- 42.Descombes P., Schibler U. (1991) Cell 67, 569–579 [DOI] [PubMed] [Google Scholar]
- 43.Miller O. J., Schnedl W., Allen J., Erlanger B. F. (1974) Nature 251, 636–637 [DOI] [PubMed] [Google Scholar]
- 44.Tang Q. Q., Lane M. D. (1999) Genes Dev. 13, 2231–2241 [DOI] [PMC free article] [PubMed] [Google Scholar]
- 45.Puigserver P., Ribot J., Serra F., Gianotti M., Bonet M. L., Nadal-Ginard B., Palou A. (1998) Eur. J. Cell Biol. 77, 117–123 [DOI] [PubMed] [Google Scholar]
- 46.Seale P., Bjork B., Yang W., Kajimura S., Chin S., Kuang S., Scimè A., Devarakonda S., Conroe H. M., Erdjument-Bromage H., Tempst P., Rudnicki M. A., Beier D. R., Spiegelman B. M. (2008) Nature 454, 961–967 [DOI] [PMC free article] [PubMed] [Google Scholar]
- 47.Rim J. S., Xue B., Gawronska-Kozak B., Kozak L. P. (2004) J. Biol. Chem. 279, 25916–25926 [DOI] [PubMed] [Google Scholar]
- 48.Himms-Hagen J., Melnyk A., Zingaretti M. C., Ceresi E., Barbatelli G., Cinti S. (2000) Am. J. Physiol. Cell Physiol. 279, C670–C681 [DOI] [PubMed] [Google Scholar]
- 49.Wang H., Peiris T. H., Mowery A., Le Lay J., Gao Y., Greenbaum L. E. (2008) Mol. Endocrinol. 22, 1596–1605 [DOI] [PMC free article] [PubMed] [Google Scholar]
- 50.Zhang X., Odom D. T., Koo S. H., Conkright M. D., Canettieri G., Best J., Chen H., Jenner R., Herbolsheimer E., Jacobsen E., Kadam S., Ecker J. R., Emerson B., Hogenesch J. B., Unterman T., Young R. A., Montminy M. (2005) Proc. Natl. Acad. Sci. U.S.A. 102, 4459–4464 [DOI] [PMC free article] [PubMed] [Google Scholar]
- 51.Landschulz W. H., Johnson P. F., Adashi E. Y., Graves B. J., McKnight S. L. (1988) Genes Dev. 2, 786–800 [DOI] [PubMed] [Google Scholar]
- 52.Bruhat A., Jousse C., Carraro V., Reimold A. M., Ferrara M., Fafournoux P. (2000) Mol. Cell. Biol. 20, 7192–7204 [DOI] [PMC free article] [PubMed] [Google Scholar]
- 53.Averous J., Bruhat A., Jousse C., Carraro V., Thiel G., Fafournoux P. (2004) J. Biol. Chem. 279, 5288–5297 [DOI] [PubMed] [Google Scholar]
- 54.Wang X. Z., Ron D. (1996) Science 272, 1347–1349 [DOI] [PubMed] [Google Scholar]
- 55.Cao W., Collins Q. F., Becker T. C., Robidoux J., Lupo E. G., Jr., Xiong Y., Daniel K. W., Floering L., Collins S. (2005) J. Biol. Chem. 280, 42731–42737 [DOI] [PubMed] [Google Scholar]
- 56.Luethy J. D., Fargnoli J., Park J. S., Fornace A. J., Jr., Holbrook N. J. (1990) J. Biol. Chem. 265, 16521–16526 [PubMed] [Google Scholar]
- 57.Clerk A., Sugden P. H. (1997) Biochem. J. 325, 801–810 [DOI] [PMC free article] [PubMed] [Google Scholar]
- 58.Sugden P. H., Clerk A. (1997) Biochem. Soc. Trans. 25, 221S. [DOI] [PubMed] [Google Scholar]
- 59.Roesler W. J., Graham J. G., Kolen R., Klemm D. J., McFie P. J. (1995) J. Biol. Chem. 270, 8225–8232 [DOI] [PubMed] [Google Scholar]
- 60.Ross H. L., Nonnemacher M. R., Hogan T. H., Quiterio S. J., Henderson A., McAllister J. J., Krebs F. C., Wigdahl B. (2001) J. Virol. 75, 1842–1856 [DOI] [PMC free article] [PubMed] [Google Scholar]
- 61.Tsukada J., Saito K., Waterman W. R., Webb A. C., Auron P. E. (1994) Mol. Cell. Biol. 14, 7285–7297 [DOI] [PMC free article] [PubMed] [Google Scholar]
- 62.Chen Y., Zhuang S., Cassenaer S., Casteel D. E., Gudi T., Boss G. R., Pilz R. B. (2003) Mol. Cell. Biol. 23, 4066–4082 [DOI] [PMC free article] [PubMed] [Google Scholar]
- 63.Mink S., Haenig B., Klempnauer K. H. (1997) Mol. Cell. Biol. 17, 6609–6617 [DOI] [PMC free article] [PubMed] [Google Scholar]
- 64.Kovács K. A., Steinmann M., Magistretti P. J., Halfon O., Cardinaux J. R. (2003) J. Biol. Chem. 278, 36959–36965 [DOI] [PubMed] [Google Scholar]
- 65.Chiu C. H., Lin W. D., Huang S. Y., Lee Y. H. (2004) Genes Dev. 18, 1970–1975 [DOI] [PMC free article] [PubMed] [Google Scholar]
- 66.Xue B., Rim J. S., Hogan J. C., Coulter A. A., Koza R. A., Kozak L. P. (2007) J. Lipid Res. 48, 41–51 [DOI] [PubMed] [Google Scholar]
- 67.Cousin B., Cinti S., Morroni M., Raimbault S., Ricquier D., Pénicaud L., Casteilla L. (1992) J. Cell Sci. 103, 931–942 [DOI] [PubMed] [Google Scholar]
- 68.Guerra C., Koza R. A., Yamashita H., Walsh K., Kozak L. P. (1998) J. Clin. Invest. 102, 412–420 [DOI] [PMC free article] [PubMed] [Google Scholar]
- 69.Tseng Y. H., Kokkotou E., Schulz T. J., Huang T. L., Winnay J. N., Taniguchi C. M., Tran T. T., Suzuki R., Espinoza D. O., Yamamoto Y., Ahrens M. J., Dudley A. T., Norris A. W., Kulkarni R. N., Kahn C. R. (2008) Nature 454, 1000–1004 [DOI] [PMC free article] [PubMed] [Google Scholar]
- 70.Tiraby C., Tavernier G., Lefort C., Larrouy D., Bouillaud F., Ricquier D., Langin D. (2003) J. Biol. Chem. 278, 33370–33376 [DOI] [PubMed] [Google Scholar]


