

Abstract
Time-of-flight secondary ion mass spectrometry (ToF-SIMS) is a surface analysis technique well-suited to detect and identify trace surface species. With the latest analyzers, ion sources and data analysis methods, imaging ToF-SIMS provides detailed 2-D and 3-D surface reactivity maps. Coupling multivariate analysis methods such as principal component analysis (PCA) with ToF-SIMS provides a powerful method for differentiating spatial regions with different chemistries. ToF-SIMS and PCA are used in this study to image and analyze a two-component photolithograph-patterned surface chemistry currently published and commercialized for bioassays, bio-chips and cell-based biosensors. A widely used reactive surface coupling chemistry, N-hydroxysuccinimide (NHS), and 2-methoxyethylamine (MeO) were co-patterned into adjacent regions on a commercial microarray polymer coating using standard photolithography methods involving deposition, patterning and removal of a routinely used photoresist material. After routine processing, ToF-SIMS and PCA of the patterned surface revealed significant residual photoresist material remaining at the interface of the NHS/MeO patterns, as well as lower concentrations of residual photoresist material remaining within the MeO-containing regions, providing spatial mapping and residue analysis not evident from other characterization techniques. As detection of surface photoresist residue remains an inherent challenge in photolithographic processing of a wide array of materials, the use of ToF-SIMS coupled with PCA is shown to be a high-resolution characterization tool with the high sensitivity and specificity required for surface quality control measurements following photolithography and pattern development relevant to many current processes.
Keywords: ToF-SIMS, principal component analysis, photolithography, photoresist, surface analysis, pattern
Introduction
Functional surface patterning methods continue to evolve and contribute fundamental, practical and technological capabilities in more sophisticated ways and intricate dimensions. Traditionally developed for photolithography applications in microelectronics, patterning methods are now extended routinely into many science and technology areas. Photoresist resins and related lithographic techniques are pervasive and adapted to many uses in surface patterning and also to create complex buried interfaces. [1-3] After surface deposition and photo- or thermal- curing using precise masking technologies, photoresist materials are routinely subject to selective removal by solvents or plasma etching. Reliable resist material and residue removal is often presumed; many of these methods are decades old with proven protocols, while some have been developed more recently. [4] Residual photoresist materials remaining after development have been previously detected by microscopy, [5] spectroscopic [6] and other analytical methods. [7] Previous studies have been focused on detecting generic undesired organic species on inorganic or metallic substrates. With increasing use of photolithography on complex organic (i.e., polymer) interfaces, the need to quantify and spatially identify trace photoresist materials becomes more challenging compared to the traditional microelectronic concerns of organic contaminant detection on silicon wafers and other semiconductors. This is especially true in emerging biotechnology applications involving surface micro-patterning (flow cells, microseparation, drug delivery devices, living cell manipulation systems, microelectronic biosensors, multiplexed diagnostic tooling, lab-on-chip instruments, etc.). The ability to detect, image and identify sub-monolayer levels of organic photoresist material on organic polymer surfaces requires the surface sensitivity, spatial resolution and chemical specificity of time-of-flight secondary ion mass spectrometry (ToF-SIMS).
Photolithography and other patterning methods are extensively used for the immobilization of proteins and other bioactive molecules for biomedical applications.[8-10] These patterns are used to spatially localize and control the activities of different biological components (e.g., cells, nucleic acids, bacteria, enzymes) for mechanistic studies and technological applications. Typically, surface reactive chemistry used for bio-immobilization is co-patterned with other chemistries known to resist the non-specific, ubiquitous adsorption of the wide range of biomolecules found in many complex biological systems.[11] Among many examples, [12-16] we have recently reported the surface patterning of a commercial poly(ethylene glycol) (PEG)-based polymer surface coating[17] to produce regular patterns of selective immobilization zones containing N-hydroxysuccinimide (NHS) “active ester” chemical reactivity with zones of highly biologically inert surface species.[18] Highly reactive towards amine-based nucleophiles [19, 20] commonly found in a range of biomolecules such as proteins, DNA and cells, as well as many other coupling agents (e.g., silanes, adhesive polymers), NHS is widely used as an activating reagent for carboxylic acid-based coupling in biochemistry, specifically in bioconjugation and bio-immobilization, as well as in a number of commercial chemistry kits and assays, including bio-diagnostic arrays, [21-26] bio-chips[27] and biosensors.[28-30] In addition to its high reactivity to amines, NHS is also readily reactive to water (both liquid and vapor) resulting in NHS hydrolysis and inactivation in aqueous solutions and ambient humidity.[19, 31, 32]
Despite the use of NHS in thousands of publications and many commercial technologies, quality control methods to assess NHS activity and hydrolysis on surfaces for immobilization reaction efficiency are not readily available. To address this need, we recently reported a model surface analytical system based on thiolalkylated NHS-oligo(ethylene glycol) (OEG) self-assembled organic monolayers (SAMs) on gold to understand the hydrolysis, regeneration and reactivity of NHS on surfaces used in biological applications.[31] Surface analytical metrics to distinguish the NHS active ester from hydrolyzed inactive forms used combinations of X-ray photoelectron spectroscopy (XPS) and ToF-SIMS data with principal component analysis (PCA). From these data, ready assessment of NHS activity versus hydrolysis could be unequivocally and reliably produced for these model surfaces. The surface analytical metrics were then extended to a more complex commercial NHS-PEG surface coating chemistry [17] in patterning studies exploiting imaging ToF-SIMS capabilities.[18] Imaging of distinct surface chemistries in the patterned PEG coating were generated and used to identify specific surface patterns of NHS reactivity and, importantly, specific NHS reactions with biomolecules and capping nucleophiles (methoxy inactivation). Thus, when this patterned slide was exposed to amine-terminated biomolecules, only the NHS regions selectively immobilized these biomolecules. [18] Imaging ToF-SIMS combined with PCA was a critical analysis tool used to differentiate between the biologically active and inactive capped or hydrolyzed regions.
The present work utilizes these recently developed methods to provide two further surface analytical enhancements to the NHS analysis on commercial reactive PEG-based coatings: 1) surface analysis methods to assess the NHS chemical regeneration strategies reported earlier for nucleic acid immobilization, [32] and 2) identification of unique surface markers for photoresist residue contamination left on these patterned surfaces after common photolithography development processes.
Experimental Section
Photolithographic Patterning of NHS-containing Reactive Polymer Coatings
The process used to obtain the desired NHS reactive group surface patterns by conventional photolithography on the commercial polymer substrate is shown in Scheme S1 (see Supplementary Information). As reported in our recent article [18], photoresist resin (Shipley SPR-220) mixed with isopropanol (ratio of 9:11 v/v) was pipet-dispensed onto uniformly NHS-derivatized PEG-based coatings on microarray slides (1″×3″ low fluorescence glass support, Optichem® coating, Accelr8 Technology Corp., Denver, CO; also known as Slide-H, Schott-Nexterion). Each slide covered with the photoresist solution was spun at 3500rpm for 75 sec. and cured at 100°C under vacuum (ca. 0.1mmHg) for 5 min. After cooling, a commercially printed photomask generated from computer graphics and printed at 5080 DPI (with 5 micron resolution) was set over the coating and exposed to UV irradiation under a metal halide curing lamp (UV Process Supply, Inc.) for 30 sec. After 75 sec of immersion in developer solution (Mirochem MF-319), the slides were rinsed with water and dried under N2 gas. This removed developed photoresist material in patterns from specific areas of the substrate. The exposed (developed) areas were selectively converted to methoxy-terminated (MeO) patterned regions by slide immersion into a 50mM solution of 2-methoxyethylamine in 50 mM borate buffer at pH 9 for 1 hour. After rinsing with water and drying, the slide was then lightly sonicated in dimethylsulfoxide (DMSO), acetone and then isopropanol for 20 sec each to remove the remaining photoresist from the protected NHS-PEG patterns, then washed with water and immediately dried by centrifugation. This procedure (see Supplementary Scheme S1) was shown to produce alternating NHS- and MeO-terminated coating patterns. [18] Pattern line resolution on the polymer surface was similar to the 5 micron mask resolution. While both pattern precision and line resolution can be enhanced by improving the photomask quality and further optimization of the patterning process, this issue does not affect any results or conclusions from the current study.
Surface Hydrolysis and NHS Regeneration
Deliberate hydrolysis of the NHS group from the patterns was achieved by immersing both unpatterned and patterned slides in Milli-Q pure water for 24 hours. These hydrolyzed samples were analyzed by XPS and ToF-SIMS, then regenerated with NHS chemistry using a common carbodiimide-catalyzed surface re-esterification as previously reported. [31, 32] Samples were blown dry after both hydrolysis and regeneration steps before XPS and ToF-SIMS analysis.
Control Photoresist and NHS Samples
Photoresist resin (Shipley SPR 220) was uniformly spread onto a conventional glass slide for use as a control sample in the ToF-SIMS studies. For studying the variation in secondary ion yields of NHS fragments on the type of matrix surrounding the NHS groups, NHS was spin coated onto gold, silicon, glass and MeO-capped Optichem® substrates. For these experiments excess 1.1 M NHS (in water) was dropped onto the substrates and then spread across the surface by spinning the substrates at 400-500 rpm for a minute. These substrates were then spun at a high speed (1000-1500 rpm) for a minute to remove excess NHS.
XPS Analysis of Polymer Surfaces
XPS measurements were performed on a Kratos Axis Ultra DLD X-ray photoelectron spectrometer (Kratos Analytical, Manchester, UK) employing a hemispherical analyzer for spectroscopy and a spherical mirror analyzer for imaging. Spectra were acquired with a monochromated Al-Kα X-ray source at a 0-degree photoelectron take-off angle (TOA) in the “hybrid” mode. The TOA is defined as the angle between the sample surface normal and the axis of the XPS analyzer lens. This condition produces a sampling depth of approximately 10 nm. A low-energy electron flood gun was used to minimize surface charging. XPS data were collected using an analysis area of 700 mm × 300 mm. For each sample, an initial compositional survey scan was acquired, followed by a detailed elemental scans using a pass energy of 80eV. High-resolution C1s spectra were also acquired using a pass energy of 20eV and were charge-referenced to the C1s hydrocarbon peak at 285.0eV. Surface elemental compositions reported for the fresh, hydrolyzed, and regenerated OptiChem® slides were averages of values determined from three spots on each sample.
ToF-SIMS Analysis of Polymer Surfaces
ToF-SIMS data for patterned and unpatterned surfaces were acquired on an ION-TOF 5-100 instrument (ION-TOF GmbH, Münster, Germany) using a Bi3+ primary ion source. Positive and negative ion images were acquired with a pulsed 25 keV, 1.3 pA primary ion beam in high current bunched mode (i.e., high mass resolution mode) from 500 μm × 500 μm areas on the sample surfaces; spectra from control samples were acquired from 100 μm × 100 μm areas. All images contained 128 × 128 pixels. These analysis conditions resulted in spatial resolution of approximately 4 microns. All data were collected using an ion dose below the static SIMS limit of 1×10¹² ions/cm2. A low-energy electron beam was used for charge compensation on the polymer surface samples. The mass resolution (m/Δm) of the negative secondary ion spectra was typically between 6000 and 7500 for the m/z = 25 peak. The m/Δm of the positive secondary ion spectra was typically between 7000 and 8500 for the m/z = 27 peak. For principal component analysis, peaks were selected from m/z 1 to m/z 200; these peaks were mean centered and normalized to the total ion intensity. PCA was then performed on this dataset as described previously using a series of scripts written by NESAC/BIO for MATLAB (MathWorks, Inc., Natick, MA). [33-35] PCA data were then used to build PCA scores images of the surfaces. The spatial resolution of the ToF-SIMS images was determined to be 6.0 ± 0.4 μm as derived from multiple line scans across the NHS/MeO interface, which was similar to the 5 μm photomask resolution.
Results and Discussion
Spectral Analysis of NHS-bearing Polymer Films
Initially, XPS and ToF-SIMS experiments were performed on polymer films uniformly modified with fresh, hydrolyzed and regenerated NHS surfaces. The XPS nitrogen signals were used to examine the presence of NHS chemistry on the samples (Supplementary Table S1, see supplementary information). As the Optichem® polymer coating has more than one nitrogen-containing species, the XPS nitrogen atomic percentage cannot be used to uniquely quantify the NHS concentration. Thus, changes in the XPS nitrogen concentration observed for the fresh, hydrolyzed and regenerated slides are significantly smaller than those observed for the previous model NHS SAM-on-gold system where nitrogen is unique to the NHS group. [31] Therefore, to obtain more chemical specificity and sensitivity, ToF-SIMS was utilized to study the surface fragments originating from the fresh and hydrolyzed polymer-coated surfaces. Theoretically, signature NHS fragments should be present on the fresh slides and absent on hydrolyzed slides. To investigate if this difference is observed, PCA methods were used to process the complex ToF-SIMS dataset and quantitatively visualize the relationship between these two surfaces. PC1 scores of negative ion data (see inset in Figure 1) show that the two polymer samples were clearly differentiated, consistent with previous studies. [18, 31] The PC1 loadings plot (Figure 1) showed the characteristic peaks from the fresh and hydrolyzed polymer films. In particular, peaks at m/z 98 (C4H4NO2-) and 114 (C4H4NO3-) are fragments from the NHS five-member ring. These two fragments can be used as NHS-specific markers to monitor NHS surface chemistry in the reactive commercial polymer coating. Peaks at m/z 58 (C2H2O2-) and 43 (C2H3O-) are fragments from the carboxylate group produced by NHS hydrolysis. A detailed peak assignment of the main ToF-SIMS fragment peaks observed in the PC1 loadings is listed in the supplementary information (see Table S2).
Figure 1.
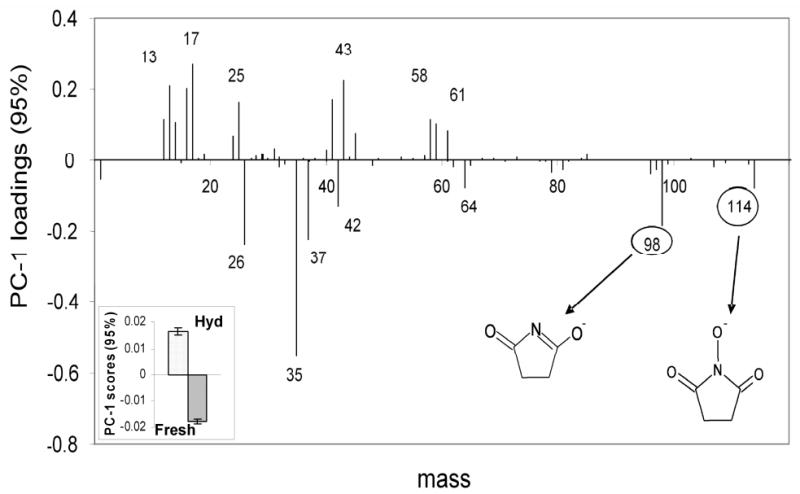
Loadings and scores (inset) plot for PC1 (95% variance) for ToF-SIMS data from fresh and hydrolyzed NHS slides. Peaks at m/z 98 and 114 are NHS specific fragments and load with the fresh samples, confirming the presence of NHS on those samples. Peaks at m/z 43 and 58 are fragments from the carboxyl groups produced by NHS hydrolysis and load with the hydrolyzed sample.
Compared to the well-defined NHS SAMs, [31] the present polymer chemistry reveals that some NHS characteristic fragments in the positive ion spectra are not as prominent in the polymer ToF-SIMS spectra. For example, the high-mass NHS-related fragments present in the model NHS SAMs positive secondary ion spectra that contain both the succinimidyl ring and components of the ester-linked ethylene glycol chain (e.g., m/z 116, 128, 142, 170) [31] were not detectable in the polymer film spectra. However, the high-mass fragment detected in the negative ToF-SIMS polymer spectra at m/z 129 (see Table S2) is also NHS-specific and attributed to the presence of covalently bound NHS chemistry in these coatings. [31] Thus, the intensity of this peak can be used to determine the presence and relative amount of covalently attached active ester NHS groups. However, the intensity of the peak at m/z 129 is very weak compared to the intensities of other lower m/z NHS fragments, which is the reason it is not prominent in the PC loadings plots. In addition, successful selective peptide and protein attachment fidelity to the NHS regions of the patterned coatings provides indirect evidence that the NHS molecules on the polymer surfaces are indeed chemically reactive. [18]
One reason for the absence of high mass NHS-related peaks in the positive secondary ion spectra from the polymer surfaces could be the approximately 100-fold lower surface concentration of NHS molecules on these surfaces relative to the SAM surfaces. It is also possible that gold surfaces enhance positive mass ion fragment yields from the NHS SAM molecules (i.e., a matrix effect). [36, 37] Thus, analysis of NHS molecules adsorbed onto different substrates was carried out to examine possible matrix effects. NHS was spin-coated onto silicon, glass and gold surfaces, as well as the MeO-terminated polymer surface, and the intensity of the characteristic positive and negative NHS fragments (m/z = 98.024 for C4H4O2N+ and C4H4NO2-) from these surfaces were compared. Figure 2 clearly shows that the intensity of the NHS m/z 98 peak (C4H4O2N+) in the positive spectra is almost negligible from all the substrates except gold. However, the intensity of the NHS m/z 98 peak (C4H4NO2-) in the negative spectra is significant and readily detectable for all substrates (note the different y-axis scales for the positive and negative spectra in Figure 2). Although the C4H4NO2- peak intensity did vary with substrate, significant matrix effects should not be present in the ToF-SIMS images of the patterned polymer surface since the same base polymer is present across the entire surface of these samples. High-mass NHS fragments in the positive spectra were also not observed when ToF-SIMS was conducted on the patterned polymer substrates. [18] All spectra in Figure 2 have been normalized with respect to the total ion intensity. The m/z 98 and 114 peaks in the negative spectra were primarily used for identification of NHS groups, since they exhibit significant intensities on the polymer substrates. Interestingly, the positive spectrum m/z 98 peak in the model SAM NHS film on gold was almost 5 times more intense than the control spun-coated film of NHS alone on gold surface (data not shown), suggesting that the presentation of the NHS molecules on the gold surface may also play a role in the ToF-SIMS fragmentation process and secondary ion yields.
Figure 2.
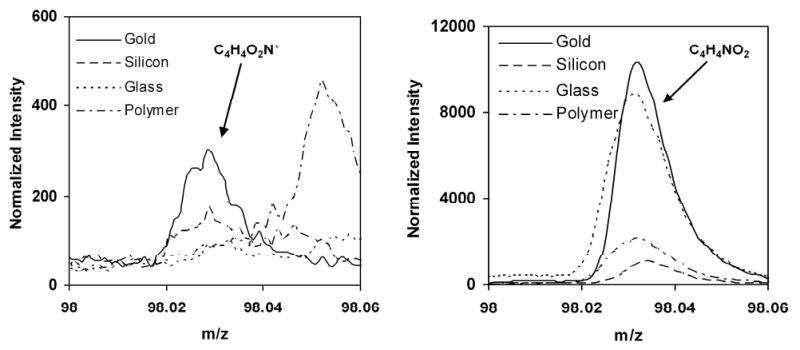
Positive and negative ToF-SIMS m/z 98 fragment intensities from NHS-covered gold, silicon, glass and polymer substrates.
The ToF-SIMS analysis of hydrolyzed surfaces showed a marked decrease in the m/z 98 and 114 peaks intensities, whereas the NHS-regenerated polymer surfaces yielded negative ion peaks at m/z 98, 114 and 129. This supports the conclusion that covalently bound NHS groups can be successfully reintroduced to the hydrolyzed surfaces, allowing inactivated surfaces to easily be re-activated for use. [31] Figure 3 shows normalized intensities of these peaks for the fresh, hydrolyzed and regenerated polymer surfaces. Clear differences are noted that distinguish these surfaces in terms of the intensity of characteristic NHS peaks. These peaks can be reliably used to map the spatial localization of the NHS chemistry using ion selective surface imaging. [18] Identical treatments for film hydrolysis and NHS regeneration conducted on MeO-terminated polymer films produced no observable m/z peaks at 98, 114 and 129, as expected. This information from the unpatterned control samples provides the basis for interpreting the ToF-SIMS results from the lithographed patterned polymer coatings.
Figure 3.
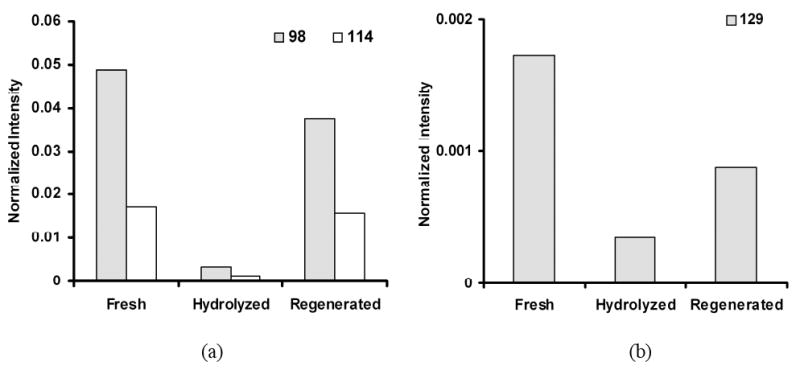
Normalized intensities of negative ion fragments at m/z (a) 98, 114 and (b) 129 for fresh, hydrolyzed and regenerated slides. Fragment intensity was calculated from the spectra regenerated from 100 μm × 100 μm areas in the NHS region of the ToF-SIMS images.
ToF-SIMS Imaging and Principal Component Analysis of Patterned Polymer Films
ToF-SIMS imaging was conducted on fresh, hydrolyzed and regenerated NHS-patterned coatings. Supplemental Figure S1 shows the computer-generated photomask pattern used for preparing the patterned surfaces. The wheel pattern diameter is 3 mm, and all ToF-SIMS images presented here have a size of 500 μm × 500 μm. PCA was extensively used to study the complex ToF-SIMS dataset obtained from these patterned surfaces. PCA is a multivariate analysis tool used to decrease dimensionality of complex datasets for easier analysis and interpretation. PCA methods transform the data to a new coordinate system so that the greatest variance in the dataset is contained in the first transformed variable, referred as first principal component (PC1). Then the second greatest variance is contained in PC2, the third greatest variance in PC3, and so on. PCA of the negative ToF-SIMS images over the spectral range from m/z = 1 and m/z = 200 produced the PC1 and PC3 scores image and loadings plots shown in Figure 4 for the fresh, patterned polymer surfaces. The pattern is characterized by specific ToF-SIMS ion yields and shows the ability of PCA to consistently discriminate aspects of surface chemistry for the NHS-bearing regions in the wheel from the alternating regions of patterned methoxy chemistry (C3H7NO- at m/z 73). PC1 contains the maximum variance in the dataset and separates the two regions based on the presence/absence of the NHS and MeO fragments, as shown in Figure 4 and discussed in greater detail previously.[18] The presence of an interfacial micron-dimension “border zone” of chemistry between the spokes of the wheel pattern distinguishable in total ion images, selected ion images and several different loadings plots has also been noted previously but not analyzed. [18] This unique chemistry pattern is primarily attributed to the m/z 107 peak shown in the PC3 scores and loading plots (Figure 4). The PC2 scores and loadings plots (Supplementary Figure S2) also show this difference, but it is more readily visible in the PC3 scores and loadings plots. This peak in the negative secondary ion spectrum, along with the peak at m/z 121 in the positive spectrum, is the strongest ToF-SIMS peak in the photoresist control sample (Supplementary Figure S3). Thus, incomplete photoresist removal by the solvent etch process portion of the lithographic processing is responsible for this interfacial pattern. This incomplete removal could be due to more extensive photo-crosslinking through the pattern mask interface at the pattern interface during pattern formation.[18] Photoexposure doses during pattern curing are possibly different in this region, resulting in increased UV exposure at the interface. Cross-linking and hardening of the interfacial photoresist would make solvent removal more difficult. Significantly, atomic force microscopy (AFM) analysis across the patterned interfacial zone (contact mode, dessicated surface post-solvent processing, data not shown) produced no evidence that these interfacial features detected by ToF-SIMS and PCA imaging were topologically distinguishable as surface ridges or trenches. As these trace co-planar photoresist interfacial patterns are observed on all patterned samples, this is a general phenomena for this polymer surface.
Figure 4.
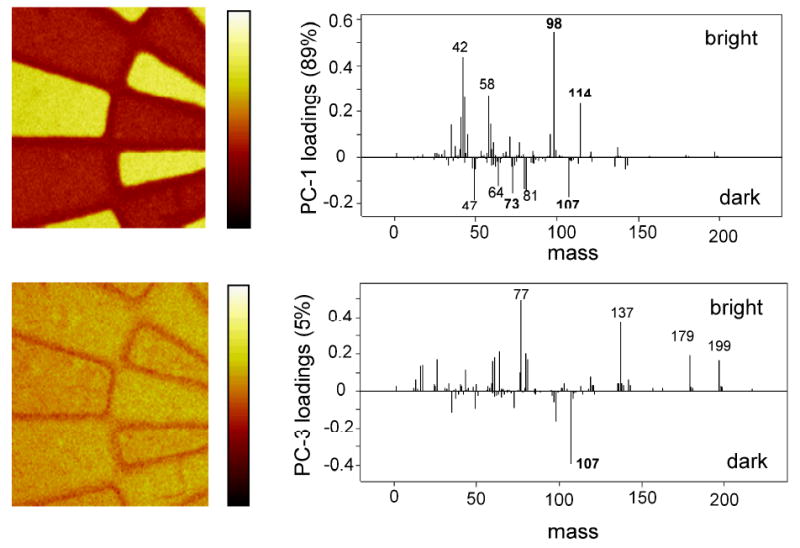
PC1 (89% variance; top) and PC3 (5% variance; bottom) scores images (left) and loadings plots (right) for negative ions from PCA processing of ToF-SIMS images over the spectral range from m/z = 1 to 200 for the fresh NHS-patterned polymer coating. The m/z peaks at 98 and 114 are characteristic of NHS region, whereas the peak at 73 is characteristic of the MeO-terminated region. The peak at m/z 107 is characteristic of the photoresist material residual from the process solvent removal routine. Dark-bright image contrast indicates an interfacial border region of unique chemistry attributed to the residual photoresist material. Image size is 500 μm × 500 μm.
Slow hydrolysis by ambient humidity and rapid hydrolysis in bulk water, regardless of pH, has been a challenge for NHS surfaces.[19] This loss of reactivity has been shown to affect DNA immobilization in arrays on NHS-active commercial slides, prompting development of a regeneration method to reactivate NHS chemistry in situ to permit consistent and reliable NHS-mediated surface immobilization. [32] Therefore, controlled NHS hydrolysis and regeneration of the patterned polymer surfaces was studied. Figure 5 shows the ToF-SIMS normalized image data from fresh, hydrolyzed and regenerated polymer surfaces. Ion peaks associated with NHS (42, 98 and 114) [18, 31] clearly disappeared from NHS-patterned areas of the hydrolyzed surface and re-appear after the NHS regeneration step. Relevant NHS peak intensities from the regenerated surfaces are lower than the fresh NHS-containing samples, also observed for the control NHS surfaces (see Figure 3). Incomplete NHS regeneration on the polymer-coated slides is consistent with our previous studies on the model NHS SAMs on gold surface. [31] In contrast to the behavior of the NHS related peaks, the m/z 107 peak intensity from the photoresist material remains fairly constant throughout the hydrolysis and regeneration treatment. That additional processing steps do not affect the robust photoresist residue is not surprising since it was not completely removed during solvent etching in the lithographic process.
Figure 5.
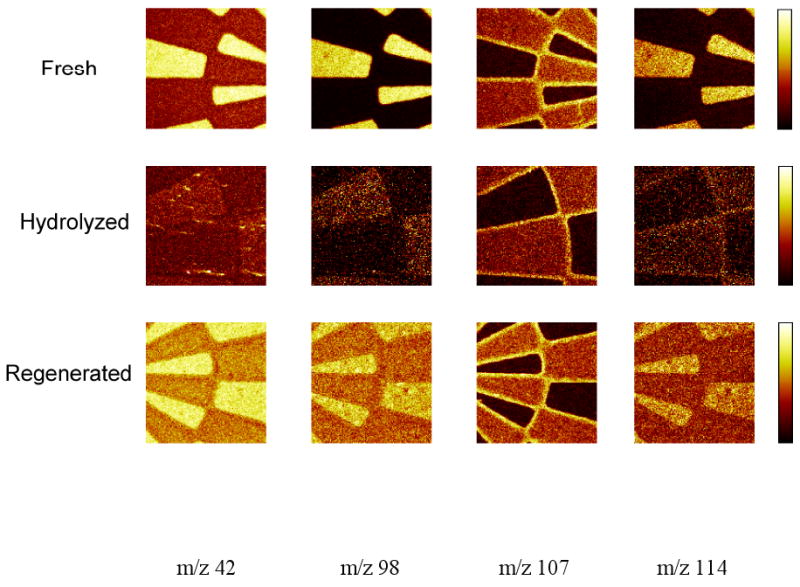
Negative ToF-SIMS ion images showing bright mapping areas selected for m/z 42, 98, 107 and 114 fragments from fresh, hydrolyzed and regenerated photo-patterned commercial polymer surfaces. Image size is 500 μm × 500 μm.
PCA conducted on ToF-SIMS images from these three surfaces allowed separation of the ion fragments associated with the hydrolysis and regeneration. Figure 6 show the scores and loadings plots for the hydrolyzed and regenerated surfaces. PCA clearly identifies and discriminates chemical differences between the two patterned regions in both the NHS hydrolyzed and regenerated samples. The negative ion fragments at m/z 58 (C2H2O2-) and 43 (C2H3O-) result from the carboxyl group produced by NHS hydrolysis, [18, 31] and load in the NHS-hydrolyzed region (Figure 6). It is important to observe that these fragments are also detected from the fresh and regenerated surfaces since the NHS groups are bound to the polymer via carboxylate groups. However, these fragments are significantly less intense from fresh and regenerated surface so they can be used to follow the extent of surface hydrolysis. Negative ion fragments at m/z 114 (C4H4NO3-) and 98 (C4H4NO2-) are characteristic of the NHS molecule and appear upon regeneration of the sample. The negative ion at m/z 107 is characteristic of the photoresist residue. Table 1 shows normalized ion fragment intensities, as described in the footnote, for selected ions relevant to this analysis. The normalized intensity of the peaks is calculated from a spectrum regenerated from 100 μm × 100 μm areas within the NHS region of the respective ToF-SIMS images. Normalized NHS ion intensities decrease when the sample is hydrolyzed, then increase after the regeneration step. Hydrolysis of the NHS molecules also results in an increase in the intensity of the carboxylic acid fragment at m/z 58. Another important observation is that the ratio of the putative photoresist m/z 107 peak to total ion yield, Rphotoresist, remains constant during hydrolysis and regeneration, indicating that the photoresist residue is robust, unchanged after solvent processing, and does not interfere with these treatments of the slide. Although the photoresist peak intensity is highest at the interface of the NHS and methoxy regions, line scans across these regions also show residual photoresist is present on the entire surface, especially on the methoxy regions (see Figure 7).
Figure 6.
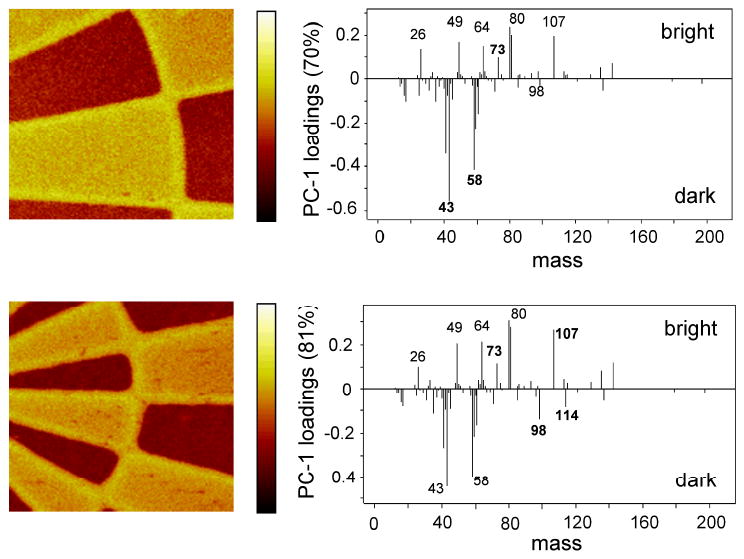
Negative ion PC1 scores and loadings plots (left) for the hydrolyzed (top) and regenerated NHS-patterned slides (bottom). The re-appearance of peaks at m/z 98 and 114 after the regeneration treatment indicates successful reintroduction of NHS groups. The bright region in both images corresponds to the MeO-terminated region (e.g., m/z 73). Image size is 500 μm × 500 μm.
Table 1.
Ratios1 of various negative ToF-SIMS fragment ion intensity peaks detected in NHS regions of the fresh, hydrolyzed and regenerated patterned polymer surfaces.
| Sample | Ratio (X 10-2) | ||
|---|---|---|---|
| RNHS | RHydrolyzed | Rphotoresist | |
| Fresh | 0.66 ± 0.01 | 0.40 ± 0.006 | 0.037 ± 0.001 |
| Hydrolyzed | 0.05 ± 0.001 | 0.61 ± 0.01 | 0.046 ± 0.001 |
| Regenerated | 0.53 ± 0.003 | 0.55 ± 0.005 | 0.041 ± 0.002 |
INHS = I114 + I98 ; Ihydrolyzed = I58 ; Iphotoresist = I107
Itotal = total ion count from all peaks
NHS ratio (RNHS) = INHS/Itotal
Hydrolyzed ratio (Rhydrolyzed) = Ihydrolyzed/Itotal
Photoresist ratio (Rphotoresist) = Iphotoresist/Itotal
Figure 7.
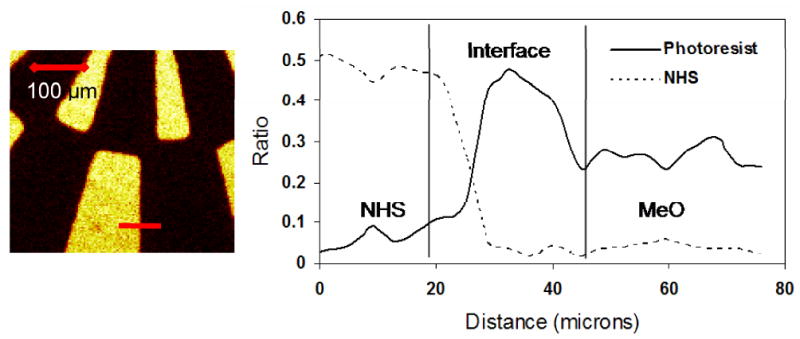
Line scans (right) across the ToF-SIMS ion fragment image (left) for the photoresist (solid line) and NHS (dashed line) peak ratios defined in Table 1. In addition to significant amounts of photoresist residue at the interface between the NHS and MeO patterned regions, some photoresist residue is also present in MeO region.
Conclusions
ToF-SIMS successfully distinguished chemical patterns on polymer surfaces containing reactive NHS chemistry undergoing routine lithographic patterning, hydrolysis and NHS regeneration. PCA processing of the ToF-SIMS data provides surface sensitive ion fragment-based specificity useful for understanding the origins of chemical ion image contrast in spatially selective step-by-step chemical derivatizations. PCA was critical for the chemically-specific detection of patterned interfacial contamination attributed to residual photoresist materials commonly used in photolithographed processing. This photoresist fragment contamination remains despite commonly recommended solvent removal steps. Possible matrix effects on ToF-SIMS yields of key ions in the NHS fragmentation compared across four different substrates showed that fragmentation in the NHS positive ion spectrum is enhanced for NHS SAMs on a gold substrate compared to those from organic surfaces. Although some matrix effects are also observed in the negative fragments, reasonable strong spectral intensities for NHS fragments were observed from organic surfaces and could be used to monitor the presence of covalently bound NHS groups. Overall, the chemical imaging and analytical capabilities of ToF-SIMS analysis for following micropattern-specific chemistry, degradation, regeneration, and contamination were validated for a commercial polymer surface containing a complex organic matrix with reactive immobilization chemistry. This method is anticipated to be useful for improving surface analysis capabilities relevant for surface quality control and analysis needed for numerous technical applications, especially ones that involve patterning of complex materials.
Supplementary Material
Acknowledgments
Atomic force microscopy analysis from F. Lew and Loren Rieth (Utah) is greatly appreciated. This research was supported by the National ESCA and Surface Analysis Center for Biomedical Problems (NIH grant EB-002027) and NIH grant EB-001473.
References
- 1.Wallraff GM, Hinsberg WD. Chemical Reviews. 1999;99:1801. doi: 10.1021/cr980003i. [DOI] [PubMed] [Google Scholar]
- 2.Pathak S, Dentinger PM. Langmuir. 2003;19:1948. [Google Scholar]
- 3.Petrou PS, Chatzichristidi M, Douvas AA, Argitis P, Misiakos K, Kakabakos SE. Biosensors & Bioelectronics. 2007;22:1994. doi: 10.1016/j.bios.2006.08.036. [DOI] [PubMed] [Google Scholar]
- 4.Timmons CL, Hess DW. Journal of the Electrochemical Society. 2008;155:H771. [Google Scholar]
- 5.Prater CB, Hansma PK, Tan IH, Lishan DG, Hu EL. Journal of Vacuum Science & Technology B. 1992;10:1211. [Google Scholar]
- 6.Holloway PHB, W D. Reliability Physics Symposium. 1974 Apr;:180. [Google Scholar]
- 7.Riihisaari T, Likonen J, Kiviranta A, Eranen S, Lehto S, Tuominen J, Lindblom T, Muukkonen E. Solid State Phenomena. 1999;65-6:215. [Google Scholar]
- 8.Blawas AS, Reichert WM. Biomaterials. 1998;19:595. doi: 10.1016/s0142-9612(97)00218-4. [DOI] [PubMed] [Google Scholar]
- 9.Revzin A, Tompkins RG, Toner M. Langmuir. 2003;19:9855. [Google Scholar]
- 10.Tourovskaia A, Barber T, Wickes BT, Hirdes D, Grin B, Castner DG, Healy KE, Folch A. Langmuir. 2003;19:4754. [Google Scholar]
- 11.Folch A, Toner M. Biotechnology Progress. 1998;14:388. doi: 10.1021/bp980037b. [DOI] [PubMed] [Google Scholar]
- 12.Tamura T, Sakai Y, Nakazawa K. Journal of Materials Science-Materials in Medicine. 2008;19:2071. doi: 10.1007/s10856-007-3305-1. [DOI] [PubMed] [Google Scholar]
- 13.Finlay JA, Krishnan S, Callow ME, Callow JA, Dong R, Asgill N, Wong K, Kramer EJ, Ober CK. Langmuir. 2008;24:503. doi: 10.1021/la702275g. [DOI] [PubMed] [Google Scholar]
- 14.Carrico IS, Maskarinec SA, Heilshorn SC, Mock ML, Liu JC, Nowatzki PJ, Franck C, Ravichandran G, Tirrell DA. Journal of the American Chemical Society. 2007;129:4874. doi: 10.1021/ja070200b. [DOI] [PMC free article] [PubMed] [Google Scholar]
- 15.Koh WG, Revzin A, Simonian A, Reeves T, Pishko M. Biomedical Microdevices. 2003;5:11. [Google Scholar]
- 16.Zhang SG, Yan L, Altman M, Lassle M, Nugent H, Frankel F, Lauffenburger DA, Whitesides GM, Rich A. Biomaterials. 1999;20:1213. doi: 10.1016/s0142-9612(99)00014-9. [DOI] [PubMed] [Google Scholar]
- 17.Harbers GM, Emoto K, Greef C, Metzger SW, Woodward HN, Mascali JJ, Grainger DW, Lochhead MJ. Chemistry of Materials. 2007;19:4405. doi: 10.1021/cm070509u. [DOI] [PMC free article] [PubMed] [Google Scholar]
- 18.Takahashi H, Emoto K, Dubey M, Castner DG, Grainger DW. Advanced Functional Materials. 2008;18:2079. doi: 10.1002/adfm.200800105. [DOI] [PMC free article] [PubMed] [Google Scholar]
- 19.Hermanson GT. Bioconjugate Techniques. Academic Press; 1996. [Google Scholar]
- 20.Midwood KS, Carolus MD, Danahy MP, Schwarzbauer JE, Schwartz J. Langmuir. 2004;20:5501. doi: 10.1021/la049506b. [DOI] [PubMed] [Google Scholar]
- 21.Lee CY, Harbers GM, Grainger DW, Gamble LJ, Castner DG. Journal of the American Chemical Society. 2007;129:9429. doi: 10.1021/ja071879m. [DOI] [PMC free article] [PubMed] [Google Scholar]
- 22.Gong P, Harbers GM, Grainger DW. Analytical Chemistry. 2006;78:2342. doi: 10.1021/ac051812m. [DOI] [PubMed] [Google Scholar]
- 23.Choi HJ, Kim NH, Chung BH, Seong GH. Analytical Biochemistry. 2005;347:60. doi: 10.1016/j.ab.2005.08.015. [DOI] [PubMed] [Google Scholar]
- 24.Liu YJ, Rauch CB. Analytical Biochemistry. 2003;317:76. doi: 10.1016/s0003-2697(03)00051-4. [DOI] [PubMed] [Google Scholar]
- 25.ODonnell MJ, Tang K, Koster H, Smith CL, Cantor CR. Analytical Chemistry. 1997;69:2438. doi: 10.1021/ac961007v. [DOI] [PubMed] [Google Scholar]
- 26.Lahiri J, Ostuni E, Whitesides GM. Langmuir. 1999;15:2055. [Google Scholar]
- 27.Houseman BT, Gawalt ES, Mrksich M. Langmuir. 2003;19:1522. [Google Scholar]
- 28.Falconnet D, Csucs G, Grandin HM, Textor M. Biomaterials. 2006;27:3044. doi: 10.1016/j.biomaterials.2005.12.024. [DOI] [PubMed] [Google Scholar]
- 29.Lahiri J, Isaacs L, Tien J, Whitesides GM. Analytical Chemistry. 1999;71:777. doi: 10.1021/ac980959t. [DOI] [PubMed] [Google Scholar]
- 30.Nakanishi K, Muguruma H, Karube I. Analytical Chemistry. 1996;68:1695. doi: 10.1021/ac950756u. [DOI] [PubMed] [Google Scholar]
- 31.Cheng F, Gamble LJ, Grainger DW, Castner DG. Analytical Chemistry. 2007;79:8781. doi: 10.1021/ac0715423. [DOI] [PMC free article] [PubMed] [Google Scholar]
- 32.Gong P, Grainger DW. Surface Science. 2004;570:67. [Google Scholar]
- 33.Graham DJ, Wagner MS, Castner DG. Applied Surface Science. 2006;252:6860. [Google Scholar]
- 34.Wagner MS, Graharn DJ, Castner DG. Applied Surface Science. 2006;252:6575. [Google Scholar]
- 35.Wickes BT, Kim Y, Castner DG. Surface and Interface Analysis. 2003;35:640. [Google Scholar]
- 36.Jones EA, Lockyer NP, Kordys J, Vickerman JC. Journal of the American Society for Mass Spectrometry. 2007;18:1559. doi: 10.1016/j.jasms.2007.05.014. [DOI] [PubMed] [Google Scholar]
- 37.Tyler BJ, Rayal G, Castner DG. Biomaterials. 2007;28:2412. doi: 10.1016/j.biomaterials.2007.02.002. [DOI] [PMC free article] [PubMed] [Google Scholar]
Associated Data
This section collects any data citations, data availability statements, or supplementary materials included in this article.