Abstract
We are investigating three-dimensional (3D) to two-dimensional (2D) registration methods for computed tomography (CT) and dual-energy digital radiography (DEDR). CT is an established tool for the detection of cardiac calcification. DEDR could be a cost-effective alternative screening tool. In order to utilize CT as the “gold standard” to evaluate the capability of DEDR images for the detection and localization of calcium, we developed an automatic, intensity-based 3D-to-2D registration method for 3D CT volumes and 2D DEDR images. To generate digitally reconstructed radiography (DRR) from the CT volumes, we developed several projection algorithms using the fast shear-warp method. In particular, we created a Gaussian-weighted projection for this application. We used normalized mutual information (NMI) as the similarity measurement. Simulated projection images from CT values were fused with the corresponding DEDR images to evaluate the localization of cardiac calcification. The registration method was evaluated by digital phantoms, physical phantoms, and clinical data sets. The results from the digital phantoms show that the success rate is 100% with a translation difference of less than 0.8 mm and a rotation difference of less than 0.2°. For physical phantom images, the registration accuracy is 0.43±0.24 mm. Color overlay and 3D visualization of clinical images show that the two images registered well. The NMI values between the DRR and DEDR images improved from 0.21±0.03 before registration to 0.25±0.03 after registration. Registration errors measured from anatomic markers decreased from 27.6±13.6 mm before registration to 2.5±0.5 mm after registration. Our results show that the automatic 3D-to-2D registration is accurate and robust. This technique can provide a useful tool for correlating DEDR with CT images for screening coronary artery calcification. © 2007 American Association of Physicists in Medicine. [DOI: 10.1118/1.2805994]
Keywords: 3D-to-2D registration, dual-energy digital radiography (DEDR), computed tomography (CT), cardiac calcification, coronary artery diseases (CADs)
I. INTRODUCTION
Cardiovascular disease is the leading cause of death in the United States. It affects millions of Americans and is responsible for approximately half a million deaths per year.1 Among these deaths, approximately one-third result from sudden heart attack without identifiable risk factors.1 Therefore, early detection and diagnosis may prevent acute exacerbation and improve survival rates.
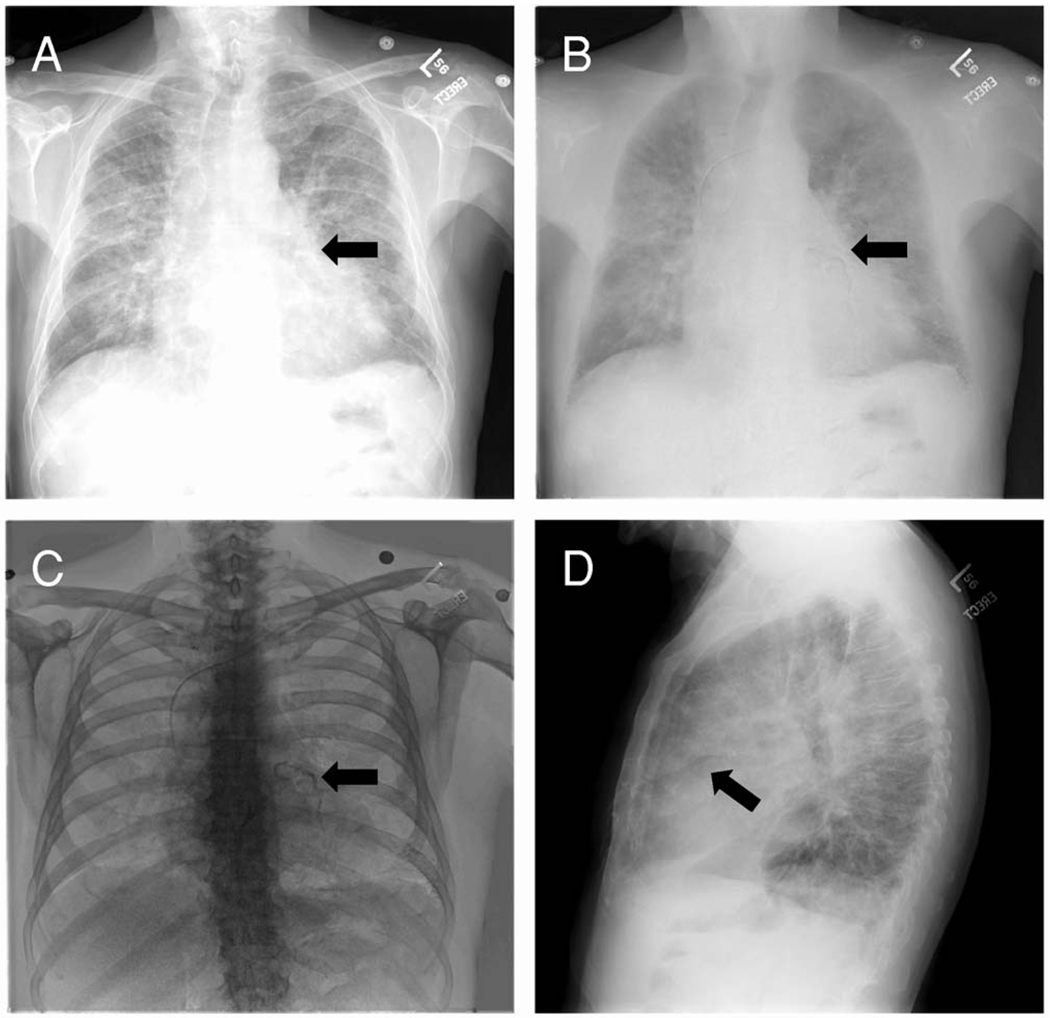
The relationship between coronary artery calcification and atherosclerotic heart diseases has been well documented.2 Early detection of cardiac calcification is directly helpful for diagnosing atherosclerotic heart diseases. Computed tomography (CT) is an established tool for detecting cardiac calcification.3 However, the increasing incidence of cardiovascular diseases requires a cost-effective, accurate, and noninvasive screening technique for large-scale populations. Recently, digital technology has enabled the use of dual-energy techniques in digital radiography systems. With the recent advanced improvement of digital radiograph and flat-panel technology, dual-energy digital radiography (DEDR) can acquire a conventional, high-peak kilovoltage image and a low-peak kilovoltage image with less than a 200 msec temporal separation. Postprocessing of these two images results in the following images (Fig. 1): The conventional x-ray image [Fig. 1(A)]; a subtracted soft-tissue image [Fig. 1(B)] that removes overlying bone from the underlying lung and mediastinum; and a subtracted bone image [Fig. 1(C)] that optionally displays bone and calcified thoracic structure.7,8 Thus, dual-energy digital radiography may be a cost-effective, alternative tool for screening cardiac calcification.4–7
FIG. 1.
DEDR images to detect cardiac calcification. Image A is the presentation of the conventional x-ray images. Image B is a subtracted, soft-tissue image that removes overlying bone from the underlying lung and mediastinum. Image C is the subtracted bone image that optionally displays bone and calcified thoracic structures. Image D is the conventional x-ray image acquired in the lateral direction. On the DEDR bone image (C), the coronary artery calcification is clearly visible (arrow).
As shown in our previous study, the detection of calcified cardiothoracic structures is remarkably improved on subtracted bone images.7 In addition, it is useful in the detection of valvular and myocardial calcification. Unfortunately, standard radiographic images lack three-dimensional (3D) spatial information, which is important for accurate localization of the lesions. Although the images acquired in the lateral direction [Fig. 1(D)] may display the lesion in another angle, whether it can offer an accurate localization is yet to be evaluated. Furthermore, this technique should be evaluated using the “gold standard” CT images before it can be widely used as a screening tool for detecting cardiac calcification and coronary artery diseases.
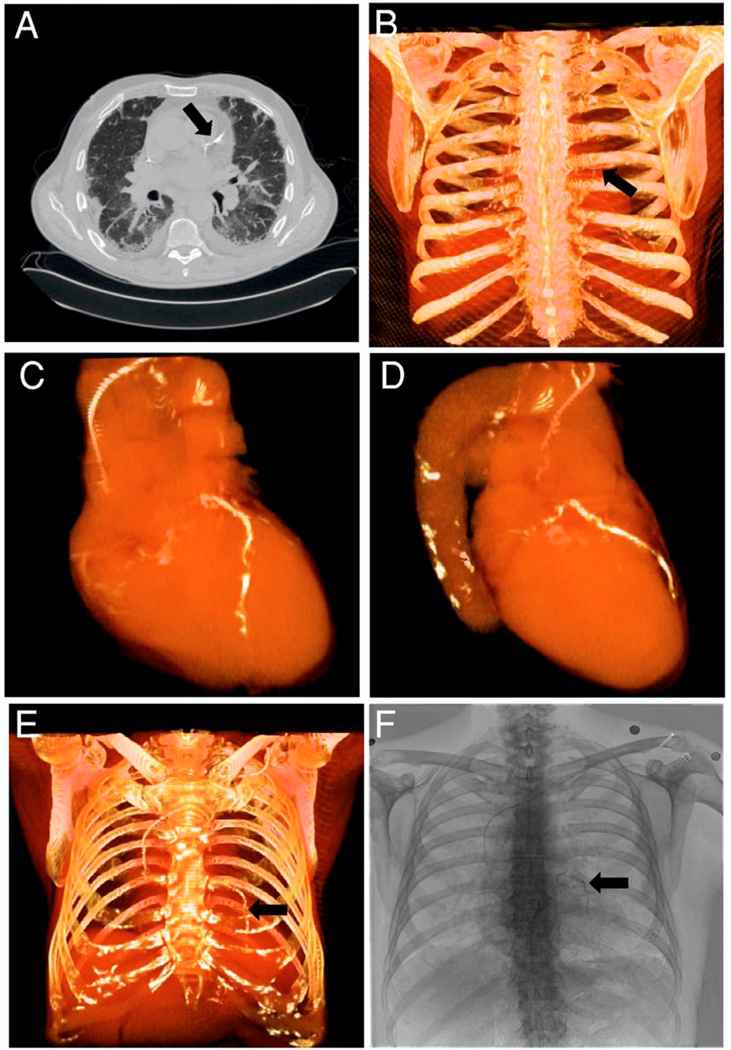
In this study, we are developing image registration methods that can link dual-energy digital radiography with CT images. By comparing DEDR to the gold standard CT images, we can evaluate the ability of dual-energy digital radiography to detect cardiac calcification. As shown in Fig. 2, the CT image [Fig. 2(A)] clearly shows the coronary artery calcification. Figures 2(C) and 2(D) show the 3D visualization of the heart and the calcified coronary artery. Using the CT volume data, we perform image projection to generate digitally reconstructed radiography (DRR). Figures 2(B) and 2(E) show the DRR images in the posterior-anterior (PA) and anterior-posterior directions, respectively. The calcification is clearly visible on both images (arrows). Figure 2(F) shows the DEDR image of the same patient, and the arrow indicates possible calcification. If we register the CT volume with the DEDR image, we should be able to verify the suspicious cardiac calcification seen on the DEDR images. However, CT and DEDR images are acquired from two different systems. As the patient is at different positions for the two image acquisitions, the DEDR and DRR images are not registered. Figure 3(A) shows a conventional x-ray image of DEDR, Fig. 3(C) is the DRR image of same patient, and Fig. 3(B) is the difference image of the two images, which clearly shows misalignment.
FIG. 2.
Comparison of CT and dual-energy digital radiography to detect coronary artery calcification. Image A is a CT image showing the calcification in the coronary artery (arrow). Images B-E show the three-dimensional (3D) visualization of the heart and the whole chest. Image F contains dual-energy digital radiography (DEDR) images from the same patient. The suspicious calcification lesion (arrow) on the DEDR image is verified by the CT image (A) and the three dimensional visualization (arrow).
FIG. 3.
Dual-energy digital radiograph (DEDR) and digitally reconstructed radiography (DRR) images. Before registration, the difference image (B) shows that the DEDR images (A) and the DRR image were not registered.
To register 3D CT volumes and two-dimensional (2D) DEDR images, we developed a 3D-to-2D registration algorithm for this new application. Although other 3D-to-2D registration methods have been reported, most of these studies focused on the applications in image-guided interventions. Penny et al. developed a registration algorithm for aligning preoperative CT images and intraoperative fluoroscopy images.9 McLaughin et al. compared the iterative closest point algorithm with a similarity-based registration method for neurointerventions.10 Weese et al. developed a voxel-based registration method for CT and x-ray images for image-guided surgery.11 Zollei et al. proposed a mutual, information-based registration algorithm for fluoroscopy and CT images.12 Russakoff et al. developed an attenuation field method that computes the DRR images in a preprocessing step and speeds up the registration.13,14 Hipwell et al. compared different similarity measures for neurovascular interventions.15 Birkfeller et al. reported a variation of the splat rendering method where only voxels above a certain threshold were used for DRR generation.16 The registration applications were focused on the skull, spine, pelvis, and other rigid organs. To the best of our knowledge, there is no report on 3D-to-2D registration for dual-energy digital radiography and CT images of the heart. In order to utilize cardiac CT images as the standard to evaluate the ability of DEDR images to detect cardiac diseases, we developed and evaluated an automatic, intensity-based registration scheme for CT volumes and DEDR images. As described in the next sections, the method was evaluated by digital phantoms, physical phantoms, and clinical patient data.
II. REGISTRATION METHODS
II.A. Overview of the 3D-to-2D registration method
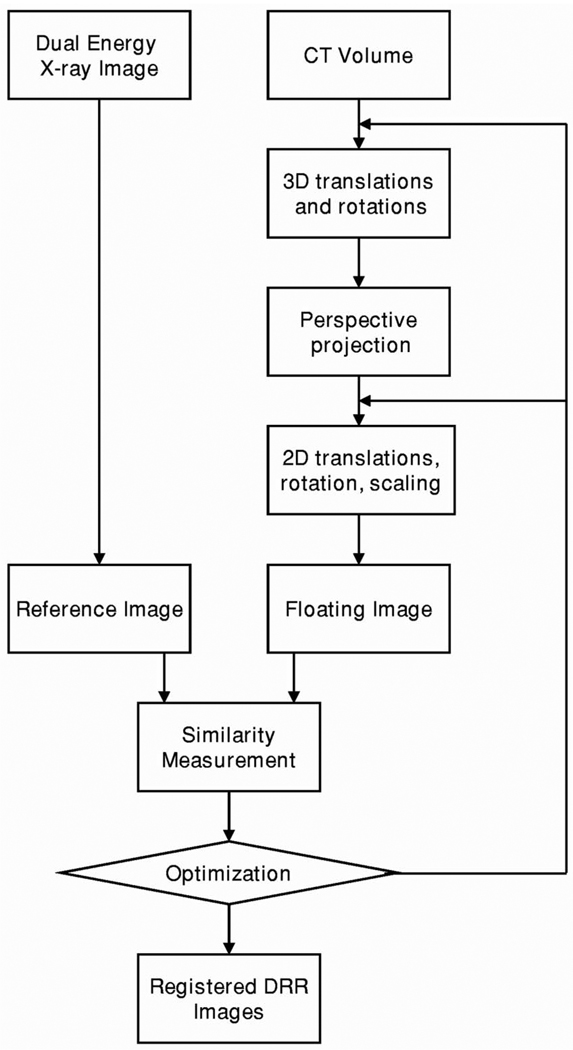
Figure 4 shows the diagram of the intensity-based 3D-to-2D registration algorithm. We first apply 3D translations and rotations to the CT volume. Using the CT volume, we perform perspective projection to generate DRR. We then translate, rotate, and scale the DRR images to match with the DEDR images. We define the DRR image as the floating image and the DEDR image as the reference image. We compute the similarity measurement between the reference and floating images. For the DEDR images, we can use the conventional x-ray image and the bone or the soft tissue images for the registration. We generally optimize 11 parameters, i.e., three translations and three angles for the CT volume and two translations, one rotation, and two scaling parameters for the DRR images. We use the downhill simplex method for the optimization.23
FIG. 4.
Diagram of the 3D-to-2D registration for 3D CT image volumes and 2D dual-energy digital radiography. II.B. Projection methods
To translate the CT volume, we use the following matrix:
| (2.1) |
where (x, y, z) is the coordinate of a voxel in the CT volume and (x′, y′, z′) is the new position after the transformation and tx, ty, and tz are translations along X, Y, and Z directions.
Three rotation operations of the CT volume can be expressed in the following matrix:
| (2.2) |
| (2.3) |
| (2.4) |
θx, θy, and θz are the rotation angles about the X-, Y-, and Z-axis, respectively. Similarly, 2D translation of the DRR image can be expressed in the matrix below:
| (2.5) |
where tx and ty are the translations along X and Y directions, respectively. The 2D rotation of the DRR image is described below:
| (2.6) |
where θ is the rotation parameter of the 2D DRR image. The 2D scaling operation can be described in the following matrix:
| (2.7) |
As shown previously, the 3D-to-2D registration has 11 degrees of freedom. These parameters describe the spatial relationship and geometric transformation between the 3D CT volume and the 2D DEDR image. These parameters may be reduced if the image acquisition parameters are known. For example, the two scales can be reduced to one if the scaling is the same in the X and Y directions. This will reduce the computation and speed up the registration.
II.B. Projection methods
We use a shear-warp factorization method to generate DRR images.17 In this method, a viewing transformation is applied to simplify the projection processing. The algorithm uses a principal viewing axis to choose a set of CT voxel slices to be resampled and composited. It also determines the order of the slices along the front-to-back direction of the image volume.
In general, a perspective viewing transformation matrix Mview includes a permutation P, a shift of the origin Tshift, a 3D perspective shear scale Mshear, and a 2D warp Mwarp; and, hence, Mview=Mwarp ·Mshear ·Tshift ·P. Mview is a 4×4 affine viewing transformation matrix that transforms points from the object space to the image space. Mview will be simplified as Mview=Mwarp ·Mshear, where Mshear is the shear transformation, a product of a pure shear transformation Msh, and a perspective scaling transformation Ms, i.e., Mshear=Ms·Msh. The pure shear transformation Msh is represented as
| (2.8) |
The matrix is simplified because ex=0, ey=0, and ez=−ρ, where (ex,ey,ez) is the coordinate of the tube focus in the object space. The perspective scaling transformation Ms can be described as
| (2.9) |
where ρ is the distance between the tube focus and the image plane. Thus, the shear transformation matrix Mshear can be described as
| (2.10) |
The warp transformation is the product of the view transformation matrix and the inverse of the shear transformation matrix,
| (2.11) |
We use the projection parameters that were used for real DEDR image acquisitions. The parameters include the distance between the x-ray tube’s focus and the detector plane. After we set up a coordinate system for the projection, we determine the location of the x-ray tube and the principal view axis. These parameters are used to compute the perspective transformation matrix.
Based on the shear-warp factorization method, we developed a variety of projection methods, including Gaussian-weighted projection, threshold-based projection, average-based projection (AVG), and maximum intensity projection (MIP) for this particular application.
Gaussian-weighted projection uses a Gaussian function as the weighting function during the projection processing. The CT values within a calcification region can be described as a series of variables with an approximate Gaussian distribution. The image intensities within this region are described as I∼N (μ, σ2), where μ is the mean intensity and σ is the standard deviation. In order to find the most optimal parameters, we search μ from 10–990 Hounsfield Units (HU) and σ from 20–280 HU. For each pair of μ and σ values, we generate projection images of the whole chest along the PA direction. We visually evaluate the quality of the projection images. We grade the images as excellent, good, fair, and poor. Based on the grades, we can determine which pair of μ and σ better show calcification.
The threshold-based projection method uses a predetermined CT value as the threshold during projection processing. The AVG generates an average intensity along the projection line. The MIP method displays only the maximum intensity along the projection line.
II.C. Similarity measurement for registration
We used normalized mutual information (NMI) as the similarity measure between the DRR images and the DEDR image. Based on our previous studies of NMI-based registration, the similar measure is robust for multimodality image registration.18–21
The DEDR image is the reference image (R) and the DRR image is the floating image (F). Their NMI value can be calculated using the following equation:22
| (2.12) |
| (2.13) |
| (2.14) |
| (2.15) |
The joint probability pRF(r , f) and the marginal probabilities pR(r) of the reference image and the pF(f) of the floating image can be estimated from the normalized joint intensity histograms. When two images are geometrically aligned, NMI is maximal.
III. EXPERIMENTAL DESIGN
III.A. Digital phantom experiments
We selected one set of clinical CT data to generate digital phantoms to evaluate the algorithm. This patient was suspicious for cardiac calcification on DEDR images; this was verified on multidetector CT (MDCT) examination. We first generated DRR images with known orientations to simulate DEDR images. We then randomly selected the initial positions of the CT volume and performed 3D-to-2D registrations 50 times. The translation range was ±21 mm from the known position. The rotation range was ±10° for the known orientation. The random parameters were generated with a uniform distribution. We compared the transformation parameters with the ground truth. The translation difference Dtrans is defined as
| (3.1) |
where tx, ty, and tz are translations along the X, Y, Z directions, respectively. Rotation difference Drot is defined as
| (3.2) |
where θx, θy, and θz are rotation angles about the X-, Y-, and Z-axis, respectively. We define the registration as successful when the translation difference is less than 1 mm and the rotation difference is less than 0.6°. Success rates are then used to validate the robustness of the registration algorithm.
III.B. Physical phantom experiments
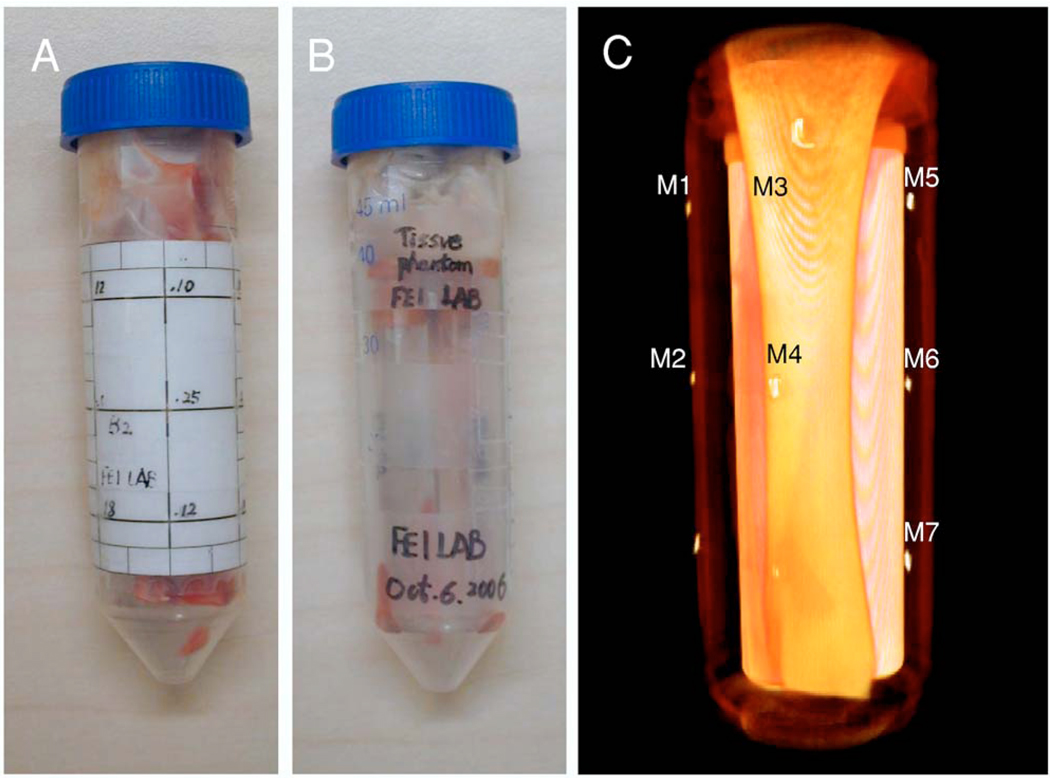
As shown in Fig. 5, we designed a phantom with seven fiducial markers for the evaluation experiment. Figures 5(A) and 5(B) are the pictures of the physical phantom with and without the markers, respectively. Figure 5(C) is the 3D visualization of the phantom. We used a micro-CT system (X-SPECT®, Gama Medica, Northridge, CA) and a micro-x-ray system (Thomas Jefferson Laboratory, 12000 Jefferson Avenue, Newport News, VA 23606) for the phantom experiments. We acquired micro-CT images from the phantom at the 36 K V p 750 μA and 45 K V p 750 μA energy levels. The resolution of the micro-CT images was 0.1 mm. The image size was 512×512×512. We also acquired x-ray images from the same phantom in three positions, i.e., “O” position: The same position as the CT imaging; “L” position: Rotating the phantom 5° to the left side, and “R” position: Rotating the phantom to the right side by 5° and then lifting one end of the phantom up by a few millimeters. Three energy levels (30, 33, and 36 K V p) were used to acquire the x-ray images with 700 μA. The image size was then 2048×1024 with a resolution of 0.05 mm. We thereby acquired two CT volumes and nine x-ray images for the phantom registration. We used the seven markers to evaluate the accuracy of the 3D-to-2D registration. After registration, the distance between the corresponding markers on the registered DRR image and on the DEDR image can be calculated to represent the registration accuracy.
FIG. 5.
Physical phantom for the registration evaluation. Image A is a picture of the physical phantom with markers. Image B is the picture without markers. Image C is the 3D visualization of the phantom, which is created from the CT images.
III.C. Registration experiments using clinical patient images
We originally identified a group data set of 15 clinical patients with findings suspicious for cardiac calcification on DEDR images. These patients had undergone MDCT evaluation of the chest within 12 months of having chest x-ray digital radiography. The CT examinations were obtained for a variety of clinical indications using imaging protocols that varied considerably in slice thickness, radiographic technique, and presence or absence of intravenous contrast material. The CT studies were analyzed for the presence of coronary artery, valvular, or myocardial calcification.
Patients were imaged using a digital radiography unit (Revolution XR/d, GE Healthcare, Milwaukie, WC). A 60 K V p image (low-energy image) was acquired first. After less than a 200 msec delay, a second conventional 120 K V p image (high-energy image) was acquired. After postprocessing of the two images, a standard 120 K V p image, a subtracted soft-tissue image, and a subtracted bone image were obtained. All of the CT and DEDR images were processed using this 3D-to-2D registration method.
III.D. Registration evaluation
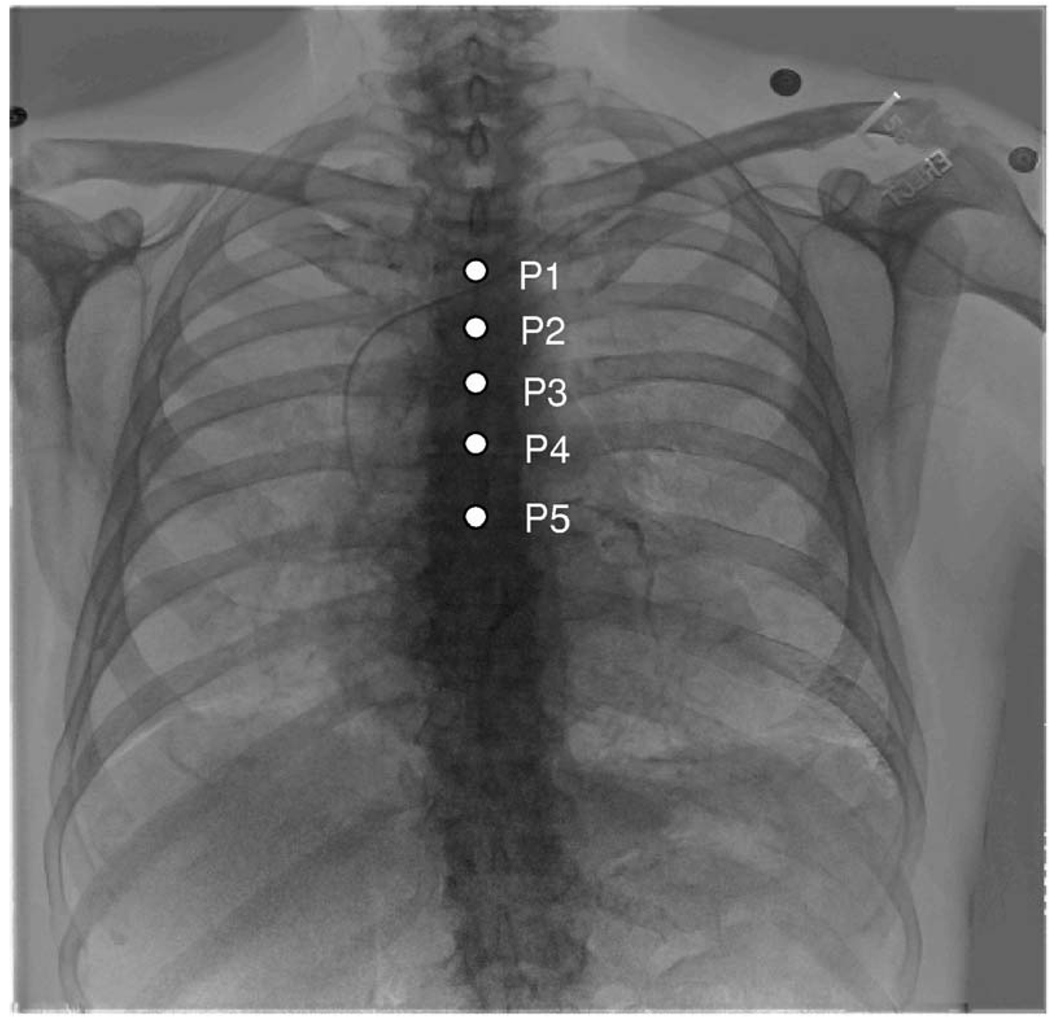
We used a variety of methods to evaluate registration quality. First, we used anatomic markers to quantitatively evaluate the registration quality of clinical data. As shown in Fig. 6, the anatomic markers are located along the spine from the second to the sixth rib. The distance between each corresponding marker on DRR and DEDR images was used to evaluate the registration error Ereg that is defined as
| (3.3) |
where xf, yf and xr, yr are the X, Y coordinates of the marker on the floating and reference image, respectively. Second, we compared the NMI values between the DRR and DEDR images before and after registration. As NMI was used as the similarity measure for the registration, the increase of NMI values was expected when two images were registered. Third, we used several visual inspection methods such as subtraction and color overlay to evaluate the registration quality.
FIG. 6.
Anatomic markers for registration evaluation. Five anatomic markers were identified on both DEDR and DRR images, which are located along the spine from the second to the sixth rib. The distance between corresponding markers was computed to evaluate the registration errors.
IV. RESULTS
IV.A. Registration results of digital phantoms
Table I shows the results of the digital phantoms. Each group has 50 times 3D-to-2D registrations. The success rate is 100% with a translation difference of less than 0.8 mm and a rotation difference of less than 0.2°.
Table 1.
Registration results of the digital phantoms. Real clinical CT images were used for the simulation of DEDR images. The registration is defined as successful if the translation difference is less than 1 mm and the rotation difference is less than 0.6°.
| Image size |
Resolution (mm) |
Success rate (<1 mm and <0.6°) |
Translation difference (mm) |
Rotation difference (Degree) |
|---|---|---|---|---|
| 128×128 | 3.30 | 100 | 0.07 ±0.14 |
0.001 ±0.004 |
| 512×512 | 0.83 | 100 | 0.002 ±0.001 |
0.001 ±0.001 |
IV.B. Results of physical phantom experiments
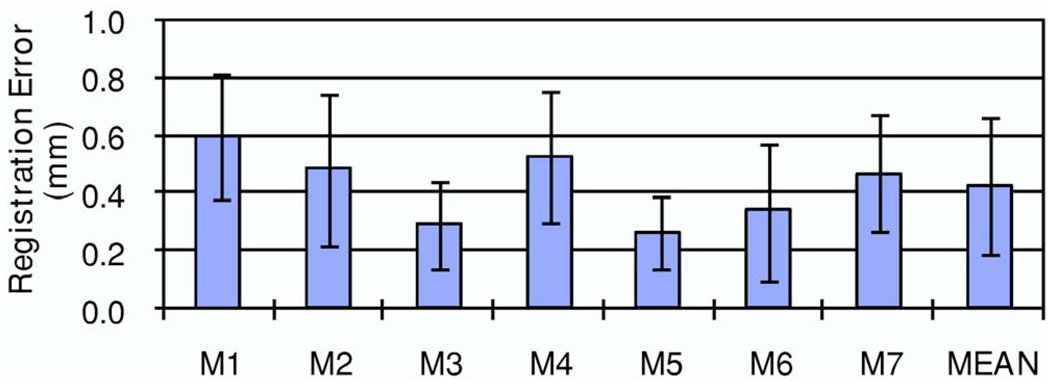
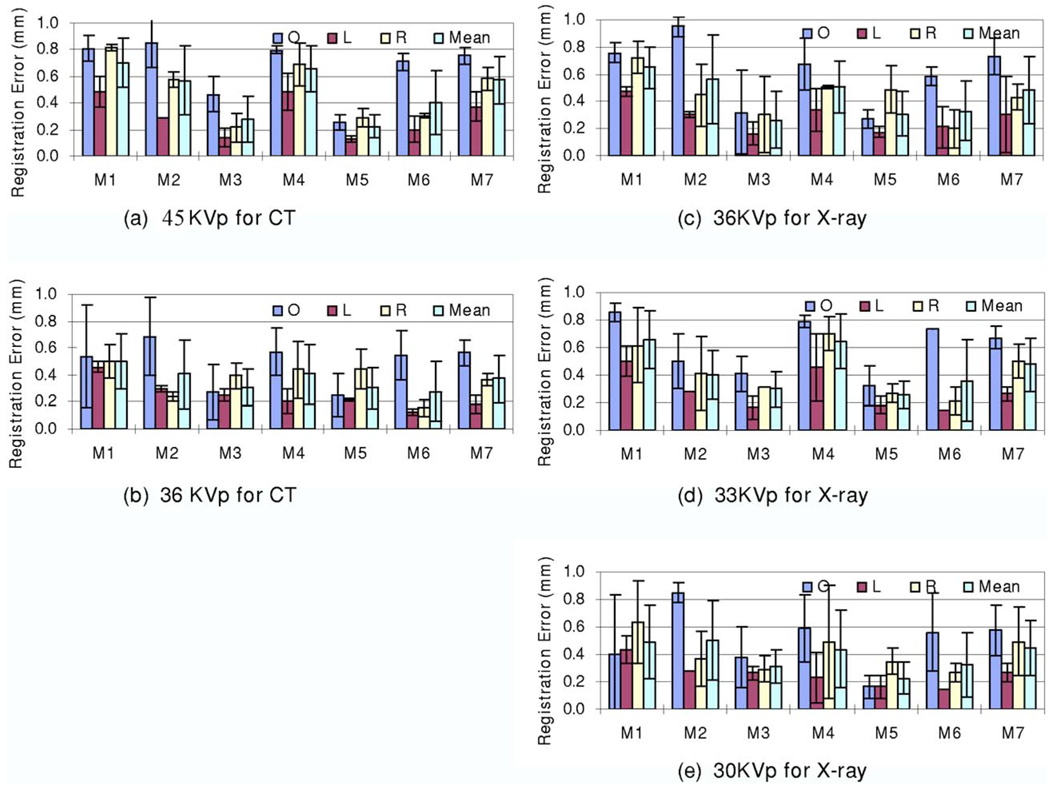
Using two micro-CT volumes and nine micro-x-ray images, we performed 18 registrations. As measured by the fiducial markers, the registration errors of the physical phantom experiments were 0.43±0.24 mm. Figure 7 shows the registration errors for each marker.
FIG. 7.
Registration errors of physical phantom experiments. Two micro-CT volumes (45 and 36 K V p) and nine micro-X-ray images (three positions: “O,” “L>,” and “R” and three energy levels: 36, 33, and 30 K V p) were used for the 18 registrations. For seven markers and the 18 registrations, the mean and standard deviation of the registration errors are 0.43±0.24 mm.
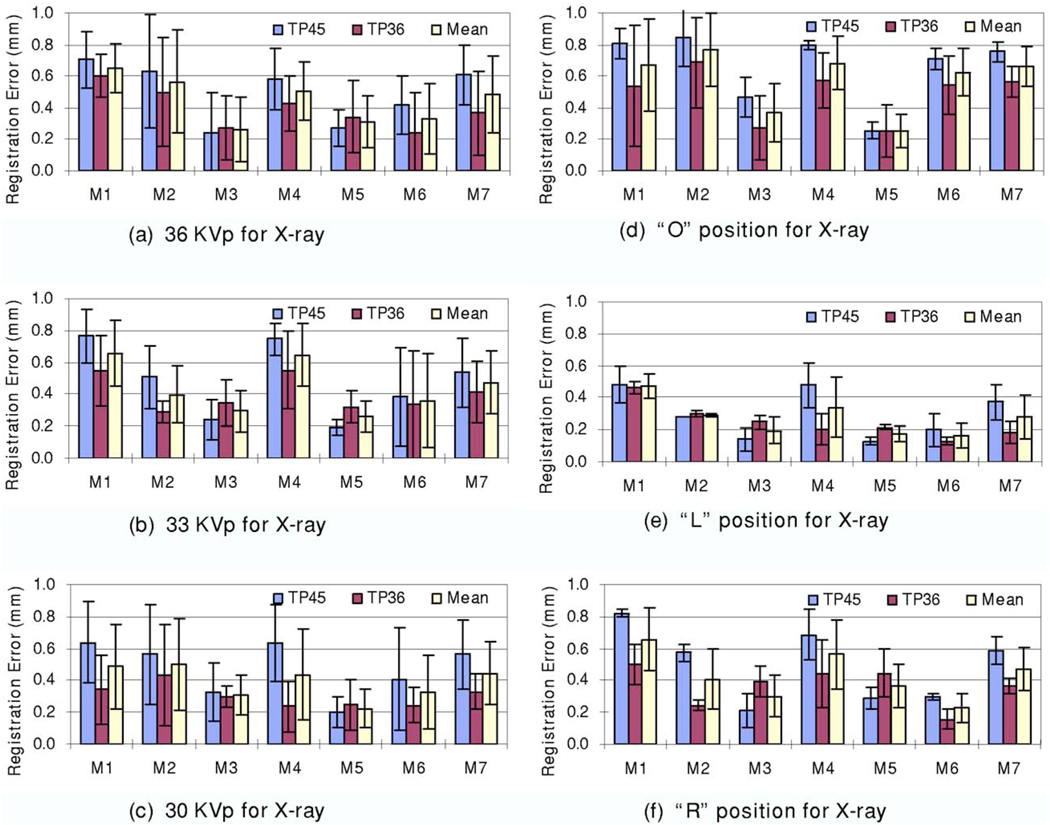
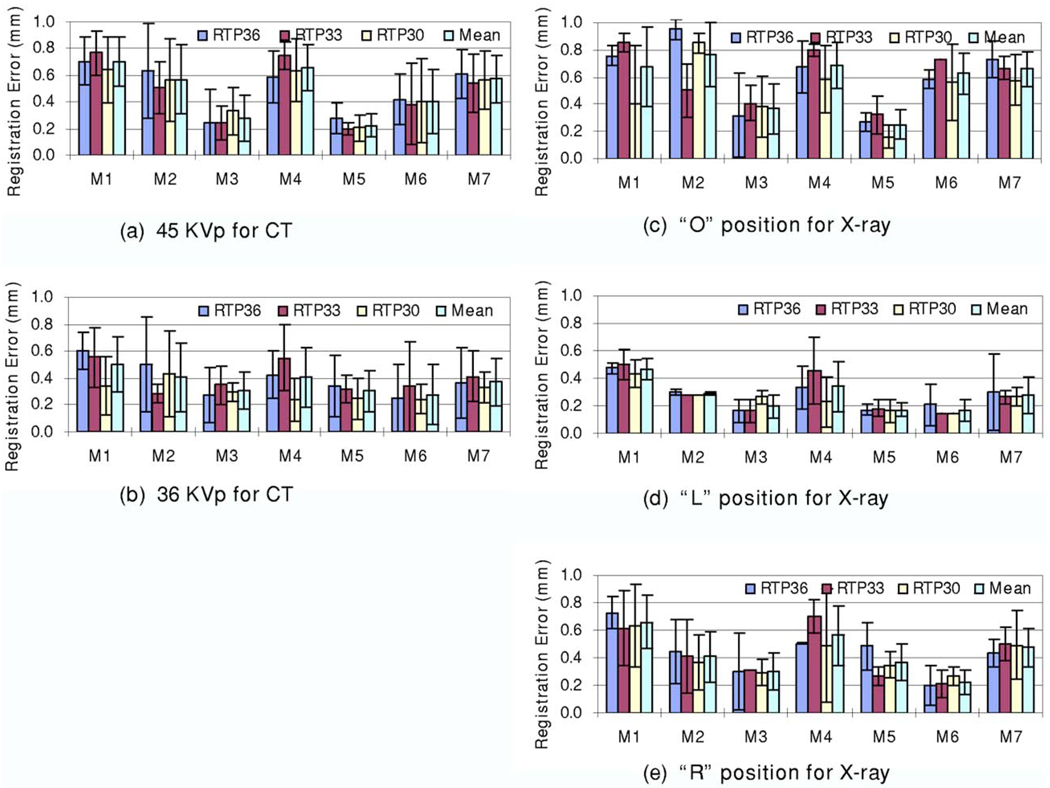
As described earlier, we acquired micro-CT image volumes at two energy levels (36 and 45 K V p) and x-ray images at three energy levels (30, 33, and 36 K V p). Figure 8 shows the registration errors for the micro-CT images acquired at two different energy levels. Figures 8(a)–8(c) show the registration results for the x-ray images acquired at different energy levels (36, 33, and 30 K V p). The CT images acquired at 36 K V p have better registration accuracy than those acquired at 45 K V p. In addition, Figures 8(d)–8(f) show the results of the x-ray images acquired in different positions (“O,” “L,” and “R” positions). Again, CT images acquired at 36 K V p had better registration accuracy than those acquired at 45 K V p. Note that the physical phantom did not move during the two CT image acquisitions. For images acquired at different positions, the registration was robust and all the errors were comparable. Furthermore, Fig. 9 shows the registration errors for the DR images acquired at different energy levels. All mean registration errors are less than 0.9 mm. Figure 10 shows the registration errors at different positions. The registration worked well for all of the different orientations. The x-ray images acquired at the “L” position show greater registration accuracy than those acquired at the other two positions. We believe that the fiducial markers for the registration evaluation are easier to identify at the “L” position than at the other two positions.
FIG. 8.
Registration errors for CT volumes acquired at different energy levels. The TP45 volume was acquired with 45 K V p. The TP36 volume was acquired with 36 K V p. Graphs (a)–(c) show the registration errors for the x-ray images at 36, 33, and 30 KVp, respectively. At each energy level, x-ray images were acquired at three positions. Graphs (d)–(f) show the registration errors for three positions, i.e., the “O,” “L,” and “R” positions, respectively. Each bar represents at least three registrations. The mean and standard deviation of the registration errors are shown for each marker.
FIG. 9.
Registration errors for x-ray images acquired at different energy levels. RTP30, RTP33, and RTP36 images were acquired at 30, 33, and 36 K V p, respectively. Graphs (a) and (b) show the registration errors for CT images acquired at 45 and 36 K V p, respectively. Each error bar represents three registrations. Graphs (c)–(d) show the registration errors for x-ray images acquired at the “O,” “L,” and “R” positions, respectively.
FIG. 10.
Registration errors for the physical phantom at different positions, i.e., “O,” “L,” and “R” positions (See text for the definition). Graphs (a) and (b) show the registration errors for CT images acquired at 45 and 36 K V p, respectively. Each error bar has three registrations. Graphs (c)–(e) show the registration errors for the x-ray images acquired at 36, 33, and 30 K V p, respectively.
IV.C. Results of clinical patient images
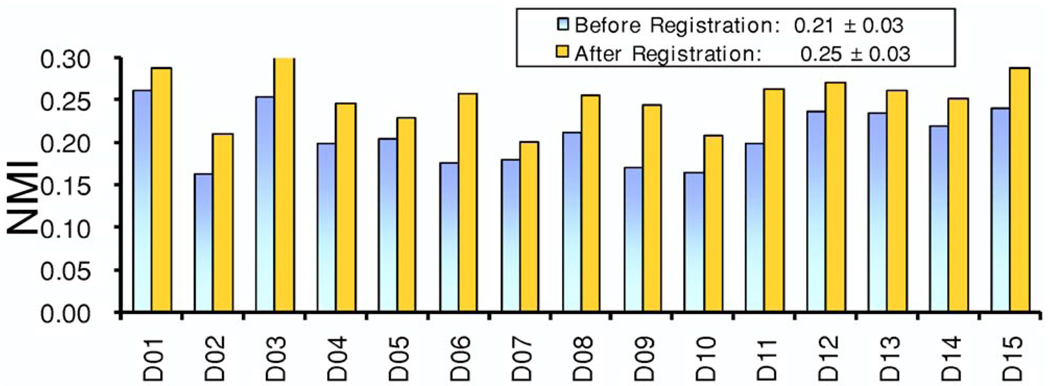
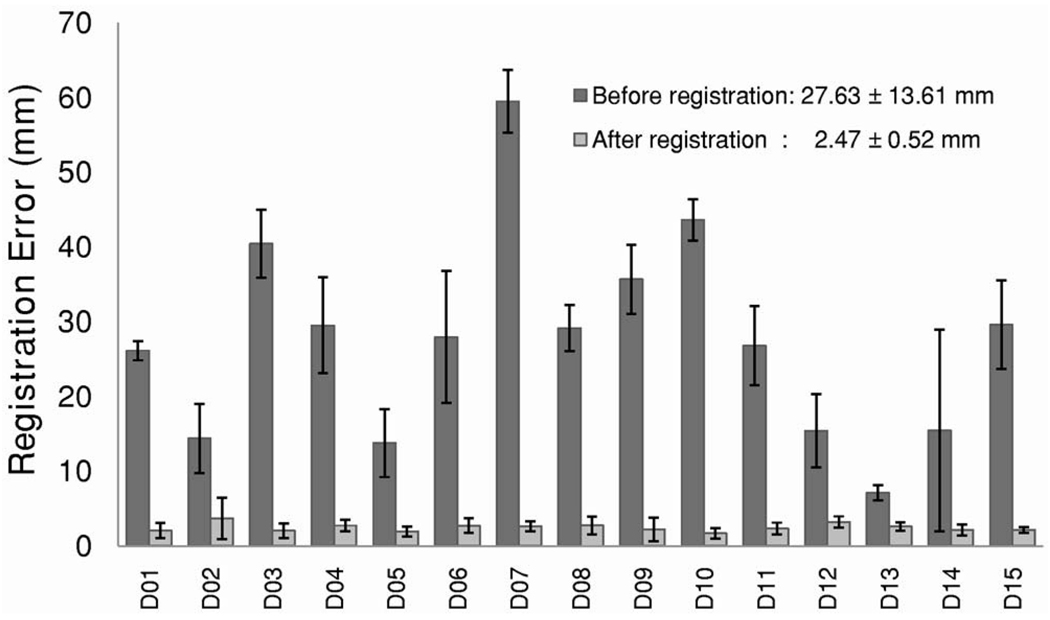
For registration of clinical images, the NMI values between the DRR and DEDR images increased from 0.21±0.03 before registration to 0.25±0.03 after registration (Fig. 11). Figure 12 shows the subtraction images of the DRR and DEDR images before and after registration. The misalignment (arrows) was improved after registration. For 15 patient data sets, the distance between corresponding anatomic markers decreased from 27.6±13.6 mm before registration to 2.5±0.5 mm after registration (Fig. 13). This accuracy is probably enough for this evaluation study because CT was used only for verification of calcification as detected by DEDR. We also developed a program to fuse the registered CT projection image and the DEDR image. As shown in Fig. 14, the DRR images from the CT volumes are quite useful in aiding the interpretation of the DEDR images. In our study, the registered DRR image using the Gaussian-weighted projection was fused with the reference DEDR images. Suspicious calcification on the DEDR image was verified by the registered DRR images as obtained from the CT image volume.
FIG. 11.
NMI values between the DRR and DEDR images before and after registration. For 15 patient data sets, NMI values increased from 0.21±0.03 to 0.25±0.03 after registration.
FIG. 12.
Difference images of DRR and DEDR before (A) and after (B) registration. Misalignment (arrows) was improved after registration.
FIG. 13.
Registration errors for clinical patient data. The distances between corresponding anatomic markers decreased from 27.6±13.6 mm before registration to 2.5±0.5 mm after registration.
FIG. 14.
Visualization of registered DRR and DEDR images A: Registered DRR images obtained from the CT volume using the average-based projection method. B: Registered DRR image using Gaussian-weighted projection. The calcified coronary artery is shown on the image. C: DEDR bone image of the same patient. D: Fusion of the B and C images where the susceptive calcification in the DEDR image (C) was verified by the registered DRR image (B).
Our results show that the Gaussian-weighted projection method better visualizes calcium than either the AVG or the MIP. We achieved optimal calcification visualization when the mean μ was from 410 to 510 HU and the standard deviation σ was 280 HU. However, the AVG method achieved better registration than either the MIP or the Gaussian-weighted projection method. This is because the DRR image obtained from the AVG method has all the intensity information that is good for the intensity-based registration. When computing the similarity between the DRR and DEDR images, we chose the high-peak kilovoltage images to represent the DEDR image for the registration because their registration accuracy is better than that of the soft tissue or bone images. We believe that the high-peak kilovoltage images may contain more information than the bone or soft tissue images and that this could improve the registration.
V. CONCLUSION AND DISCUSSION
We developed an automatic intensity-based 3D-to-2D registration method for 3D CT image volumes and 2D dual-energy digital radiographic images. Our algorithm performs well on digital phantoms, a physical phantom, and clinical data. The registration method can align whole cardiothoracic structures. The comprehensive tests on the physical phantom data show that the registration is accurate. Evaluation using patient images demonstrates that the registration and fusion method may provide a useful tool to evaluate the use of dual-energy digital radiography for the detection of coronary artery calcification.
Some implementation details are described. We used a desktop computer (Pentium®4 CPU 3.20 GHz, 3.50 GB of RAM, Microsoft Windows XP) for the computation and used IDL (Interactive Data Language, Version 6.3 Win32(X86), ITT Visual Information Solutions) as the programming language. To improve the registration speed, we down-sampled the clinical DEDR images from 2022×2022 pixels to 128 ×128 pixels and the patient CT image volumes from 512 ×512×512 voxels to 128×128×128 voxels. The registration typically takes less than five minutes, which can be shortened if we use C++ and a computer with high computing power.
The registration method is limited in several ways. First, the method used rigid-body transformation for CT image volumes. Although we incorporated two scaling factors into the registration scheme, large deformation of the chest may occur and thus may affect the registration performance. Second, the method optimizes 11 parameters for registration and the optimization may be trapped at local minima. For example, motion artifacts on the DEDR image may affect the registration performance. For clinical patient images, initial visual inspection of the DRR and DEDR images and their overlay images may be needed in order to define initial parameters for successful registration. Notwithstanding these limitations, the 3D-to-2D registration method provides an approach for evaluating dual-energy digital radiography using gold standard CT volumes and the registration technique can also be applied for other 3D and 2D images.
ACKNOWLEDGMENTS
The algorithm developed in this research was partially supported by NIH Grant No. R21CA120536 (PI: B Fei), the Case Comprehensive Cancer Center Pilot Award (B. Fei), and the Presidential Initiative Research Award of Case Western Reserve University (PI: B Fei). X.C. was partially supported by the CSC Scholarship and the Case Center for Imaging Research, which is supported by the NIH/NCI R24 Grant No. CA110943. The authors thank Elena DuPont for the clinical CT and DR image collections, Alison Hao for physical phantom data acquisitions and Joseph Meyers for visual inspection of physical phantom data sets. The authors thank Bonnie Hami for editing the English of this manuscript.
Contributor Information
Xiang Chen, Department of Radiology, Case Western Reserve University, Cleveland, Ohio 44106 and Key Laboratory of Biomedical Engineering, Institute of Medical Electronics, School of Medicine, Xi’an Jiaotong University, Xi’an, Shaanxi, P.R. China 710061.
Robert C. Gilkeson, Department of Radiology, University Hospitals Case Medical Center, Cleveland, Ohio 44106
Baowei Fei, Department of Radiology, Case Western Reserve University, Cleveland, Ohio 44106, Department of Radiology, University Hospitals Case Medical Center, Cleveland, Ohio 44106, and Department of Biomedical Engineering, Case Western Reserve University, Cleveland, Ohio 44106.
References
- 1.Thompson BH, Stanford W. Imaging of coronary calcification by computed tomography. J. Magn. Reson Imaging. 2004;19:720–733. doi: 10.1002/jmri.20066. [DOI] [PubMed] [Google Scholar]
- 2.Wexler L, Brundage B, Crouse J, Detrano R, Fuster V, Maddahi J, Rumberger J, Stanford W, White R, Taubert K. Coronary artery calcification: Pathophysiology, epidemiology, imaging methods, and clinical implications. A statement for health professionals from the American Heart Association Writing Group. Circulation. 1996;94:1175–1192. doi: 10.1161/01.cir.94.5.1175. [DOI] [PubMed] [Google Scholar]
- 3.Heussel CP, et al. Detection of coronary artery calcifications predicting coronary heart disease: Comparison of fluoroscopy and spiral CT. Eur. Radiol. 1998;8:1016–1024. doi: 10.1007/s003300050508. [DOI] [PubMed] [Google Scholar]
- 4.Fei B, Chen X, Wang H, Sabol JM, DuPont E, Gilkeson RC. Automatic registration of CT volumes and dual-energy digital radiography for detection of cardiac and lung diseases. Proceedings of the 28th Annual Conference of IEEE Engineering in Biology and Medicine, IEEE EMBC; August 30–September 3; New York, NY. 2006. pp. 1976–1979. [DOI] [PMC free article] [PubMed] [Google Scholar]
- 5.Thompson BH, Stanford W. Update on using coronary calcium screening by computed tomography to measure risk for coronary heart disease. Int. J. Card. Imaging. 2005;21:39–53. doi: 10.1007/s10554-004-5343-9. [DOI] [PubMed] [Google Scholar]
- 6.Schaefer–Prokop C, Uffmann M, Eisenhuber E, Prokop M. Digital radiography of the chest: Detector techniques and performance parameters. J. Thorac. Imaging. 2003;18:124–137. doi: 10.1097/00005382-200307000-00002. [DOI] [PubMed] [Google Scholar]
- 7.Gilkeson RC, Novak RD, Sachs P. Digital radiography with dual-energy subtraction: Improved evaluation of cardiac calcification. Am. J. Roentgenol. 2004;183:1233–1238. doi: 10.2214/ajr.183.5.1831233. [DOI] [PubMed] [Google Scholar]
- 8.MacMahon H. Digital chest radiography: Practical issues. J. Thorac. Imaging. 2003;18:138–147. doi: 10.1097/00005382-200307000-00003. [DOI] [PubMed] [Google Scholar]
- 9.Penny GP, Batchelor PG, Hill DL, Hawkes DJ. Validation of a two- to three-dimensional registration algorithm for aligning preoperative CT images and intraoperative fluoroscopy images. Med. Phys. 2001;28:1024–1032. doi: 10.1118/1.1373400. [DOI] [PubMed] [Google Scholar]
- 10.McLaughlin RA, Hipwell JH, Hawkes DJ, Noble JA, Byrne JV, Cox TC. A comparison of a similarity-based and a feature-based 2-D-3-D registration method for neuro-interventional use. IEEE Trans. Med. Imaging. 2005;24:1058–1066. doi: 10.1109/TMI.2005.852067. [DOI] [PubMed] [Google Scholar]
- 11.Weese J, Penney GP, Desmedt P, Buzug TM, Hill DLG, Hawkes DJ. Voxel-Based 2-D/3-D registration of fluoroscopy images and CT scans for image-guided surgery. IEEE Trans. Inf. Technol. Biomed. 1997;1:284–293. doi: 10.1109/4233.681173. [DOI] [PubMed] [Google Scholar]
- 12.Zollei L, Grimson E, Norbash A, Wells W. 2D-3D rigid registration of x-ray fluoroscopy and CT images using mutual information and sparsely sampled histogram estimators. Proceedings of the 2001 IEEE Computer Society Conference on Computer Vision and Pattern Recognition (CVPR, 2001); pp. 696–703. [Google Scholar]
- 13.Russakoff DB, Rohlfing T, Mori K, Rueckert D, Ho A, Adler JR, Jr, Maurer CR., Jr Fast generation of digitally reconstructed radiographs using attenuation fields with application to 2D-3D image registration. IEEE Trans. Med. Imaging. 2005;24:1441–1454. doi: 10.1109/TMI.2005.856749. [DOI] [PubMed] [Google Scholar]
- 14.Russakoff DB, Rohlfing T, Maurer CR., Jr Fast intensity-based 2D-3D image registration of clinical data using light fields. Proceedings of the Ninth IEEE International Conference on Computer Vision (ICCV 2003); pp. 416–422. [Google Scholar]
- 15.Hipwell JH, Penny GP, McLaughlin RA, Rhode K, Summers P, Cox TC, Byrne JV, Noble JA, Hawkes DJ. Intensity-based 2-D-3-D registration of cerebral angiograms. IEEE Trans. Med. Imaging. 2003;22:1417–1426. doi: 10.1109/TMI.2003.819283. [DOI] [PubMed] [Google Scholar]
- 16.Wolfgang B, Rudolf S, Michael F, Johann H, Christopher E, Peter H, Yang X, Peter N, Helmar B. Wobbled splatting-a fast perspective volume rendering method for simulation of x-ray images from CT. Phys. Med. Biol. 2005;50:73–84. doi: 10.1088/0031-9155/50/9/N01. [DOI] [PubMed] [Google Scholar]
- 17.Lacroute PG. Stanford, CA: Computer Systems Laboratory, Departments of Electrical Engineering and Computer Science, Stanford University; 1995. “Fast volume rendering using a shear-warp factorization of the viewing transformation” Anonymous Technical Report No. CSL-TR-95-678. [Google Scholar]
- 18.Pluim JP, Maintz JB, Viergever MA. Mutual information-based registration of medical images: A survey. IEEE Trans. Med. Imaging. 2003;22:986–1004. doi: 10.1109/TMI.2003.815867. [DOI] [PubMed] [Google Scholar]
- 19.Fei B, Duerk JL, Boll DT, Lewin JS, Wilson DL. Slice-to-volume registration and its potential application to interventional MRI-guided radio-frequency thermal ablation of prostate cancer. IEEE Trans. Med. Imaging. 2003;22:515–525. doi: 10.1109/TMI.2003.809078. [DOI] [PubMed] [Google Scholar]
- 20.Fei B, Wheaton A, Lee Z, Duerk JL, Wilson DL. Automatic MR volume registration and its evaluation for the pelvis and prostate. Phys. Med. Biol. 2002;47:823–838. doi: 10.1088/0031-9155/47/5/309. [DOI] [PubMed] [Google Scholar]
- 21.Fei B, Duerk JL, Wilson DL. Automatic 3D registration for interventional MRI-guided treatment of prostate cancer. Comput. Aided Surg. 2002;7:257–267. doi: 10.1002/igs.10052. [DOI] [PubMed] [Google Scholar]
- 22.Maes F, Collignon A, Vandermeulen D, Marchal G, Suetens P. Multimodality image registration by maximization of mutual information. IEEE Trans. Med. Imaging. 1997;16:187–198. doi: 10.1109/42.563664. [DOI] [PubMed] [Google Scholar]
- 23.Nelder J, Mead RA. A simplex method for function minimization. Comput. J. 1965;7:308–313. [Google Scholar]


