Abstract
Messenger RNA (mRNA) processing plays important roles in gene expression in all domains of life. A number of cases of mRNA cleavage have been documented in Archaea, but available data are fragmentary. We have examined RNAs present in Methanocaldococcus (Methanococcus) jannaschii for evidence of RNA processing upstream of protein-coding genes. Of 123 regions covered by the data, 31 were found to be processed, with 30 including a cleavage site 12–16 nucleotides upstream of the corresponding translation start site. Analyses with 3′-RACE (rapid amplification of cDNA ends) and 5′-RACE indicate that the processing is endonucleolytic. Analyses of the sequences surrounding the processing sites for functional sites, sequence motifs, or potential RNA secondary structure elements did not reveal any recurring features except for an AUG translation start codon and (in most cases) a ribosome binding site. These properties differ from those of all previously described mRNA processing systems. Our data suggest that the processing alters the representation of various genes in the RNA pool and therefore, may play a significant role in defining the balance of proteins in the cell.
Keywords: Archaea, transcription, translation, endonuclease, ribosome
INTRODUCTION
Transcription is often only the first step in the series of processes leading to a functional RNA. Many newly synthesized RNAs are processed into a mature functional form. Although RNA processing occurs in all domains of life, our knowledge of the systems in Archaea is limited compared with those in Eucarya and in Bacteria.
RNA processing involves molecular alterations: nucleolytic cleavages and trimming, terminal additions of nucleotides, and nucleoside modifications. The processing of transfer and ribosomal RNAs in Archaea is similar to that in Eucarya and Bacteria. In outline, the 5′ ends of tRNAs are processed by RNase P (Frank and Pace 1998; Xiao et al. 2002), and the 3′ ends are processed by RNase Z in all domains of life (Schiffer et al. 2002). Introns in pre-tRNAs are removed by splicing endonucleases (Tocchini-Valentini et al. 2005; Calvin and Li 2008). The archaeal endonuclease that removes tRNA introns is also involved in rRNA processing (Tang et al. 2002). The rRNAs of Archaea are cleaved from a pre-rRNA primary transcript (Potter et al. 1995), a process also found in Eucarya and Bacteria (Perry 1976). Maturation of rRNAs and particularly tRNAs also involves nucleoside modifications (Perry 1976; Hopper and Phizicky 2003; Omer et al. 2003).
The processing of messenger RNAs (mRNA) is less understood and differs greatly among the domains. Commonly, eukaryotic pre-mRNAs undergo 5′ capping, 3′ polyadenylation, and splicing before they are transported to the cytoplasm for translation into proteins. Bacterial mRNAs are not 5′ capped, and only 1%–40% are 3′ polyadenylated (Sarkar 1997). When they are polyadenylated, the length added (14–60 nucleotides [nt]) is shorter than the 80–200 nt added to eukaryotic mRNAs (Sarkar 1997). In contrast to eukaryotic poly(A) tracts, which usually stabilize mRNA against degradation by nucleases, the polyadenylation of a bacterial mRNA targets it for rapid degradation by 3′→5′exonucleases (Sarkar 1997). With rare exceptions, bacterial mRNAs do not have introns; so, no splicing is required before translation. Frequently, bacterial polycistronic mRNAs are cleaved into smaller mRNA segments with differing stabilities, a process that allows differential expression of genes in the same operon (Grunberg-Manago 1999; Rauhut and Klug 1999).
Like bacterial mRNAs, archaeal mRNAs are not 5′ capped. Evidence of poly(A) at the RNA 3′ ends has been reported in two Archaea: Methanococcus vannielii (Brown and Reeve 1985) and Halobacterium halobium (Brown and Reeve 1986). However, later studies have not found poly(A) on RNAs from Methanocaldococcus jannaschii (Best 2001) or haloarchaea (Portnoy et al. 2005; Brenneis et al. 2007). The vast majority of archaeal mRNAs lack introns. As in bacteria, many archaeal genes are transcribed polycistronically. There has been no systematic study of internal nucleolytic cleavage of archaeal mRNAs, but this processing appears to be relatively common. A survey of published Northern blot analyses found evidence of smaller mRNA species in ∼40% of more than 100 gels examined (J Zhang, unpubl.). Data showing RNAs smaller than the primary transcript appear in many studies (e.g., Auer et al. 1989; Kalmokoff and Jarrell 1991; Maupin-Furlow and Ferry 1996; Offner et al. 1996; Kessler et al. 1998; Ruppert et al. 1998). Because the data are distributed across more than 20 different archaeal species, it is difficult to draw general conclusions. In addition, the methods used in these studies (mostly Northern blots and primer extension) often cannot differentiate primary transcript ends, sites of specific nucleolytic cleavage, and ends resulting from nonspecific RNA degradation.
Methanocaldococcus (formerly Methanococcus) jannaschii is the first archaeon to have its genome fully sequenced (Bult et al. 1996). Its 1.7-Mb genome encodes >1700 protein-coding genes, and the protein products of >1000 (∼60%) of these genes have been detected by mass spectrometry (Zhu et al. 2004). The high fraction of genes expressed under standard growth conditions makes this an ideal organism for studying archaeal gene expression. In a previous study, we experimentally mapped the transcription start sites of over 100 M. jannaschii protein-coding genes (Zhang et al. 2009). To distinguish the ends of primary transcripts from RNA 5′ ends produced by processing events, we used 5′-RACE (rapid amplification of cDNA ends) with a modification introduced by Bensing et al. (1996). Based on the 5′-RACE data, we found that ∼20% of the mapped transcripts were processed at one or more sites upstream of their translation start codon (Zhang et al. 2009).
In this article, we present more detailed analyses of the processed RNAs. We also examine intergenic regions of some polycistronic transcripts for evidence of mRNA processing between genes. By comparing results of 5′-RACE with those of 3′-RACE, we determine whether the processing is the result of an endonucleolytic or exonucleolytic activity. Finally, we analyze the context of the processing sites for clues regarding the signals that might direct the processing.
RESULTS AND DISCUSSION
mRNA processing sites
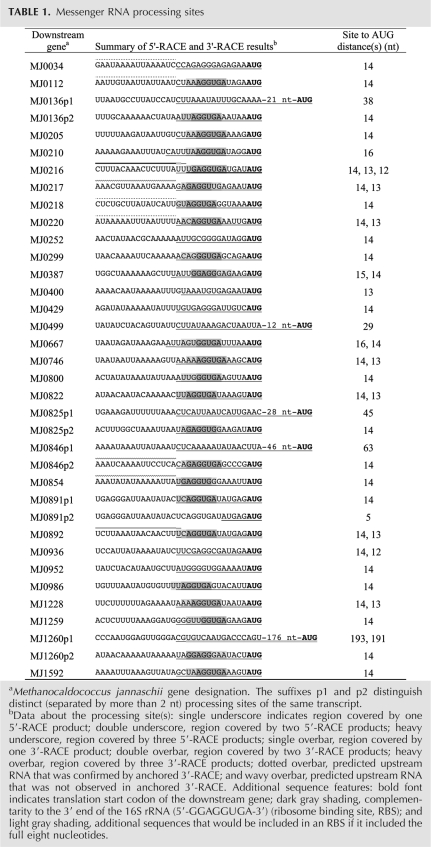
In a study of promoters in M. jannaschii, we examined transcripts of 135 protein-coding genes using 5′-RACE (Zhang et al. 2009). To differentiate the 5′ ends of (1) primary transcripts, (2) processed RNAs, and (3) RNA degradation products, we applied a modification of 5′-RACE in which results for untreated RNA samples are compared with those for RNAs that have been treated with tobacco acid pyrophosphatase (TAP) (Bensing et al. 1996; Zhang et al. 2009). In 5′-RACE, T4 RNA ligase is used to add a linker RNA to the 5′ ends of the RNA molecules, allowing identification of the 5′ ends by RT-PCR and sequencing. To accept the linker, an RNA must have a 5′ monophosphate group. Thus, a primary transcript can accept the linker only after its 5′ triphosphate group has been converted to a monophosphate by treatment with TAP. In contrast, an RNA that has been processed usually has a 5′ monophosphate, so it can accept the linker with or without TAP treatment. An RNA product of nonspecific degradation most commonly has a 5′ hydroxyl group and therefore cannot accept the linker regardless of treatment (i.e., it is not detectable by 5′-RACE). Of the 135 genes previously examined, 110 yielded 5′-RACE products, allowing us to identify one or more transcription start sites (5′ triphosphate termini) upstream of 107 of the genes (Zhang et al. 2009). Moreover, these data reveal one or more RNA processing sites (5′ monophosphate termini) upstream of 23 of the 110 genes (Table 1; see Supplemental Fig. S1B in Zhang et al. 2009).
TABLE 1.
Messenger RNA processing sites
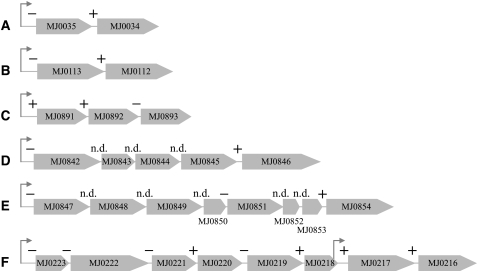
To maximize the discovery of promoters, we had chosen each of the previously examined genes (based on genomic context) as likely the initial gene of its respective transcript (Zhang et al. 2009). To see whether processing occurs between genes in polycistronic mRNAs, we selected 14 intergenic regions for 5′-RACE analysis (Fig. 1). In one case, MJ0217, we observed a processing site, but also an unexpected transcription start site inside the upstream gene. Therefore we include this gene in the above count of “initial genes.” Of the remaining 13 intergenic regions examined, we observed RNA processing in eight (Fig. 2A; Table 1). Although these numbers are small, there is a significantly (P < 0.01) greater occurrence of processing in intergenic regions (8/13) than in the regions preceding the initial gene of a transcription unit (23/110).
FIGURE 1.
Survey of RNA processing sites in operons. + indicates regions with processing observed (exact sites are in Table 1); −, regions with processing not observed; and n.d., experiment not done. Promoters are indicated with a bent arrow. In particular, note that there is a promoter upstream of MJ0217, inside the MJ0218 gene. Operons surveyed: (A) MJ0035–34, iron-sulfur cluster assembly proteins SufC and SufB; (B) MJ0113–112, CO dehydrogenase/acetyl-CoA synthase subunit delta, and 5-tetrahydromethanopterin:corrinoid iron-sulfur protein methyltransferase/CO dehydrogenase/acetyl-CoA synthase subunit γ; (C) MJ0891–893, Flagellins B1, B2, and B3; (D) MJ0842–846, Methyl coenzyme M reductase β subunit, operon protein D, operon protein C, γ subunit, and α subunit; (E) MJ0847–854, N5-methyltetrahydromethanopterin:coenzyme M methyltransferase subunits E, D, C, B, A, F, G, and H; and (F) MJ0223–216, V-type ATP synthase subunits G, I, K, E, C, F, A, and B.
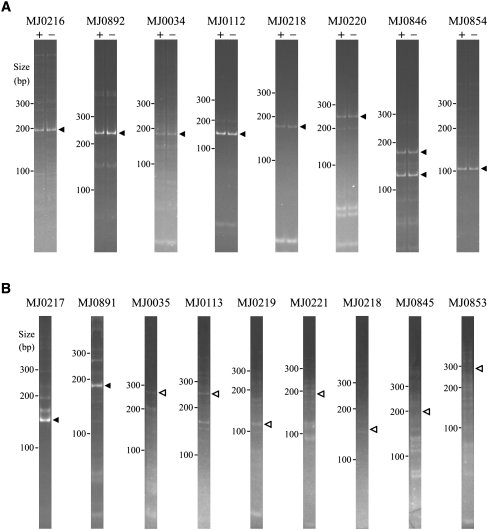
FIGURE 2.
Gel analyses of RACE products corresponding to RNA processing sites. (A) Products of 5′-RACE for RNA samples that have been treated (+ lanes) or not treated (− lanes) with TAP. RNA processing products produce bands in both lanes. Bands identified by sequencing as coming from the desired gene are marked by solid arrowheads. (B) Products of 3′-RACE reactions. Solid arrowheads indicate discrete 3′ termini coinciding with cleavage sites also seen by 5′-RACE. Open arrowheads indicate expected locations of RNAs produced by other processing sites.
The mRNA processing is endonucleolytic
The above observations are of RNAs with processed 5′ ends. These could be due to an endonucleolytic cleavage, or a 5′→3′ exonuclease activity. If the mRNA processing were endonucleolytic, then the cleavages would also produce RNAs with corresponding 3′ ends, whereas an exonuclease would degrade all upstream sequences. We used 3′-RACE to search for 3′ ends of upstream cleavage products. An RNA linker was ligated to the 3′ ends of cellular RNAs, and specific RNAs were sought by RT-PCR amplification between a gene-specific primer and the linker-specific primer. Products were verified by sequencing.
We applied this analysis to the RNA upstream of each of the above eight intergenic processing sites and that of MJ0217 (Fig. 2B). These analyses identified discrete RNA 3′ termini following MJ0217 and MJ0891, the genes immediately upstream of MJ0216 and MJ0892 (Table 1, solid overbars). The observed RNA 3′ ends are precisely those expected if endonucleolytic cleavages produce the processed 5′ ends upstream of MJ0216 and MJ0892. The 3′-RACE technique cannot distinguish a processed 3′ end from a transcription termination location (both of which leave a 3′ hydroxyl group), but the coincident end locations lead us to conclude that in each case the pair of RNAs comprises the two products of an endonucleolytic cleavage of a common transcript.
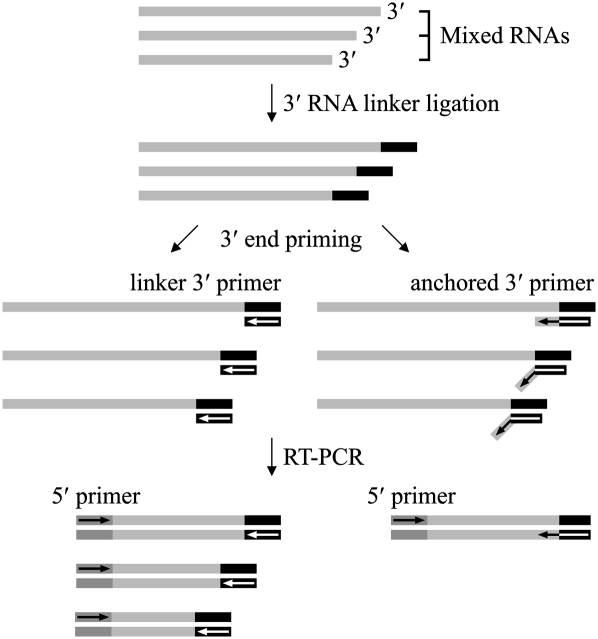
For the other seven genes examined by 3′-RACE we did not observe distinct PCR bands in the gels. Instead, we observed a faint smear (Fig. 2B), a characteristic of heterogeneous 3′ ends. In Bacteria, heterogeneous 3′ ends are very common on mRNAs due to the 3′→5′ exonucleolytic decay of the RNA (Steege 2000). To detect specific RNA 3′ ends in the heterogeneous mixture, we used anchored 3′ primers for PCR amplification. These primers have 14 nt complementary to the 3′ RNA linker, followed by an additional 6 nt that are gene specific (Fig. 3). Using this approach, we detected the predicted 3′ ends of an additional four upstream RNAs (dotted overbars in Table 1). These results demonstrate the existence of the predicted RNA segments but do not prove that they result from the processing event observed in the 5′-RACE. Although we consider it unlikely, they could originate by exonucleolytic degradation from the 3′ end of the polycistronic primary transcript. The predicted 3′ ends of the remaining three RNAs were not observed, even with anchored 3′ primers (Table 1, wavy overbars).
FIGURE 3.
Diagram illustrating the differences in 3′-RACE using the linker 3′ primer (left side) versus using an anchored 3′ primer (right side). The pairing of the anchored primers is only complete when the linker is ligated to a specific RNA sequence.
Overall, our data are consistent with endonucleolytic cleavage of the transcripts. In most cases, this seems to be followed by 3′→5′ exonucleolytic degradation of the upstream segment from the newly exposed 3′ end, though there appear to be gene-to-gene differences in this latter activity. These data are not consistent with the observed processing being due to a 5′→3′ exonuclease activity, which would not generate the RNAs observed by 3′-RACE.
Sequence analyses of mRNA processing sites
RNA primary structure is usually a major determinant of internal cleavage of mRNAs. For example, RNase E, a central endonuclease in Bacteria, exhibits sequence conservation near its cleavage site (Cohen and McDowall 1997). To look for common sequence features near the M. jannaschii mRNA processing sites, we performed a motif search using the program MEME (Bailey et al. 2006). As input, the DNA sequences flanking each processing site (positions −16 to +17, relative to the site) were retrieved from the M. jannaschii genome. When we searched for motifs that occur either zero or one times per sequence, the only motif found by MEME was the ribosome binding site (RBS). When we restricted the search to sequences downstream from the RBS, the only additional motif found was the AUG start codon. When we restricted the search to sequences upstream of the RBS, no motifs were found.
Of the 31 processed transcripts, 30 include a processing site 14 ± 2 nt upstream of the translation start site (the exception being the transcript of MJ0499) (Table 1). The recurring pattern of mRNA cleavage at this location has not been previously reported, and suggests a relationship to translation. The only processing site upstream of MJ0499 falls outside of this range, and five of the other transcripts also include an additional site outside of this range. We have examined the sequences surrounding these six “noncanonical” sites for overlooked small open reading frames or shared features, and have not found any. Due to the uncertainty in the relationship between the 30 sites that are at a canonical spacing (14 ± 2 nt upstream of the initiator codon) and the six that are not, most of our analyses below focus on the 30 sites.
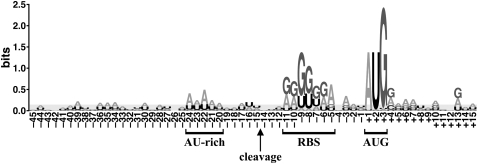
For each of the three features commonly present near the processing sites (an initiator codon, a RBS, and the cleavage site per se), we constructed alignments to examine the sequences surrounding the processing sites anchored on that particular feature. To visually assess conservation, we represented the aligned sequences as energy-normalized sequence logos (Workman et al. 2005). The alignment anchored on the initiator codon is shown in Figure 4; we see a completely conserved translation start codon (AUG), a G-rich region corresponding to the RBS, and a slightly AU-rich region. Consistent with the results with MEME, no other sequence conservation near the cleavage site was observed in these logos.
FIGURE 4.
Energy-normalized sequence logo of the sequences flanking the processing sites. The sequences flanking 30 processing sites (MJ0499 was excluded) were aligned to the translation start codon, and a logo was generated using the method of Workman et al. (2005). The light gray area is a background level that is tall enough to completely cover 90% of the logos generated from random sequences.
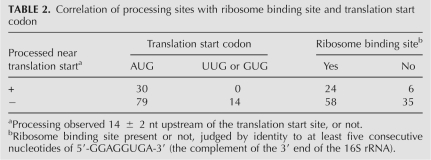
All 30 canonical processing sites are followed by an AUG initiator codon, even though ∼13% of the genes in this organism use UUG and GUG initiators. Over the 123 genes for which we have data, a comparison of start codon usage shows a marginally significant (P < 0.05 in a χ2 test) enrichment of AUG start codons among processed RNAs relative to nonprocessed RNAs (Table 2). An AUG start codon is clearly not sufficient for RNA processing; 79 of the 109 genes with an AUG start codon do not display an upstream processing site (Table 2).
TABLE 2.
Correlation of processing sites with ribosome binding site and translation start codon
The processing of upstream regions is not correlated with the presence or absence of an RBS (Table 2). A χ2 test shows no significant difference in RBS presence between processed and nonprocessed RNAs.
We noted an AU-rich region 8 nt upstream of the most common cleavage location (Fig. 4). However, a similar enrichment is seen in the same region of the nonprocessed transcripts. This AU richness is primarily an excess of A, which is perhaps the best compositional bias to avoid forming secondary structures that might block access to an RBS and/or initiator codon.
RNA processing can also be directed by secondary structure, as seen with RNase III (Nicholson 1999), RNase P (Kazantsev and Pace 2006), and RNase M5 (Stahl et al. 1980). No secondary structures stable at 85°C, the optimal growth temperature of M. jannaschii (Jones et al. 1983), are predicted near any of the processing sites (Materials and Methods). This is consistent with the particularly low G + C content near the processing sites. In contrast, all known M. jannaschii RNAs with stable secondary structures (tRNAs, rRNAs, and several noncoding RNAs) have a G + C content substantially above the genome average (Klein et al. 2002; Schattner 2002; Li 2007). Thus we conclude that the processing sites are not marked by RNA secondary structures.
Relationship of processing sites to translation
The only two recurring sequence features observed near the processing sites, an AUG start codon and an RBS, are both translation initiation signals. This suggests that the processing event might be associated with, and possibly linked to, translation of the RNA. Not all processed RNAs have an RBS, and there is no difference in RBS frequency between processed and nonprocessed transcripts, suggesting that the RBS is not directly relevant to the processing. Even when an RBS is present, the distance from the processing site to the initiator codon (13.9 ± 0.8 nt, mean ± SD) is significantly (P < 0.005) less variable than the distance to the RBS (1.1 ± 1.3 nt).
We consider this correlation of cleavage sites with translation initiation sites to be compelling, suggesting that the processing is somehow coincident with translation initiation. However, not all translation start sites have an associated cleavage site. In addition, six of the 36 processing sites identified are not within the 12- to 16-nt range.
Possible roles of mRNA processing in the cell
The role of internal cleavage of an RNA could be twofold. It could influence the relative stabilities of the upstream and downstream RNA segments, and it could affect the translational efficiency of the downstream coding region.
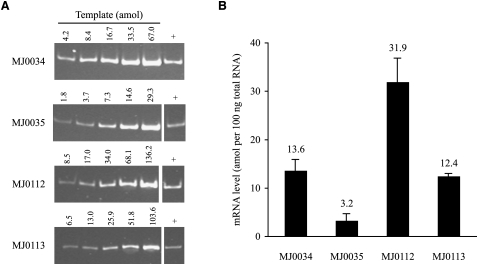
Each gene in a polycistronic operon will initially have the same abundance in the RNA products, unless early transcription termination decreases the representation of later genes. One mechanism by which Bacteria differentially express genes in an operon is cleavage of an mRNA into segments with different stabilities (Grunberg-Manago 1999; Rauhut and Klug 1999). This might also be true in Archaea. Our 5′-RACE and 3′-RACE data (Fig. 2) suggest a differential stability of the upstream and downstream RNAs; for a given processing site, the 3′-RACE products tended to be more heterogeneous (as though being degraded) and/or less abundant (harder to detect) than the 5′-RACE products. This is very indirect evidence, so in two cases we also measured the amounts of the upstream and downstream RNAs. RT-PCR analyses (Fig. 5) show that the RNAs for MJ0034 and MJ0112 (downstream from processing sites) are 4.2- and 2.6-fold more abundant than their preceding genes (MJ0035 and MJ0113, respectively).
FIGURE 5.
Comparison of mRNA abundances upstream of and downstream from two processing sites by RT-PCR. (A) Ethidium bromide–stained polyacrylamide gels of the PCR products from DNA standards (left five lanes) and 100 ng of reverse transcribed cellular RNA (+). Amount of DNA in each standard is indicated above the lane. (B) Calculated amount of each RNA per 100 ng total cellular RNA (mean and SD of two experiments).
It is also expected that the genes in a polycistronic mRNA will be translated at equal levels, though this can be affected by imperfect ribosome processivity and by internal ribosome recruitment. RNA processing can decouple translational efficiency of the various genes in a long mRNA. As noted, most of the processing sites are 12–16 nt from a translation start site, immediately upstream of the RBS (when present). The processing might modulate (perhaps increase) the relative translation of the gene products immediately following the cleavage site. Although a formal possibility, this is not supported by the distribution of processing sites amongst genes in the genome. For example, there is no significant correlation of presence of a processing site before the first gene of a transcript and the length of the 5′-untranslated region (UTR). If a long 5′-UTR lowered translational efficiency, then one would expect a higher frequency of processing in transcripts with long 5′-UTRs, but no such trend is evident.
Is mRNA processing “mostly harmless”?
With respect to the downstream gene, cleavage 14 nt upstream of the initiator codon is unlikely to be detrimental and might even be beneficial to ribosome recruitment. In terms of the upstream gene, only one of the observed processing sites lies within a protein-coding sequence (MJ0219) and hence inactivates it. The other sites either precede the first gene in a transcript or fall between two coding sequences.
It is possible that the concentration of processing sites in a 5-nt interval (12–16 nt upstream of the translation initiation site) is merely a consequence of the fact that this is approximately the region of mRNA protected by a ribosome during translation initiation. If cleavage at this location did no harm, then the seemingly meaningful clustering of sites could be no more than an increased vulnerability of the sequence region as a side effect of translation initiation.
However, one observation leads us to prefer the view that there is a biological benefit bestowed by the activity. The higher frequency of intergenic cleavage sites than sites upstream of the first gene of operons is unlikely to be due to chance. If there were no selection for sites, it would be hard to explain the relative paucity of sites at the beginning of transcripts, where one would expect fewer constraints.
In summary, endonucleolytic processing of mRNA is common in M. jannaschii. It is more common in the transcribed spacer between genes than in the 5′-UTR. A combination of direct and indirect evidence suggests that the processing alters the representation of various genes in the RNA pool, and therefore may play a significant role in defining the balance of proteins in the cell.
MATERIALS AND METHODS
Genomic sequences of M. jannaschii were obtained through the Entrez system at the National Center for Biotechnology Information (NCBI) (Wheeler et al. 2007). Protein-coding genes in the genome were initially annotated by the coding region identification tool CRITICA (Badger and Olsen 1999), and their translation start locations were then curated by David E. Graham (University of Texas at Austin) using neighboring DNA features and comparative analyses of translation start codons of orthologs in related genomes (DE Graham, pers. comm.).
Preparation of M. jannaschii total cellular RNA
M. jannaschii strain JAL-1T (DSM 2661) was grown in conditions as described (Zhu et al. 2004). Total cellular RNA was isolated from mid-log phase cells as previously described (Zhang et al. 2009).
Rapid amplification of cDNA ends
The 5′-RACE protocol was adapted from the method of Bensing et al. (1996) and was described by Zhang et al. (2009). For 3′-RACE, the 3′ ends of 10 μg M. jannaschii total cellular RNA were ligated with 100 pmol 3′ RNA linker (A-5′-pp-5′-CUGUAGGCACCAUCAAU-ddC-3′ [Lau et al. 2001]; Integrated DNA Technologies) by incubation at 17°C for 16 h with 10 U T4 RNA ligase (Epicentre Technologies) in the presence of 40 U rRNasin. The 3′-RNA-linker-ligated total cellular RNA was purified with the RNeasy Mini Kit (Qiagen) and then hybridized with 100 pmol linker 3′ primer (5′-ATTGATGGTGCCTACAG-3′; complementary to the 3′ RNA linker) by incubation for 5 min at 75°C and then 5 min at 50°C. Reverse transcription was carried out by adding 200 U SuperScript III reverse transcriptase (Invitrogen) to the RNA/primer hybrid in 1× first-strand buffer, 1 mM DTT, 0.1 mg/mL BSA, 40 U rRNasin, and 1 mM each dNTP. The mixture was incubated for 60 min at 50°C, and the synthesized cDNAs were recovered by ethanol precipitation. The 3′ cDNA ends of individual genes were amplified by PCR with a gene-specific 5′ primer and the linker 3′ primer or an anchored 3′ primer. PCR products were resolved on a 6% (w/v) nondenaturing polyacrylamide gel, and the DNA bands of interest were excised. DNA was eluted from the excised gel region and reamplified by PCR, followed by sequencing with the BigDye Terminator v3.1 Cycle Sequencing Kit (Applied Biosystems). The 3′-end nucleotide of the original RNA is the transition point from genomic DNA sequence to the 3′ linker sequence.
Logo presentation
Sequences flanking the mRNA processing sites were retrieved from the M. jannaschii chromosome (NCBI accession number NC_000909.1) and aligned to the processing site, the translation start site, or the RBS. An energy-normalized sequence logo was generated from the resulting sequence alignment using the method of Workman et al. (2005).
Analysis of potential RNA secondary structures
We used the Vienna RNAfold (Hofacker 2003) program to predict RNA secondary structures near the processing sites. The region analyzed included 60 nt on each side of the cleavage site.
Location of processing relative to the RBS and initiator codon
We examined the variations in distance from processing site to RBS and processing site to initiator codon. The rows in Table 1 can include one, two, or three distinct locations. We calculated the average cleavage site to feature distance with equal weight per cleavage location. The location of the RBS was defined as the region covered by 5′-GGAGGUGA-3′, if the region of identity is extended to the entire 8 nt (Table 1, light and dark gray shading).
Measurement of RNA levels
Total cellular RNA was reverse transcribed with a mixture of (reverse) primers for the four desired genes (all are 5′ to 3′: MJ0034, TCCTCAGTGATTCCAAAGCA; MJ0035, CCCTCAAATCTTGCAGGTTC; MJ0112, ACCTCGTCTCCACCCATAAC; and MJ0113, GTGGATTTGGCTGTGGTTCT). For each gene, the corresponding forward (MJ0034, TTGTTCATGGTAAAGGACCAAG; MJ0035, TGTAGAGGAAAATGAGATTCATGC; MJ0112, GCATGGCATTTGCTACAAAA; and MJ0113, CTCCAATAGTTATTCCTCAAACAC) and reverse primers were added to the RT products from 100 ng of template RNA. The DNA corresponding to the added primers was amplified by 12–14 rounds of PCR, resolved on a polyacrylamide gel, ethidium bromide stained, and photographed, and the integrated band density was evaluated using Quantity One (Bio-Rad). For each gene, similar data were collected for known amounts of input DNA and used to construct a standard curve with Excel (Microsoft). The standard curve was then used to estimate the amount of the gene-specific DNA in the RT products, and thereby the amount of the RNA in the cellular RNA pool.
ACKNOWLEDGMENTS
We thank Claudia I. Reich for suggestions, assistance with the experiments, and critical review of the manuscript. We also thank David E. Graham (University of Texas at Austin) for providing his curated translation start locations of the protein-coding genes in M. jannaschii. This work was supported by grants from the National Aeronautics and Space Administration (NAG 5-12334 to G.J.O.) and the Department of Energy (DE-FG02-01ER63201 to G.J.O.).
Footnotes
Article published online ahead of print. Article and publication date are at http://www.rnajournal.org/cgi/doi/10.1261/rna.1715209.
REFERENCES
- Auer J, Spicker G, Böck A. Organization and structure of the Methanococcus transcriptional unit homologous to the Escherichia coli ‘spectinomycin operon.’ Implications for the evolutionary relationship of 70 S and 80 S ribosomes. J Mol Biol. 1989;209:21–36. doi: 10.1016/0022-2836(89)90167-8. [DOI] [PubMed] [Google Scholar]
- Badger JH, Olsen GJ. CRITICA: Coding region identification tool invoking comparative analysis. Mol Biol Evol. 1999;16:512–524. doi: 10.1093/oxfordjournals.molbev.a026133. [DOI] [PubMed] [Google Scholar]
- Bailey TL, Williams N, Misleh C, Li WW. MEME: Discovering and analyzing DNA and protein sequence motifs. Nucleic Acids Res. 2006;34:W369–W373. doi: 10.1093/nar/gkl198. [DOI] [PMC free article] [PubMed] [Google Scholar]
- Bensing BA, Meyer BJ, Dunny GM. Sensitive detection of bacterial transcription initiation sites and differentiation from RNA processing sites in the pheromone-induced plasmid transfer system of Enterococcus faecalis. Proc Natl Acad Sci. 1996;93:7794–7799. doi: 10.1073/pnas.93.15.7794. [DOI] [PMC free article] [PubMed] [Google Scholar]
- Best A. University of Illinois; Urbana: 2001. “Evolution of transcription in Archaea and the early-diverging eukaryote, Giardia lamblia.”. PhD dissertation, [Google Scholar]
- Brenneis M, Hering O, Lange C, Soppa J. Experimental characterization of cis-acting elements important for translation and transcription in halophilic Archaea. PLoS Genet. 2007;3:e229. doi: 10.1371/journal.pgen.0030229. [DOI] [PMC free article] [PubMed] [Google Scholar]
- Brown JW, Reeve JN. Polyadenylated, noncapped RNA from the archaebacterium Methanococcus vannielii. J Bacteriol. 1985;162:909–917. doi: 10.1128/jb.162.3.909-917.1985. [DOI] [PMC free article] [PubMed] [Google Scholar]
- Brown JW, Reeve JN. Polyadenylated RNA isolated from the archaebacterium Halobacterium halobium. J Bacteriol. 1986;166:686–688. doi: 10.1128/jb.166.2.686-688.1986. [DOI] [PMC free article] [PubMed] [Google Scholar]
- Bult CJ, White O, Olsen GJ, Zhou L, Fleischmann RD, Sutton GG, Blake JA, FitzGerald LM, Clayton RA, Gocayne JD, et al. Complete genome sequence of the methanogenic archaeon, Methanococcus jannaschii. Science. 1996;273:1058–1073. doi: 10.1126/science.273.5278.1058. [DOI] [PubMed] [Google Scholar]
- Calvin K, Li H. RNA-splicing endonuclease structure and function. Cell Mol Life Sci. 2008;65:1176–1185. doi: 10.1007/s00018-008-7393-y. [DOI] [PMC free article] [PubMed] [Google Scholar]
- Cohen SN, McDowall KJ. RNase E: Still a wonderfully mysterious enzyme. Mol Microbiol. 1997;23:1099–1106. doi: 10.1111/j.1365-2958.1997.tb02593.x. [DOI] [PubMed] [Google Scholar]
- Frank DN, Pace NR. Ribonuclease P: Unity and diversity in a tRNA processing ribozyme. Annu Rev Biochem. 1998;67:153–180. doi: 10.1146/annurev.biochem.67.1.153. [DOI] [PubMed] [Google Scholar]
- Grunberg-Manago M. Messenger RNA stability and its role in control of gene expression in bacteria and phages. Annu Rev Genet. 1999;33:193–227. doi: 10.1146/annurev.genet.33.1.193. [DOI] [PubMed] [Google Scholar]
- Hofacker IL. Vienna RNA secondary structure server. Nucleic Acids Res. 2003;31:3429–3431. doi: 10.1093/nar/gkg599. [DOI] [PMC free article] [PubMed] [Google Scholar]
- Hopper AK, Phizicky EM. tRNA transfers to the limelight. Genes & Dev. 2003;17:162–180. doi: 10.1101/gad.1049103. [DOI] [PubMed] [Google Scholar]
- Jones WJ, Leigh JA, Mayer F, Woese CR, Wolfe RS. Methanococcus jannaschii sp. nov.: An extremely thermophilic methanogen from a submarine hydrothermal vent. Arch Microbiol. 1983;136:254–261. [Google Scholar]
- Kalmokoff ML, Jarrell KF. Cloning and sequencing of a multigene family encoding the flagellins of Methanococcus voltae. J Bacteriol. 1991;173:7113–7125. doi: 10.1128/jb.173.22.7113-7125.1991. [DOI] [PMC free article] [PubMed] [Google Scholar]
- Kazantsev AV, Pace NR. Bacterial RNase P: A new view of an ancient enzyme. Nat Rev Microbiol. 2006;4:729–740. doi: 10.1038/nrmicro1491. [DOI] [PubMed] [Google Scholar]
- Kessler PS, Blank C, Leigh JA. The nif gene operon of the methanogenic archaeon Methanococcus maripaludis. J Bacteriol. 1998;180:1504–1511. doi: 10.1128/jb.180.6.1504-1511.1998. [DOI] [PMC free article] [PubMed] [Google Scholar]
- Klein RJ, Misulovin Z, Eddy SR. Noncoding RNA genes identified in AT-rich hyperthermophiles. Proc Natl Acad Sci. 2002;99:7542–7547. doi: 10.1073/pnas.112063799. [DOI] [PMC free article] [PubMed] [Google Scholar]
- Lau NC, Lim LP, Weinstein EG, Bartel DP. An abundant class of tiny RNAs with probable regulatory roles in Caenorhabditis elegans. Science. 2001;294:858–862. doi: 10.1126/science.1065062. [DOI] [PubMed] [Google Scholar]
- Li E. University of Illinois; Urbana: 2007. “Non-coding genomics of Methanocaldococcus jannaschii: A survey of promoters, non-coding RNA genes, and repetitive DNA elements.”. PhD dissertation, [Google Scholar]
- Maupin-Furlow JA, Ferry JG. Analysis of the CO dehydrogenase/acetyl-coenzyme A synthase operon of Methanosarcina thermophila. J Bacteriol. 1996;178:6849–6856. doi: 10.1128/jb.178.23.6849-6856.1996. [DOI] [PMC free article] [PubMed] [Google Scholar]
- Nicholson AW. Function, mechanism, and regulation of bacterial ribonucleases. FEMS Microbiol Rev. 1999;23:371–390. doi: 10.1111/j.1574-6976.1999.tb00405.x. [DOI] [PubMed] [Google Scholar]
- Offner S, Wanner G, Pfeifer F. Functional studies of the gvpACNO operon of Halobacterium salinarium reveal that the GvpC protein shapes gas vesicles. J Bacteriol. 1996;178:2071–2078. doi: 10.1128/jb.178.7.2071-2078.1996. [DOI] [PMC free article] [PubMed] [Google Scholar]
- Omer AD, Ziesche S, Decatur WA, Fournier MJ, Dennis PP. RNA-modifying machines in Archaea. Mol Microbiol. 2003;48:617–629. doi: 10.1046/j.1365-2958.2003.03483.x. [DOI] [PubMed] [Google Scholar]
- Perry RP. Processing of RNA. Annu Rev Biochem. 1976;45:605–629. doi: 10.1146/annurev.bi.45.070176.003133. [DOI] [PubMed] [Google Scholar]
- Portnoy V, Evguenieva-Hackenberg E, Klein F, Walter P, Lorentzen E, Klug G, Schuster G. RNA polyadenylation in Archaea: not observed in Haloferax while the exosome polynucleotidylates RNA in Sulfolobus. EMBO Rep. 2005;6:1188–1193. doi: 10.1038/sj.embor.7400571. [DOI] [PMC free article] [PubMed] [Google Scholar]
- Potter S, Durovic P, Dennis PP. Ribosomal RNA precursor processing by a eukaryotic U3 small nucleolar RNA-like molecule in an archaeon. Science. 1995;268:1056–1060. doi: 10.1126/science.7538698. [DOI] [PubMed] [Google Scholar]
- Rauhut R, Klug G. mRNA degradation in bacteria. FEMS Microbiol Rev. 1999;23:353–370. doi: 10.1111/j.1574-6976.1999.tb00404.x. [DOI] [PubMed] [Google Scholar]
- Ruppert C, Wimmers S, Lemker T, Muller V. The A1A0 ATPase from Methanosarcina mazei: Cloning of the 5′ end of the aha operon encoding the membrane domain and expression of the proteolipid in a membrane-bound form in Escherichia coli. J Bacteriol. 1998;180:3448–3452. doi: 10.1128/jb.180.13.3448-3452.1998. [DOI] [PMC free article] [PubMed] [Google Scholar]
- Sarkar N. Polyadenylation of mRNA in prokaryotes. Annu Rev Biochem. 1997;66:173–197. doi: 10.1146/annurev.biochem.66.1.173. [DOI] [PubMed] [Google Scholar]
- Schattner P. Searching for RNA genes using base-composition statistics. Nucleic Acids Res. 2002;30:2076–2082. doi: 10.1093/nar/30.9.2076. [DOI] [PMC free article] [PubMed] [Google Scholar]
- Schiffer S, Rosch S, Marchfelder A. Assigning a function to a conserved group of proteins: The tRNA 3′-processing enzymes. EMBO J. 2002;21:2769–2777. doi: 10.1093/emboj/21.11.2769. [DOI] [PMC free article] [PubMed] [Google Scholar]
- Stahl DA, Meyhack B, Pace NR. Recognition of local nucleotide conformation in contrast to sequence by a rRNA processing endonuclease. Proc Natl Acad Sci. 1980;77:5644–5648. doi: 10.1073/pnas.77.10.5644. [DOI] [PMC free article] [PubMed] [Google Scholar]
- Steege DA. Emerging features of mRNA decay in Bacteria. RNA. 2000;6:1079–1090. doi: 10.1017/s1355838200001023. [DOI] [PMC free article] [PubMed] [Google Scholar]
- Tang TH, Rozhdestvensky TS, d'Orval BC, Bortolin ML, Huber H, Charpentier B, Branlant C, Bachellerie JP, Brosius J, Hüttenhofer A. RNomics in Archaea reveals a further link between splicing of archaeal introns and rRNA processing. Nucleic Acids Res. 2002;30:921–930. doi: 10.1093/nar/30.4.921. [DOI] [PMC free article] [PubMed] [Google Scholar]
- Tocchini-Valentini GD, Fruscoloni P, Tocchini-Valentini GP. Coevolution of tRNA intron motifs and tRNA endonuclease architecture in Archaea. Proc Natl Acad Sci. 2005;102:15418–15422. doi: 10.1073/pnas.0506750102. [DOI] [PMC free article] [PubMed] [Google Scholar]
- Wheeler DL, Barrett T, Benson DA, Bryant SH, Canese K, Chetvernin V, Church DM, DiCuccio M, Edgar R, Federhen S, et al. Database resources of the National Center for Biotechnology Information. Nucleic Acids Res. 2007;35:D5–D12. doi: 10.1093/nar/gkl1031. [DOI] [PMC free article] [PubMed] [Google Scholar]
- Workman CT, Yin Y, Corcoran DL, Ideker T, Stormo GD, Benos PV. enoLOGOS: A versatile web tool for energy normalized sequence logos. Nucleic Acids Res. 2005;33:W389–W392. doi: 10.1093/nar/gki439. [DOI] [PMC free article] [PubMed] [Google Scholar]
- Xiao S, Scott F, Fierke CA, Engelke DR. Eukaryotic ribonuclease P: A plurality of ribonucleoprotein enzymes. Annu Rev Biochem. 2002;71:165–189. doi: 10.1146/annurev.biochem.71.110601.135352. [DOI] [PMC free article] [PubMed] [Google Scholar]
- Zhang J, Li E, Olsen GJ. Protein-coding gene promoters in Methanocaldococcus (Methanococcus) jannaschii. Nucleic Acids Res. 2009;37:3588–3601. doi: 10.1093/nar/gkp213. [DOI] [PMC free article] [PubMed] [Google Scholar]
- Zhu W, Reich CI, Olsen GJ, Giometti CS, Yates JR., 3rd Shotgun proteomics of Methanococcus jannaschii and insights into methanogenesis. J Proteome Res. 2004;3:538–548. doi: 10.1021/pr034109s. [DOI] [PubMed] [Google Scholar]


