

Abstract
The universally conserved CCA sequence is present at the 3′ terminal 74–76 positions of all active tRNA molecules as a functional tag to participate in ribosome protein synthesis. The CCA enzyme catalyzes CCA synthesis in three sequential steps of nucleotide addition at rapid and identical rates. However, the kinetic determinant of each addition is unknown, thus limiting the insights into the kinetic basis of CCA addition. Using our recently developed single turnover kinetics of Escherichia coli CCA enzyme as a model, we show here that the identical rate of the stepwise CCA addition is determined by distinct kinetic parameters. Specifically, the kinetics of C74 and C75 addition is controlled by the chemistry of nucleotidyl transfer, whereas the kinetics of A76 addition is controlled by a prechemistry conformational transition of the active site. In multiple turnover condition, all three steps are controlled by slow product release, indicating enzyme processivity from one addition to the next. However, the processivity decreases as the enzyme progresses to complete the CCA synthesis. Together, these results suggest the existence of a network of diverse kinetic parameters that determines the overall rate of CCA addition for tRNA maturation.
Keywords: nucleotidyl transferase, pulse–quench, pulse–chase
INTRODUCTION
The CCA sequence is important for tRNA function, as it provides the site for amino acid attachment to synthesize aminoacyl–tRNA and it stabilizes tRNA–ribosome interactions in each cycle of peptide bond formation (Korostelev et al. 2006). The enzyme responsible for CCA synthesis is the ubiquitous CCA enzyme, which can exist in one of two structural classes: enzymes of archaeal origins belong to class I, whereas those of eukaryotic and bacterial origins belong to class II (Yue et al. 1996). Importantly, in organisms that do not encode the CCA sequence in their tRNA genes, the CCA enzymes are essential for growth (Aebi et al. 1990). In organisms that do encode the CCA sequence, such as Escherichia coli, the CCA enzymes perform the repair function to regenerate the sequence from nuclease-damaged 3′ ends (Zhu and Deutscher 1987). Even in the latter case, where de novo transcription continues to generate full-length tRNA, inactivation of the CCA enzyme severely impairs cell growth, suggesting that the delay in CCA addition and accumulation of defective tRNA termini is deleterious to cell growth.
The kinetics of CCA addition in the repair function is not well understood. Notably, RNA transcription in the repair function starts at the site of damage, which is different from the classic transcription, where an RNA polymerase starts with a promoter-bound initiation complex and moves into an elongation complex. In the elongation phase of classic transcription, while the rate of each nucleotide addition may vary due to variations of local environments, the kinetic determinant for each addition is constant, driven by the uniform base-pairing structure between the template and incoming nucleotides. The CCA enzyme does not form an initiation complex and does not use a nucleic acid template, raising the possibility that the identity of each nucleotide substrate may play a more prominent role in the kinetics of nucleotide addition compared with the classic and template-dependent transcription.
Nucleotide addition in classic DNA and RNA polymerases begins with binding of the nucleotide substrate to an “open” state of the enzyme active site in complex with a template nucleotide. This open state provides an easy access to allow rapid binding, but is insufficient to establish the required network of specific interactions for catalysis (Showalter and Tsai 2002; Joyce and Benkovic 2004; Tsai and Johnson 2006; Bakhtina et al. 2007). Following the nucleotide binding are two key events that are the basis of nucleotide addition. The first is a prechemistry active site conformational transition from the “open” to a “close” state, which is induced by the bound nucleotide to bring the reactive groups together into a compact state that is competent for catalysis. The second is the chemistry of nucleotidyl transfer, usually involving one metal ion to deprotonate the 3′-OH of the primer terminus and a second metal ion to stabilize the pyrophosphate leaving group (Steitz and Steitz 1993; Steitz 1998). Depending on the nature of the polymerase, either the prechemistry or the chemistry step is the kinetic determinant of nucleotide addition. Recent crystal structural analysis of CCA enzymes suggests a similar setup of such kinetic determinants for both classes. Specifically, both classes exhibit successive open-to-close active-site transitions from one nucleotide addition to the next (Tomita et al. 2004, 2006; Xiong and Steitz 2004; Toh et al. 2008), and both have the capacity to employ two metal ions for catalysis (Hou et al. 2005). However, the kinetic determinant of each nucleotide addition is unknown; neither is the variability of the determinant in the absence of a nucleic acid template. The lack of answers to these questions prevents an understanding of how the CCA addition kinetics is relevant to cell growth.
We have recently developed single turnover kinetic measurements for the E. coli CCA enzyme, showing that it differs from classic RNA polymerases by exhibiting identical rates in all three steps of nucleotide addition (maximum at 170 ± 20 sec−1) (Dupasquier et al. 2008). The single turnover kinetics measures the rate of a single round of nucleotide addition under conditions of rapid equilibrium binding of enzyme–substrate complexes, such that the rate is not limited by binding but by the kinetic event that controls the nucleotide addition. Because this technique can directly measure the reaction rate constant under equilibrium condition, it is appropriate to use to elucidate the kinetic determinant for each nucleotide addition. Also, we have shown that the single turnover rate of the E. coli CCA enzyme is significantly faster than the previously estimated steady-state rate (Seth et al. 2002; Hou et al. 2005), suggesting the possibility of slow product release. This raises the further question of the relationship between the synthesis and release of each addition and the nature of processivity. Here we used the E. coli CCA enzyme to address these questions by probing the relative roles of the prechemistry step, the chemistry step, and the control of product release. We show that, unlike classic polymerases, each nucleotide addition in CCA synthesis is determined by distinct kinetic parameters, suggesting the existence of multiple strategies employed by this enzyme to perform the repair function.
RESULTS
The thio effect of nucleotide addition
Model studies showed that a rate-limiting chemical step of making or breaking of a phosphate bond exhibits a thio effect upon substitution of the normal NTP substrate with the α-phosphorothioate derivative (NTPαS) (Mizrahi et al. 1985). If an observed rate is a direct function of the chemistry step, the thio substitution should decrease the rate, because sulfur is less effective than oxygen at stabilizing the transition state of nucleotidyl transfer. Most of the classic polymerases exhibit a thio effect, with varying degrees (Tsai and Johnson 2006; Bakhtina et al. 2007), although some lack a thio effect (Anand and Patel 2006), suggesting that in the latter case the rate of nucleotide addition is limited by a step other than the chemistry. We tested the thio effect of E. coli CCA enzyme, using the recently developed single turnover kinetic technique (Dupasquier et al. 2008). The kinetics was measured upon rapid mixing of an NTP substrate with a preformed enzyme–tRNA complex, in which the enzyme was in molar excess of the tRNA to ensure only one turnover. In this single turnover condition, because the enzyme and substrate concentrations were high, the reaction rate was not limited by formation of enzyme–substrate complexes but by the rates concerning the nucleotide addition, primarily the prechemistry step of enzyme active site conformational transition and the chemistry step of nucleotidyl transfer.
The tRNA substrate for each addition was prepared by in vitro transcription based on the sequence of E. coli tRNAVal (Fig. 1), and was 32P-labeled and gel purified. Denaturing gels were used to separate each tRNA substrate from the product of one nucleotide addition and were visualized and quantified by phosphorimage analysis. The kinetics of nucleotide addition showed no lag phase, and was well fit to a single exponential equation, allowing determination of the apparent rate constant (kapp, sec−1). Analysis of kapp as a function of NTP concentration showed the maximum rate for addition of the N nucleotide (kN). This analysis also revealed the value of the NTP concentration at the half maximum rate, which under rapid binding equilibrium is interpreted as the kinetic Kd of the NTP for the enzyme–tRNA complex. The kinetics was then performed with the corresponding NTPαS analog to evaluate the thio effect.
FIGURE 1.

Sequence and cloverleaf structure of E. coli tRNAVal, where the CCA sequence at the 3′ end is boxed.
The C74 addition kinetics with the normal CTP substrate showed the kC74 of 118 ± 3 sec−1 (Fig. 2A), which is 70% of the previously obtained maximum rate and is consistent with the level of enzyme saturation (8 μM) relative to the Kd (3.3 μM) of the tRNAA73 substrate (transcription up to the discriminator base A73) (Dupasquier et al. 2008). The Kd for CTP binding to the enzyme–tRNA complex was 47 ± 6 μM, leading to the kC74/Kd value of 2.5 × 10⁶ M−1 sec−1. The single-turnover parameter kC74/Kd has been the standard for estimating polymerase fidelity (Johnson 1993), and is used here to interpret specificity. However, replacement of CTP with CTPαS (the pro-Sp isomer) decreased kC74 to 68 ± 4 sec−1 and increased the Kd of the nucleotide substrate to 200 ± 40 μM, leading to a nearly 10-fold reduction of kC74/Kd to 0.3 × 10⁶ M−1sec−1. This demonstrates a thio effect of 10-fold, and suggests that the rate of chemistry is dominant in C74 addition. Similarly, the C75 addition kinetics was more favorable with CTP (kC75 = 120 ± 3 sec−1, Kd = 39 ± 5 μM) than with CTPαS (kC75 = 69 ± 5 sec−1, Kd = 170 ± 40 μM) in both the rate and affinity (Fig. 2B). Analysis of the ratio of kC75/Kd values [(3 versus 0.4) × 106 M−1 sec−1] also indicates a 10-fold thio effect, suggesting that the chemistry dominance is at the same level as that of C74 addition. In contrast, the A76 addition kinetics with ATP was as efficient (kA76 = 124 ± 4 sec−1, Kd = 42 ± 6 μM) as with ATPαS (kA76 = 119 ± 4 sec−1, Kd = 42 ± 7 μM) in both the rate and affinity (Fig. 2C), indicating no thio effect based on virtually identical kC75/Kd values [(2.9 versus 2.8) × 106 M−1 sec−1]. This suggests that the rate of chemistry is no longer dominant for A76 addition, and that the prechemistry step involving the open-to-close transition of the active site is dominant.
FIGURE 2.

Analysis of single turnover rate of nucleotide addition (kapp, sec−1) as a function of NTP concentration (μM) fit to a hyperbolic equation. (A) Addition of C74 to tRNAA73. (B) Addition of C75 to tRNAC74. (C) Addition of A76 to tRNAC75. Each experiment contained 8 μM E. coli CCA enzyme and 1 μM of the appropriate 32P-tRNA substrate with the indicated concentrations of NTP. The rate constant of each experiment (kapp, sec−1) was calculated from a time course of product synthesis (percent of substrate conversion to product) fit to a single exponential equation as described in Materials and Methods. The rate constant of each experiment (kapp, sec−1) was plotted as the y-axis versus NTP concentration as the x-axis.
The thio effect on each step of CCA addition is summarized in Table 1. Analysis of the thio effect on kN/Kd provides the basis that C74 and C75 addition is affected by the thio substitution, indicating that the chemistry step is the kinetic determinant, whereas A76 addition is not affected by the thio substitution, indicating that the prechemistry step is the kinetic determinant. We note that, strictly speaking, it should be the steady-state parameter kcat/Km that defines the specificity factor. However, because all of the kinetics are well fit to a single exponential equation, and because all of the plots of rate versus concentration exhibit hyperbola, these indicate that NTP or NTPαS binding is a rapid equilibrium process and that nucleotide addition is governed by a single rate-limiting step. In this condition, the single turnover parameter kN/Kd is approximately equal to the steady state parameter kcat/Km (Tsai and Johnson 2006). We also note that, in the C74 and C75 addition reactions, the thio effect is stronger on the NTPαS binding (fourfold effect on Kd) than on the chemistry of nucleotidy transfer (2.5-fold effect on kN), suggesting that the thio substitution affects more on the ground-state nucleotide binding event than on the bond making or breaking process. Despite this, the observation of the thio effect suggests that the ground-state binding event for chemistry is more important than the binding-induced active site transition. Importantly, because the thio effect is observed in the C addition reactions, but not in the A addition reaction, the interpretation is valid in that the kinetics of C addition is determined by chemistry (including the events of both NTP binding and catalysis), whereas the kinetics of A addition is not.
TABLE 1.
Thio effect of nucleotide addition in CCA synthesis at 37°Ca

The glycerol effect
We examined the effect of increasing solvent viscosity as a probe to selectively perturb the prechemistry enzyme conformational transition step. If the transition played a major role in the measured rate, such as in the A-addition reaction, an increase in solvent viscosity by increasing the concentration of glycerol would reduce the rate. The starting glycerol concentration in the single turnover buffer was 10%, which was contributed by the enzyme storage buffer. An increase of glycerol to 35% did not significantly affect the rate of C74 addition (94 ± 9 versus 86 ± 10 sec−1) (Fig. 3A) or the rate of C75 addition (112 ± 11 versus 96 ± 18 sec−1), supporting the notion that the enzyme conformational transition is not dominant in these reactions. In contrast, the increase of glycerol concentration decreased the rate of A76 addition by approximately fivefold (115 ± 18 versus 25 ± 2 sec−1) (Fig. 3C), similar to the two- to threefold decrease observed for DNA pol β, a well-characterized template-dependent polymerase that is sensitive to increases of glycerol concentration (Bakhtina et al. 2005, 2007). The glycerol effect on the rate of A76 addition supports the notion that an enzyme conformational transition is dominant in this reaction. Thus, consistent with the thio effect, the C addition reactions are not sensitive to glycerol effect, suggesting that the enzyme conformational transition is not dominant, whereas the A addition reaction is sensitive to glycerol effect, suggesting that the enzyme conformational transition is dominant.
FIGURE 3.

Comparison of single turnover kinetics of CCA addition in the presence of 10% and 35% glycerol. (A) Addition of C74 to tRNAA73. (B) Addition of C75 to tRNAC74. (C) Addition of A76 to tRNAC75. Each experiment contained 8 μM E. coli CCA enzyme and 1 μM of the appropriate 32P-tRNA with 1 mM CTP (for addition of C74 and C75) or ATP (for addition of A76). The percent conversion of substrate to product was resolved by denaturing gels and was plotted as the y-axis versus a time course as the x-axis. The rate constant of each plot (kapp, sec−1) was derived from fitting the data to a single exponential equation (see Materials and Methods).
Interestingly, solvent viscosity also had different effects on the amplitude of these reactions. While an increase of viscosity did not alter the amplitude of A76 addition (Fig. 3C), it decreased the amplitude of C75 and C74 addition from 80% to 50% (Fig. 3A,B), indicating that the active fraction of enzyme–tRNA complexes in the latter cases was decreased by the increase in solvent viscosity.
Pulse–quench and pulse–chase experiments
The kinetic determinant for each nucleotide addition was further assessed by pulse–quench and pulse–chase experiments, using [α-32P]-labeled NTP as the substrate. In the pulse–quench experiments, all enzyme-bound complexes that were formed during a short pulse were immediately quenched, whereas they were chased with excess unlabeled NTP in the pulse–chase experiments to allow conversion to products (Fig. 4A). If the chemistry rate is slow relative to the conformational transition rate, the enzyme complexes after the conformational transition would accumulate. Upon the addition of unlabeled NTP, the accumulated complexes should proceed to products, leading to higher levels of product formation in the pulse–chase experiments compared with the pulse–quench experiments. In these experiments, the identity of the tRNA product (which contained the incorporated labeled nucleotide) was determined by gel analysis, while the amount of product synthesis at each time point was quantified by acid precipitation. The percent of a tRNA substrate converted to product was plotted over time and fit to a single exponential equation to determine the rate constant. Each nucleotide addition was tested three to five times with reproducible results.
FIGURE 4.

Pulse–quench and pulse–chase kinetics of CCA addition. (A) Experimental design. (B,C) Gel and kinetic analysis of C74 addition to tRNAA73, where C = chase; Q = quench. (D,E) Gel and kinetic analysis of C75 addition to tRNAC74. (F,G) Gel and kinetic analysis of A76 addition to tRNAC75. The size markers C74, C75, and A76 were prepared by transcription of 32P-labeled tRNAC74, tRNAC75, and tRNAA76, respectively. Each experiment contained 10 μM E. coli CCA enzyme and 1 μM tRNA with [α-32P]NTP (10 μM). The percent conversion of substrate to product tRNA was calculated from the total acid precipitable counts corrected for the fraction of the first product in the distribution of all products (see Materials and Methods). The corrected percent conversion is plotted as the y-axis over a time course as the x-axis.
Gel analysis of a representative C74 addition reaction showed that the extension to C74 was observed in the pulse–quench experiment, although most extension was to C75 (Fig. 4B), indicating that addition to C74 was immediately followed by addition to C75. In the pulse–chase experiment, extension to C75 and C76 was observed, indicating that addition of C74 was rapidly and completely converted to C75 and C76. This feature is termed poly(C) synthesis (for synthesis of CCC), which is noted for E. coli CCA enzyme in the absence of the ATP substrate (Hou 2000; Seth et al. 2002; Hou et al. 2005). In the case of poly(C) synthesis, quantification of C74 addition (Fig. 4C) was determined from the total acid precipitable counts corrected for the fraction of C74 in the relative distribution of C74, C75, and C76 products in gel analysis (Fig. 4B) (equation C74cpm in Materials and Methods). Kinetic analysis showed that while the amplitude of both pulse–quench and pulse–chase experiments reached a similar level (∼60%), the rate of pulse–chase experiment (23.9 ± 4.2 sec−1) was faster than that of pulse–quench experiment (9.6 ± 1.3 sec−1) by ∼2.5-fold (Fig. 4C), indicating that the chemistry step is slow. Similarly, gel analysis of the C75 addition reaction showed extension to C75, followed by extension to C76, in both pulse–quench and pulse–chase (Fig. 4D). This provided the basis to determine the fraction of C75 in the relative distribution of C75 and C76 products, which was used to correct the total acid precipitable counts to determine the amount of C75 addition (equation C75cpm in Materials and Methods). Notably, while both pulse–quench and pulse–chase experiments reached similar amplitudes of ∼50%–60% (Fig. 4E), the pulse–chase rate (20.2 ± 3.7 sec−1) was faster than the pulse–quench rate (11 ± 2 sec−1) by ∼1.7-fold. Thus, in both C74 and C75 addition reactions, the observation of a faster pulse–chase rate than the pulse–quench rate supports the notion that the chemistry step is slow relative to the prechemistry step. In the case of A76 addition, by contrast, pulse–chase and pulse–quench experiments revealed similar amplitudes of 50%, as well as similar rates (10.3 ± 2.2 sec−1 for the pulse–chase; 11.3 ± 2.4 sec−1 for the pulse–quench) (Fig. 4F,G). The overlapping kinetics indicates no accumulation of enzyme-bound complexes before the chemistry step, consistent with the notion that the chemistry step is fast relative to the prechemistry step. Thus, unlike the kinetics of C additions, the kinetics of A addition is limited by a slow conformational transition that occurs before the chemistry step.
In summary, the results based on three different kinetic probes, the thio effect, the glycerol effect, and the pulse–chase versus pulse–quench effect, support each other and provide the basis for a common framework, in which the kinetics of C additions is limited by the chemistry step, whereas the kinetics of A addition is limited by the prechemistry active site conformational transition step.
Analysis of steady-state kcat
The single turnover rate of 120 sec−1 determined for each nucleotide addition was faster than the previous estimate of the steady-state rate (Seth et al. 2002; Hou et al. 2005), suggesting that product release after each addition might be slow. This possibility has implications for enzyme processivity and was tested by presteady-state analysis, in which the tRNA substrate was saturating (relative to the Kd of the tRNA (Dupasquier et al. 2008)) and in molar excess of the enzyme, such that the enzyme can perform not just one but multiple rounds of turnover. This multiple-turnover condition allowed evaluation of product release after one round of reaction and before the next round. The kinetics was performed with 32P-labeled substrates of tRNAA73, tRNAC74, and tRNAC75 for addition of C74, C75, and A76, respectively. Product synthesis was analyzed by denaturing gels.
All three reactions exhibited burst kinetics at 37°C (Fig. 5A–C), showing a rapid nucleotide addition in the first turnover, followed by a slower and linear increase of the addition. The amplitude of the burst was consistent with the enzyme concentration used in the reaction, indicating that the enzyme was virtually 100% active. The appearance of burst kinetics indicates that product release after each addition is slow in multiple rounds of turnover. In this case, the rate of product release (kcat) determined the steady-state rate, and was measured from the linear phase of burst kinetics. Interestingly, in contrast to the uniform rate of product synthesis, the rate of product release progressively increased from kcat of C74 addition (3.3 ± 0.3 sec−1), to kcat of C75 addition (9.5 ± 0.8 sec−1), and to kcat of A76 addition (15.5 ± 1.5 sec−1). Notably, under the experimental conditions for C74 addition, the value of kcat (3.3 ± 0.3 sec−1) should be interpreted as a combination of product release of both C74 and C75, because gel analysis showed that addition of C74 was rapidly followed by addition of C75. This suggests that the enzyme stays on the tRNA after C74 addition and proceeds with C75 addition, such that the rate of release of the tRNAC74 product should be even slower than the measured rate of 3.3 ± 0.3 sec−1. Under the experimental conditions for C75 addition, gel analysis showed only the C75 product without C76, suggesting that the measured kcat of C75 addition (9.5 ± 0.8 sec−1) reports the release after addition of C75.
FIGURE 5.

Burst kinetics of nucleotide addition at 37°C for (A) addition of C74 to tRNAA73, (B) addition of C75 to tRNAC74,(C) addition of A76 to tRNAC75. The C74 addition experiment contained 1.5 μM E. coli CCA enzyme and 18 μM 32P-tRNA with 2 mM of CTP. The C75 addition experiment contained 1.0 μM E. coli CCA enzyme and 15 μM 32P-tRNA with 2 mM of CTP. The A76 addition experiment contained 1.0 μM E. coli CCA enzyme and 10 μM 32P-tRNA with 2 mM of ATP. For each experiment, the separation of the tRNA substrate from product was analyzed by denaturing gels. The amount of tRNA product synthesis was calculated from the percent conversion of substrate to product and was plotted as the y-axis versus a time course as the x-axis. In the case of poly(C) synthesis, all C additions were included as the products. The steady-state rate constant was calculated from the burst equation as described in Materials and Methods. The burst amplitude in each experiment indicated that virtually 100% of the enzyme was active.
DISCUSSION
Uniformed rates determined by distinct kinetic parameters
While the CCA sequence is transcribed in all natural E. coli tRNAs, it is subject to damage during the maturation process or subject to degradation by nonspecific nuclease activities or by 3′ end turnover (Deutscher 2006). Repair of the damaged CCA is the primary function of E. coli CCA enzyme, which must catalyze the appropriate nucleotide addition to the damaged site. In this capacity, it is important for the enzyme to have a uniform rate for each nucleotide addition, because a delay at any position would lead to accumulation of incomplete CCA sequences, which is deleterious to cell growth (Zhu and Deutscher 1987). Single turnover kinetic measurements performed here and in our recent study (Dupasquier et al. 2008) show that the rate of each nucleotide addition of this enzyme is indeed identical, with essentially the same affinity (∼40 μM) of the enzyme–tRNA complex for the NTP substrate at each step (Table 1). Similarly, we have shown that the enzyme–NTP complex has a similar affinity for the tRNA substrate for each nucleotide addition (Dupasquier et al. 2008). Such uniformity would ensure a steady pace of repair at any damage site, with approximately the same specificity factor (kN/Kd) of nucleotide addition to each site to regenerate the CCA sequence.
Intriguingly, we show here that the identical rate is controlled by distinct kinetic determinants for each nucleotide addition. This is summarized in a minimal scheme of nucleotide addition (Fig. 6), starting with the binding of the correct NTP to an enzyme–tRNA complex, to transition of the complex from an open to a close state, to the chemistry of nucleotide addition, and to the release of the extended tRNA product. The uniform rate of 120 sec−1 of nucleotide addition is assigned to the chemistry step for C74 and C75 addition, whereas it is assigned to the prechemistry enzyme conformational transition for A76 addition. Thus, there is a switch from the chemistry dominance to conformational–transition dominance from the C- to A-addition reactions, indicating a major shift in the kinetic strategies of the enzyme.
FIGURE 6.

Scheme of the stepwise nucleotide addition of E. coli CCA enzyme. In each addition, the enzyme (E) binds the tRNA substrate, t(A73) = tRNAA73; t(C74) = tRNAC74; t(C75) = tRNAC75, to form an enzyme–tRNA complex with the indicated Kd (Dupasquier et al. 2008). The enzyme–tRNA binds the correct NTP with the indicated Kd and the open complex (indicated by the subscript o) changes to a close complex (indicated by the subscript c). This close complex performs nucleotidyl transfer to generate the extended tRNA product and PPi. The dominant event in each nucleotide addition is highlighted. After nucleotide addition and release of PPi, the enzyme stays bound with the extended tRNA product. The rate of product release is slow but progressively increases as the enzyme completes the CCA synthesis.
The active site open-to-close transition
The switch to enzyme conformational-transition dominance for the A-addition reaction is biologically relevant, because it sets the stage to slow down the active site movement so as to have time to properly assemble for the addition reaction, which is the last in the CCA synthesis process. Notably, we have previously shown that E. coli CCA enzyme in certain conditions has the ability to catalyze addition of C76 and synthesize the erroneous CCC sequence (Hou 2000; Seth et al. 2002; Hou et al. 2005). Because there is no evidence of error-correction of the CCC sequence, it is thus important that the enzyme carefully assembles the active site in the last step of CCA synthesis to catalyze addition of A and to discriminate against addition of C.
A series of crystal structures of Archaeoglobus fulgidus CCA enzyme, which is a member of the class I family, most clearly demonstrate the open-to-close transition of the active site (Tomita et al. 2004, 2006; Xiong and Steitz 2004; Toh et al. 2008). In the C74 and C75 addition reactions, the active site exists in an open conformation in the absence of a bound CTP, where a β turn presses down the tRNA 3′ terminal base away from the catalytic residues (Tomita et al. 2006). CTP binding shifts the active site to a close conformation, where the β turn flips the tRNA 3′ terminal base to the vicinity of the bound CTP to facilitate nucleotide addition. The simultaneous changes of both the enzyme active site and tRNA 3′ terminal base thus provide a basis for the specificity of C74 and C75 addition. After C75 addition, both the active site and the tRNA 3′ terminal base remain in the same relative orientation, which is facile for the open-to-close transition for A76 addition with minimal conformational change. Thus, while the physical amplitude of the conformational transition is large for C74 and C75 addition but is small for A76 addition, this transition is observed for all three nucleotide additions and is a prerequisite for alignment of reactive groups before nucleotidyl transfer can take place.
Although the class I active site movements are clearly delineated in structural terms, these movements are not understood in kinetic terms, because no transient kinetic analysis has been performed on class I CCA enzymes. In the case of the class II E. coli CCA enzyme, however, although it has an active site that is structurally homologous to the class I active site, the kinetic data obtained in this study cannot be readily used to interpret the class I active site movements. Notably, comparative structural analysis has shown that the class II active site is structurally superimposable with the class I active site. For example, the class II active site of B. stereathermophilus CCA enzyme has an rmsd of 1.7 Å from the class I active site of the A. fulgidus enzyme, with three structurally analogous carboxylates that bind catalytically essential divalent metal ions (Li et al. 2002). In the tRNA-bound crystal structure of the class II Aquifex aeolicus CCA enzyme, which is positioned for A76 addition, the active site orients the tRNA terminal bases C74 and C75 relative to the bound ATP in a stereochemical arrangement similar to that in the class I active site (Tomita et al. 2004), where the base of C75 is well stacked with the base of ATP as in the case of the A. fulgidus enzyme. These structural similarities are noted as shared by all members of the nucleotidyl transferase family enzymes to ensure the same catalytic mechanism. However, the detailed kinetic behavior of each enzyme in the family is determined primarily by its unique structural and chemical recognition and binding of NTP and the nucleic acid substrate. Indeed, the two classes of CCA enzymes appear to use distinct mechanisms to recognize NTP and the nucleic acid substrate; while class I is proposed to bind NTP using the tRNA terminus to initiate an enzyme–tRNA collaborative templating mechanism (Xiong et al. 2003), class II is proposed to bind NTP using a protein template (Li et al. 2002). Notably, the class II A. aeolicus CCA enzyme is split into two protein moieties: one specific for A76 addition, while the other specific for C74 and C75 addition (Tomita and Weiner 2001). At the moment, there is no structural information for the active site that catalyzes C74 and C75 addition. Thus, additional class II structures must be obtained to interpret the kinetics of the E. coli CCA enzyme in structural terms.
Product release
After each nucleotide addition and release of PPi, the CCA enzyme has the option of releasing the extended tRNA product or staying bound for the next nucleotide addition. We show here that each addition exhibits burst kinetics in presteady state, and that the kcat of releasing the tRNA product as measured by the burst kinetics is significantly slower than the rate of nucleotide addition. In particular, the kcat of releasing the tRNAC74 product cannot be accurately determined, because the measured rate of 3.3 ± 0.3 sec−1 is, in fact, an integrated rate of the release of both tRNAC74 and tRNAC75, due to the slow release of tRNAC74 and rapid addition of C75 to synthesize tRNAC75. Even with this consideration, the measured rate of 3.3 ± 0.3 sec−1 for release of tRNAC74 is ∼40-fold slower than the rate of product synthesis (120 sec−1), indicating a clear enzyme preference to stay bound with the tRNA product. This illustrates the processivity of the enzyme as it proceeds from C74 to C75 addition. The kcat of releasing the tRNAA76 product is the highest (15.5 ± 1.5 sec−1), indicating that the completion of the CCA synthesis has prompted the enzyme for a more facile product release. However, the highest kcat value for release of tRNAA76 is still significantly slower than the rate of synthesis, suggesting that the enzyme remains tightly bound with the 3′ end-matured tRNAA76 product.
The RNA chaperon protein Hfq, which was originally discovered as the host factor for replication of phage Qβ (Franze de Fernandez et al. 1972), has been shown recently to promote kcat of E. coli CCA enzyme (Scheibe et al. 2007). Hfq is an RNA chaperone because it helps many small noncoding RNAs to identify their mRNA targets, thus regulating the stability and expression activity of the identified mRNA targets (Gottesman 2004; Storz et al. 2004). Hfq has a donut-shaped structure, which binds noncoding RNAs and tRNA using the same face with similar binding affinities (Lee and Feig 2008), suggesting that tRNA is likely a natural substrate for Hfq. In a steady-state analysis of CCA addition to a CCA-lacking tRNA substrate, Hfq in molar excess (37.5 pmol) stimulates the activity of E. coli CCA enzyme (0.1 pmol) in kcat by threefold without affecting the enzyme Km for the tRNA substrate (Scheibe et al. 2007). This stimulation is biologically relevant, because cellular concentrations of Hfq are estimated at least 20-fold higher than those of the CCA enzyme (Vecerek et al. 2005), suggesting that Hfq may indeed help E. coli CCA enzyme to release tRNA products in vivo. However, the threefold increase in kcat as stimulated by Hfq should be considered as an integrated value of the three addition reactions, because the experiment with the CCA-lacking tRNA substrate cannot resolve the effect among the C74, C75, and A76 addition steps. Future experiments to examine the role of Hfq in each addition reaction by single turnover and by burst kinetics of E. coli CCA enzyme will be necessary to gain further insights.
This study emphasizes the capacity of E. coli CCA enzyme to use multiple strategies to orchestrate the process of CCA synthesis by recruiting diverse kinetic determinants in each step of nucleotide addition. The outcome is a processive stepwise nucleotide addition that proceeds at the same rate for each step and releases the product after the last nucleotide addition. Such an elaborate kinetic control is likely important for the specificity of CCA synthesis in the absence of a nucleic acid template.
MATERIALS AND METHODS
Sample preparation and kinetics
Purification of a recombinant C-terminal His-tagged E. coli CCA enzyme and T7 transcripts of tRNA substrates was as described (Dupasquier et al. 2008). Single turnover kinetics of nucleotide addition performed on the RQF-3 KinTek instrument were as described (Dupasquier et al. 2008). Briefly, E. coli CCA enzyme (8 μM) and a specific 32P-labeled tRNA substrate (1 μM) were premixed in a syringe in 100 mM glycine (pH 9.0), 10 mM MgCl2, and 1 mM DTT, followed by rapid mixing with indicated concentrations of the cognate NTP or NTPαS substrate in a second syringe. After different reaction times (2–70 msec) at 37°C, an aliquot of 20 μL (10 μL of each syringe) was quenched with 80 μL of 7 M urea. The reaction samples were mixed with a urea loading dye and separated by a 12% PAGE/7 M urea gel, which was exposed to a phosphor screen, scanned with Storm 820, and analyzed with ImageQuant 5.2 software. The fraction of product formation was calculated based on the percent of product that was synthesized from the substrate. This fraction of product synthesis was plotted on the y-axis as a function of time, which was fit to a single exponential equation:  , where A is the amplitude, t is the time, and kapp is the observed rate constant of the A76, C75, or C74 incorporation, respectively. The data of kapp versus NTP concentration were fit to a hyperbolic equation. For example, the hyperbolic equation kapp = (kA76 × [ATP])/(Kd + [ATP]) was used for analysis of A76 addition, where kA76 is the maximum single turnover rate and Kd is the dissociation constant of ATP from the enzyme–tRNAC75 complex.
In burst kinetics, E. coli CCA enzyme and a specific 32P-labeled tRNA substrate were premixed in a syringe in 100 mM glycine (pH 9.0), 10 mM MgCl2, and 1 mM DTT, followed by rapid mixing with a saturating concentration of the appropriate NTP substrate (2 mM) in a second syringe. Reaction aliquots at 37°C over a time course were collected and analyzed by gels as above, and the percent of product synthesis of the time course was fit to a burst kinetics equation, 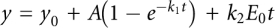 , where k1 is the apparent rate constant of the exponential phase, and k2 is the rate constant of the steady-state phase.
In pulse–quench experiments, a preincubated enzyme (10 μM) with unlabeled tRNA (1 μM) was rapidly mixed with [α-32P]NTP (10 μM), and after a time period, the reaction was quenched with 0.5 M EDTA. Pulse–chase experiments were performed similarly, except that the reaction was chased with unlabeled NTP (1.2 mM) for 10 sec, followed by quenching with 0.5 M EDTA. Reaction aliquots of the same time periods were adjusted to the same volume before separation on denaturing gel. The incorporation of [α-32P]NTP to tRNA was determined from acid precipitation and reported as the average of three to five experiments. For the C74 addition reaction, in the event of polyC synthesis, the fraction of C74 addition (fC74), relative to C75 addition (fC75) and C76 addition (fC76), in each aliquot was determined from image analysis of denaturing gels, while total acid precipitable counts (Total cpm) that included all C additions was determined by acid precipitation and the amount specific to addition of C74 (C74cpm) was calculated according to the equation for C74cpm. For the C75 addition reaction, in the event of polyC synthesis, the fraction of C75 addition (fC75), relative to C76 addition (fC76), in each aliquot was determined from image analysis of denaturing gels, while total acid precipitable counts that included both C additions was determined by acid precipitation and the amount specific to addition of C75 (C75cpm) was calculated according to the equation for C75cpm.
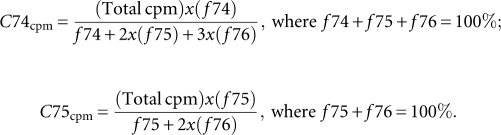 |
The values of C74cpm and C75cpm were then converted to pmoles based on the specific activity of [α-32P]CTP.
ACKNOWLEDGMENTS
We thank Dr. Smita Patel for discussions. This study was supported by NIH Grant GM068561 (to Y.-M.H.).
Footnotes
Article published online ahead of print. Article and publication date are at http://www.rnajournal.org/cgi/doi/10.1261/rna.1669109.
REFERENCES
- Aebi M, Kirchner G, Chen JY, Vijayraghavan U, Jacobson A, Martin NC, Abelson J. Isolation of a temperature-sensitive mutant with an altered tRNA nucleotidyltransferase and cloning of the gene encoding tRNA nucleotidyltransferase in the yeast Saccharomyces cerevisiae. J Biol Chem. 1990;265:16216–16220. [PubMed] [Google Scholar]
- Anand VS, Patel SS. Transient state kinetics of transcription elongation by T7 RNA polymerase. J Biol Chem. 2006;281:35677–35685. doi: 10.1074/jbc.M608180200. [DOI] [PubMed] [Google Scholar]
- Bakhtina M, Lee S, Wang Y, Dunlap C, Lamarche B, Tsai MD. Use of viscogens, dNTPαS, and rhodium(III) as probes in stopped-flow experiments to obtain new evidence for the mechanism of catalysis by DNA polymerase beta. Biochemistry. 2005;44:5177–5187. doi: 10.1021/bi047664w. [DOI] [PubMed] [Google Scholar]
- Bakhtina M, Roettger MP, Kumar S, Tsai MD. A unified kinetic mechanism applicable to multiple DNA polymerases. Biochemistry. 2007;46:5463–5472. doi: 10.1021/bi700084w. [DOI] [PubMed] [Google Scholar]
- Deutscher MP. Degradation of RNA in bacteria: Comparison of mRNA and stable RNA. Nucleic Acids Res. 2006;34:659–666. doi: 10.1093/nar/gkj472. [DOI] [PMC free article] [PubMed] [Google Scholar]
- Dupasquier M, Kim S, Halkidis K, Gamper H, Hou YM. tRNA integrity is a prerequisite for rapid CCA addition: Implication for quality control. J Mol Biol. 2008;379:579–588. doi: 10.1016/j.jmb.2008.04.005. [DOI] [PMC free article] [PubMed] [Google Scholar]
- Franze de Fernandez MT, Hayward WS, August JT. Bacterial proteins required for replication of phage Q ribonucleic acid. Pruification and properties of host factor I, a ribonucleic acid-binding protein. J Biol Chem. 1972;247:824–831. [PubMed] [Google Scholar]
- Gottesman S. The small RNA regulators of Escherichia coli: Roles and mechanisms. Annu Rev Microbiol. 2004;58:303–328. doi: 10.1146/annurev.micro.58.030603.123841. [DOI] [PubMed] [Google Scholar]
- Hou YM. Unusual synthesis by the Escherichia coli CCA-adding enzyme. RNA. 2000;6:1031–1043. doi: 10.1017/s1355838200000686. [DOI] [PMC free article] [PubMed] [Google Scholar]
- Hou YM, Gu SQ, Zhou H, Ingerman L. Metal-ion-dependent catalysis and specificity of CCA-adding enzymes: A comparison of two classes. Biochemistry. 2005;44:12849–12859. doi: 10.1021/bi0509402. [DOI] [PubMed] [Google Scholar]
- Johnson KA. Conformational coupling in DNA polymerase fidelity. Annu Rev Biochem. 1993;62:685–713. doi: 10.1146/annurev.bi.62.070193.003345. [DOI] [PubMed] [Google Scholar]
- Joyce CM, Benkovic SJ. DNA polymerase fidelity: Kinetics, structure, and checkpoints. Biochemistry. 2004;43:14317–14324. doi: 10.1021/bi048422z. [DOI] [PubMed] [Google Scholar]
- Korostelev A, Trakhanov S, Laurberg M, Noller HF. Crystal structure of a 70S ribosome–tRNA complex reveals functional interactions and rearrangements. Cell. 2006;126:1065–1077. doi: 10.1016/j.cell.2006.08.032. [DOI] [PubMed] [Google Scholar]
- Lee T, Feig AL. The RNA binding protein Hfq interacts specifically with tRNAs. RNA. 2008;14:514–523. doi: 10.1261/rna.531408. [DOI] [PMC free article] [PubMed] [Google Scholar]
- Li F, Xiong Y, Wang J, Cho HD, Tomita K, Weiner AM, Steitz TA. Crystal structures of the Bacillus stearothermophilus CCA-adding enzyme and its complexes with ATP or CTP. Cell. 2002;111:815–824. doi: 10.1016/s0092-8674(02)01115-7. [DOI] [PubMed] [Google Scholar]
- Mizrahi V, Henrie RN, Marlier JF, Johnson KA, Benkovic SJ. Rate-limiting steps in the DNA polymerase I reaction pathway. Biochemistry. 1985;24:4010–4018. doi: 10.1021/bi00336a031. [DOI] [PubMed] [Google Scholar]
- Scheibe M, Bonin S, Hajnsdorf E, Betat H, Morl M. Hfq stimulates the activity of the CCA-adding enzyme. BMC Mol Biol. 2007;8:92. doi: 10.1186/1471-2199-8-92. [DOI] [PMC free article] [PubMed] [Google Scholar]
- Seth M, Thurlow DL, Hou YM. Poly(C) synthesis by class I and class II CCA-adding enzymes. Biochemistry. 2002;41:4521–4532. doi: 10.1021/bi0120953. [DOI] [PubMed] [Google Scholar]
- Showalter AK, Tsai MD. A reexamination of the nucleotide incorporation fidelity of DNA polymerases. Biochemistry. 2002;41:10571–10576. doi: 10.1021/bi026021i. [DOI] [PubMed] [Google Scholar]
- Steitz TA. A mechanism for all polymerases. Nature. 1998;391:231–232. doi: 10.1038/34542. [DOI] [PubMed] [Google Scholar]
- Steitz TA, Steitz JA. A general two-metal-ion mechanism for catalytic RNA. Proc Natl Acad Sci. 1993;90:6498–6502. doi: 10.1073/pnas.90.14.6498. [DOI] [PMC free article] [PubMed] [Google Scholar]
- Storz G, Opdyke JA, Zhang A. Controlling mRNA stability and translation with small, noncoding RNAs. Curr Opin Microbiol. 2004;7:140–144. doi: 10.1016/j.mib.2004.02.015. [DOI] [PubMed] [Google Scholar]
- Toh Y, Numata T, Watanabe K, Takeshita D, Nureki O, Tomita K. Molecular basis for maintenance of fidelity during the CCA-adding reaction by a CCA-adding enzyme. EMBO J. 2008;27:1944–1952. doi: 10.1038/emboj.2008.124. [DOI] [PMC free article] [PubMed] [Google Scholar]
- Tomita K, Weiner AM. Collaboration between CC- and A-adding enzymes to build and repair the 3′-terminal CCA of tRNA in Aquifex aeolicus. Science. 2001;294:1334–1336. doi: 10.1126/science.1063816. [DOI] [PubMed] [Google Scholar]
- Tomita K, Fukai S, Ishitani R, Ueda T, Takeuchi N, Vassylyev DG, Nureki O. Structural basis for template-independent RNA polymerization. Nature. 2004;430:700–704. doi: 10.1038/nature02712. [DOI] [PubMed] [Google Scholar]
- Tomita K, Ishitani R, Fukai S, Nureki O. Complete crystallographic analysis of the dynamics of CCA sequence addition. Nature. 2006;443:956–960. doi: 10.1038/nature05204. [DOI] [PubMed] [Google Scholar]
- Tsai YC, Johnson KA. A new paradigm for DNA polymerase specificity. Biochemistry. 2006;45:9675–9687. doi: 10.1021/bi060993z. [DOI] [PMC free article] [PubMed] [Google Scholar]
- Vecerek B, Moll I, Blasi U. Translational autocontrol of the Escherichia coli hfq RNA chaperone gene. RNA. 2005;11:976–984. doi: 10.1261/rna.2360205. [DOI] [PMC free article] [PubMed] [Google Scholar]
- Xiong Y, Steitz TA. Mechanism of transfer RNA maturation by CCA-adding enzyme without using an oligonucleotide template. Nature. 2004;430:640–645. doi: 10.1038/nature02711. [DOI] [PubMed] [Google Scholar]
- Xiong Y, Li F, Wang J, Weiner AM, Steitz TA. Crystal structures of an archaeal class I CCA-adding enzyme and its nucleotide complexes. Mol Cell. 2003;12:1165–1172. doi: 10.1016/s1097-2765(03)00440-4. [DOI] [PubMed] [Google Scholar]
- Yue D, Maizels N, Weiner AM. CCA-adding enzymes and poly(A) polymerases are all members of the same nucleotidyltransferase superfamily: Characterization of the CCA-adding enzyme from the archaeal hyperthermophile Sulfolobus shibatae. RNA. 1996;2:895–908. [PMC free article] [PubMed] [Google Scholar]
- Zhu L, Deutscher MP. tRNA nucleotidyltransferase is not essential for Escherichia coli viability. EMBO J. 1987;6:2473–2477. doi: 10.1002/j.1460-2075.1987.tb02528.x. [DOI] [PMC free article] [PubMed] [Google Scholar]