

Abstract
Tyrosine hydroxylase (TH) is the rate-limiting enzyme in catecholamine biosynthesis. Does common genetic variation at human TH alter autonomic activity and predispose to cardiovascular disease? We undertook systematic polymorphism discovery at the TH locus, and then tested variants for contributions to sympathetic function and blood pressure. We resequenced 80 ethnically diverse individuals across the TH locus. One hundred seventy-two twin pairs were evaluated for sympathetic traits, including catecholamine production and environmental (cold) stress responses. To evaluate hypertension, we genotyped subjects selected from the most extreme diastolic blood pressure percentiles in the population. Human TH promoter haplotype/reporter plasmids were transfected into chromaffin cells. Forty-nine single nucleotide polymorphisms (SNPs) and one tetranucleotide repeat were discovered, but coding region polymorphism did not account for common phenotypic variation. A block of linkage disequilibrium spanned four common variants in the proximal promoter. Catecholamine secretory traits were significantly heritable, as were stress-induced blood pressure changes. In the TH promoter, significant associations were found for urinary catecholamine excretion, as well as blood pressure response to stress. TH promoter haplotype #2 (TGGG) showed pleiotropy, increasing both norepinephrine excretion and blood pressure during stress. In hypertension, a case–control study (1266 subjects, 53% women) established the effect of C-824T in determination of blood pressure. We conclude that human catecholamine secretory traits are heritable, displaying joint genetic determination (pleiotropy) with autonomic activity and finally with blood pressure in the population. Catecholamine secretion is influenced by genetic variation in the adrenergic pathway encoding catecholamine synthesis, especially at the classically rate-limiting step, TH. The results suggest novel pathophysiological links between a key adrenergic locus, catecholamine metabolism, and blood pressure, and suggest new strategies to approach the mechanism, diagnosis, and treatment of systemic hypertension.
Keywords: blood pressure, cold pressor test, heart rate, (TCAT)n polymorphism in the first TH intron, tyrosine hydroxylase
Introduction
Tyrosine hydroxylase (TH) is the rate-limiting enzyme in catecholamine biosynthesis.1,2 Substantial loss of TH enzymatic activity as a consequence of rare inactivating mutations has profound consequences in humans,1 as well as in mice with targeted ablation of the TH locus.3
The human TH locus also displays more common natural allelic variation, such as the tetranucleotide repeat (or microsatellite polymorphism) (TCAT)n in its first intron.4 This microsatellite may be associated with essential hypertension.4 The spectrum of allelic variation at human TH is currently unknown; therefore, we undertook systematic polymorphism discovery at the locus. To probe the impact of TH variation on stress-induced disease pathways, we resequenced ~1.2 kbp of 5′ promoter, as well as all 13 exons and adjacent intronic regions in 80 ethnically diverse subjects as well as in 422 twins. Twin pairs enabled us to study whether TH allelic variation contributed to heritable control of the circulation.
Methods
Subjects
Polymorphism Discovery
A series of 80 unrelated, ethnically diverse individuals was resequenced across the TH locus. Their biogeographic ancestries were: 23 European (white), 25 sub-Saharan African (black), 16 East Asian, and 16 Mexican-American (Hispanic). A series of n = 213 twin pairs (of several ancestries) was later resequenced at the TH promoter.
Human Twin Pairs
N = 172 Caucasian twin pairs (119 monozygotic, 53 dizygotic; age 15–84 years) were evaluated for sympathetic traits, including catecholamine production, reflex control of the circulation, and environmental (cold) stress responses.
Hypertension and Population Blood Pressure Extremes
Subjects with hypertension were selected from >50,000 individuals (one-half female and one-half male). In the initial sample, 1266 subjects with the highest (4.9th percentile) and lowest (4.8th percentile) diastolic blood pressures (DBPs) in the population were evaluated; 53% were female.
Experimental Genomics
Genomic DNA was prepared from leukocytes in EDTA-anticoagulated blood, using PureGene extraction columns (Gentra Biosystems, Minneapolis, MN) as described.5 Public draft human and mouse genome sequences were obtained from the University of California, Santa Cruz (UCSC) Genome Bioinformatics website and used as scaffolds for primer design and sequence alignment. The base position numbers were from National Center for Biotechnology Information TH (isoform b) source clones NM_000360, NT_009237.17, and NP_000351. Promoter positions were numbered with respect to (−) the TH open reading frame start codon (ATG). PCR primers were designed by Primer36 to span −1155 bp of the proximal promoter, and each of the 13 exons with 50–100 bp of flanking intron. PCR products were treated with exonuclease I and shrimp alkaline phosphatase to remove primers, and then deoxyribonucleotide triphophate (dNTPs) prior to cycle sequencing with BigDye terminators (Applied Biosystems, Foster City, CA). Sequence was determined on an ABI 3100 automated sequencer, and analyzed using the Phred/Phrap/Consed suite of software to provide base quality scores, detecting polymorphism and heterozygosity, using PolyPhred7 and manually confirmed. A subset of the data was cross-validated manually using base calls from Applied Biosystems software and visual inspection of trace files to identify heterozygotes. Rare single nucleotide polymorphisms (SNPs) were confirmed by re-sequencing in multiple individuals, and from the reverse direction. In addition to initial SNP discovery in a panel of 80 genomic DNA samples, the proximal promoter region of TH was resequenced for SNPs scoring in all 172 twin pairs.
Single Nucleotide Polymorphism in Exon 2
The Val81Met polymorphism in TH exon 2 (rs6356, A/G) was scored in a two-stage assay.8 In 440 individuals ascertained from twin families, genotypic ratios were: A/A, 72; A/G, 197; G/G, 171. Allele frequencies were: Met = A = 39%, Val = G = 61%; Hardy–Weinberg equilibrium χhi2 = 1.41, P = 0.234.
Biochemical Traits in Twins: Catecholamines
Plasma and urine catecholamines were measured radioenzymatically.9 Urine catecholamine values were normalized to creatinine excretion in the same sample.
Autonomic Phenotyping in Twins
Prolonged Recording of Vital Signs
Blood pressure (in mmHg) and pulse interval (R-R interval or heart period, in msec/beat) were recorded continuously and noninvasively for 5 min in seated subjects with a radial artery applanation device and dedicated sensor hardware (Colin Pilot; Colin Medical Instruments Corp., San Antonio, TX).5 Heart rate was recorded continuously with thoracic electrocardiography electrodes to the Colin Pilot. Average, maximum, and minimum values, as well as coefficients of variation were calculated for blood pressure and pulse interval, using the ANS-TDA software (Colin Medical Instruments Corp.).
Environmental Stress Response
Blood pressure and heart rate were recorded continuously and noninvasively with a Colin Pilot during the cold pressor test (CPT; immersion of the left hand in ice water for 60 s, after a 10 min rest).5,10,11 We identified at least 3 beats with stable (within ± 10%) values for blood pressure and heart rate just before and at the end of the CPT.
TH Promoter Strength: Transfection Studies
Human TH promoter/reporter plasmids were constructed, sequence-verified, and studied. Promoter positions were numbered upstream (−) or downstream (+) of the start codon (A in ATG as +1 bp). A haplotype-specific promoter fragment (from a wild-type haplotype homozygote), corresponding to TH −957 bp/−1 bp, was PCR-amplified from genomic DNA of known homozygotes. The promoter amplicon was subcloned into the promoterless firefly luciferase reporter plasmid pGL3-Basic (Promega, Madison, WI). Only the wild-type TH haplotype was amplified from genomic DNA. The other haplotypes were generated by point mutation of the wild-type promoter haplotype-firefly luciferase reporter plasmid (QuikChange mutagenesis; Strata-gene, La Jolla, CA) and resequenced to verify the identity of each allele and haplotype. PC12 pheochromocytoma cells were transfected (at 50–60% confluence, 1 day after 1:4 splitting) with 1 μg of supercoiled promoter haplotype-firefly luciferase reporter plasmid and 10 ng of the Renilla luciferase expression plasmid pRL-TK (Promega) as an internal control per well, by the liposome method (Superfect; Qiagen, Valencia, CA). The firefly and Renilla luciferase activities in the cell lysates were measured 48 h after transfection, and the results were expressed as the ratio of firefly/Renilla luciferase activity (“Stop & Glo®”; Promega). Each experiment was repeated six times.
Statistical Genetics
Descriptive Statistics
Descriptive statistics (mean, standard error) were computed across all of the twins, using generalized estimating equations (GEEs; PROC GENMOD) in SAS (Statistical Analysis System, Cary, NC).12
Heritability in Twins
Heritability (h2) is the fraction of phenotypic variance accounted for by genetic variance (h2 = VG/VP). Estimates of h2 were obtained by the variance component method implemented in the Sequential Oligogenic Linkage Analysis Routines (SOLAR) package (Southwest Foundation for Biomedical Research, San Antonio, TX).13
Haplotypes and Linkage Disequilibrium (LD)
Haplotypes were inferred from unphased diploid genotypes with the software package PHASE,14 assigning the two most likely haplotypes to each diploid individual. We inferred the TH promoter haplotypes using 10 SNPs discovered by resequencing 293 unrelated individuals (586 chromosomes) chosen to span four diverse ethnic groups: white (European ancestry), black (sub-Saharan African ancestry), Hispanic (Mexican American), and East Asian.
Association (Marker-on-Trait)
Association studies were performed for the common TH promoter alleles (minor allele frequency >5%). Each study subject was categorized according to diploid genotype at a biallelic SNP locus, or carrier status (two, one, or zero copies) of a particular TH SNP, haplotype, or diploid haplotype (diplotype). Unpaired t-tests evaluated the significance of the in vitro haplotype-specific TH promoter activity.
Pleiotropy: Bivariate Genetic Analyses
Pleiotropy (genetic covariance for two correlated, heritable traits)15 was estimated as the parameter RhoG (ρG) in SOLAR. 16
Multiple Comparison Adjustments
To adjust for the possibility of multiple comparisons when testing the effect of four TH promoter SNPs on autonomic traits, we used the method of Single Nucleotide Polymorphism Spectral Decomposition (SNPSpD) proposed by Nyholt17 and implemented at http://genepi.qimr.edu.au/general/daleN/SNPSpD/, to yield an “effective” number of markers within a block of LD.
Permutation Testing
To enable model-free analyses, without reliance on standard asymptotic assumptions, we employed more computationally intensive permutation tests, using the recursive algorithm of Mehta and Patel,18 as implemented by Clarkson et al.19 Trait values were dichotomized (or converted into two quantiles), to allow construction of 3-by-2 contingency tables (diploid genotype-by-trait).
Results
TH Genomics: Systematic Discovery of Polymorphism across the Locus
Forty-nine SNPs and one tetranucleotide repeat were identified (Fig. 1A). Ten SNPs were located in the ~1 kbp proximal promoter, 14 in coding regions, and 25 in untranslated regions (UTRs) or exon-adjacent intronic regions. Of the 49 SNPs, 13 were common (minor allele frequency >5%), including four SNPs in the proximal promoter, two in coding regions, four in UTRs, and four in introns. Among 14 coding region polymorphisms, 11 specify amino acid substitutions. Val81Met is the most common single nucleotide polymorphisms within complementary DNA sequences (cSNP), with a minor allele frequency at 37.4%; synonymous Lys240Lys is the second most common, at 23.6%. Unusual/rare coding cSNPs (all <1.2%, most at 0.3%) were the balance: Ala6Thr, Arg15His, Ala17Val, Ala23Thr, Arg89Arg, Ala143Thr, Thr225Asn, Arg410Trp, Asp467Asp, Val468Met, Ala492Val, and Gly497Asp.
Figure 1.
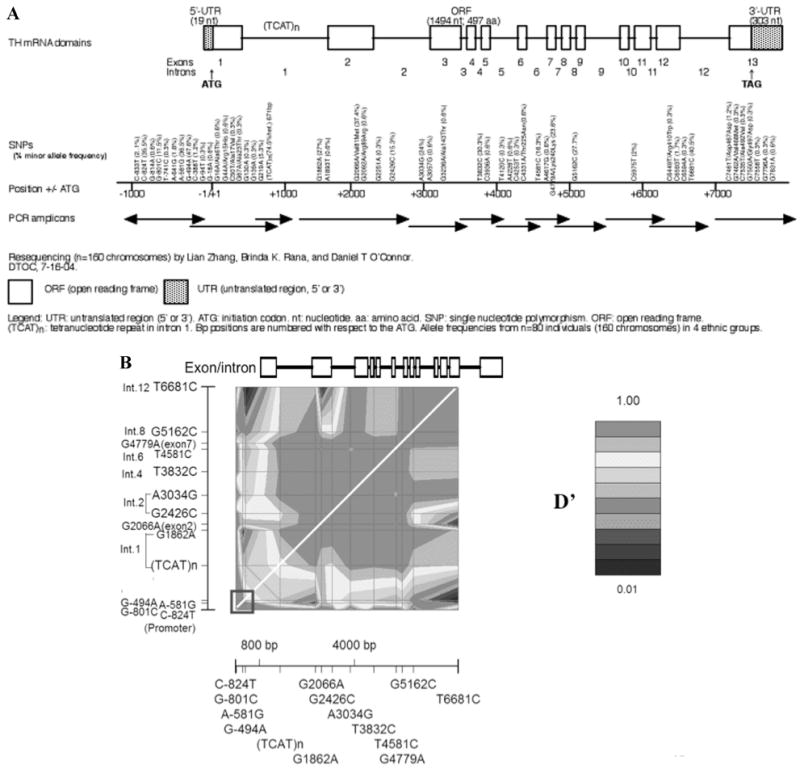
Polymorphism discovery at TH: the local genomic region. SNP discovery in an ethnically diverse sample: n = 80 individuals (2n = 160 chromosomes) was studied. Reproduced from Circulation (2007; 116(9): 993–1006.) (A) Resequencing strategy. Forty-nine single nucleotide polymorphisms (SNPs) and one tetranucleotide microsatellite were identified. Ten SNPs located in 1 kbp proximal promoter, 14 SNPs located in coding regions, 25 SNPs located in the untranslated regions (UTRs) or in adjacent intronic regions. Of these, 13 SNPs were common (minor allele frequency ≥5%), including four in the TH proximal promoter, two in coding regions, four in the UTRs, and four in intronic regions. Arrows indicate amplicons and the direction of resequencing. (B) Patterns of linkage disequilibrium (LD) across the entire TH locus. GOLD (Graphical Overview of Linkage Disequilibrium) plot of point-by-point LD among 14 polymorphisms with high minor allele frequencies (13.6–42.6%; including the [TCAT]n in the first intron) spanning 7505 bp at the TH locus, and proceeding ~1 kbp upstream (5′; promoter region). The white diagonal is the line of identity (Y = X). The Exon/Intron structure of the TH locus is shown at top-panel (note the lack of common polymorphisms in the final exon). The blue box at the lower left-hand corner designates the LD block at the proximal promoter. D′, LD parameter (scaled from 0 → +1). Results are from 2n = 442 chromosomes in subjects of European ancestry. (In color in Annals online.)
The tetranucleotide repeat in the first intron had six different alleles, generated by 6–10 repetitions of the core tetranucleotide motif TCAT: (TCAT)6, (TCAT)7, (TCAT)8, (TCAT)9, and 10-repeat alleles exhibiting two sequence variants: the perfect repeat (TCAT)10, and a (TCAT)4CAT(TCAT)5 imperfect repeat, also known as (TCAT)10.
Linkage Disequilibrium (Marker-on-Marker)
Pairwise LD between each common SNP across TH was quantified as D′, scaled from 0 → 1. Visual inspection (Fig. 1B) of plots of the LD structure across TH reveals two blocks of particularly high LD (D′ > 0.9): at the 5′ (promoter) and mid-to-3′ (intron A → exon 12) regions of the gene.
Single Nucleotide Variants in the TH Promoter
Ten biallelic variants were discovered (major allele/position upstream of the ATG/minor allele): C-833T, C-824T, G-814A, G-801C, T-741C, A-641G, A-581G, G-494A, C-388T, and G-94T. Alleles at each SNP were in Hardy–Weinberg equilibrium (determined within the largest ethnic group, Caucasian). Four of 10 SNPs (C-824T, G-801C, A-581G, and G-494A) had relatively common minor alleles (>10% frequency); these four occurred within a span of only 331 bp in the proximal promoter.
Twin traits: Heritability
Both plasma catecholamine and urinary catecholamines were significantly heritable. Heritability (h2) for plasma norepinephrine (h2 = 69.9 ± 4.4%, P < 0.0001) and urinary epinephrine excretion (h2 = 66.7 ± 5.9%, P < 0.0001).
Basal blood pressure and heart rate displayed significant heritability, with heart rate substantially more heritable (at h2 = 61 ± 6%, P < 0.0001) than either systolic blood pressure (SBP) (h2 = 26 ± 8%, P = 0.0016) or DBP (h2 = 18 ± 9%, P = 0.0359). Stress-induced changes in vital signs were also heritable, whether expressed as maximal values, absolute changes (maximal minus basal), or percentage changes.
TH Promoter Single Nucleotide Variants: Marker-on-Trait Associations
Univariate Analyses
Significant associations were found for urinary catecholamine excretion (epinephrine and norepinephrine; Fig. 2A), as well as the blood pressure response to environmental (cold) stress (change in SBP and change in DBP; Fig. 2B), with variants at C-824T and A-581G. Variants at G-801C and G-494A did not associate (Fig. 2). The common TH coding region/ exon 2 nonsynonymous variant Val81Met did not associate with catecholamines or stress blood pressure changes, nor did the less common (minor allele frequency <5%) coding region variants.
Figure 2.
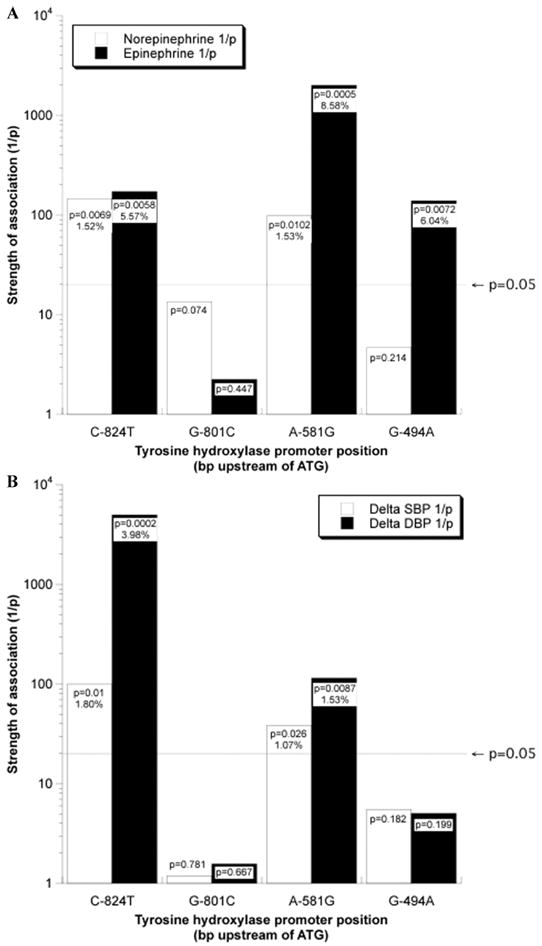
TH promoter polymorphisms: Region-specific prediction of autonomic traits in twins. Reproduced from Circulation (2007; 116(9): 993–1006.) (A) Catecholamines: Univariate analyses across the promoter. Significance of association with catecholamine secretion graded by 1/P-value. The P-value is derived from SOLAR of comparison of individual TH promoter SNP in twins. The X-axis indicates the position (in bp upstream of ATG) of the common TH promoter SNPs. Significance (horizontal black line): at P < 0.05. (B) Stress blood pressure: Univariate analyses across the promoter. Significance of association with change of blood pressure response to cold stress graded by 1/P-value. The P-value is derived from SOLAR of comparison of individual TH promoter SNP in twins. The X-axis indicates the position (in bp upstream of ATG) of the common TH promoter SNPs. Significance (horizontal black line): at P < 0.05.
Multivariable Analyses
Since both C-824T and A-581G seemed to influence both catecholamine secretion (Fig. 2A) and the blood pressure response to stress (Fig. 2B), we performed a multivariable analysis of all four common TH promoter polymorphisms (C-824T, G-801C, A-581G, and G-494A) in SOLAR in an attempt to discern the most important variant(s). In this analysis, C-824T became the most significant predictor of change in DBP during cold stress (P = 0.000164), though G-494A also achieved significance (P = 0.0276).
Multiple Comparisons
Since we tested the phenotypic effects of four different promoter SNPs, we re-evaluated the alpha threshold to avoid false positive conclusions. The SNPSpD method of Nyholt17 tested intermarker correlations within the promoter block of LD to yield an “effective” number of markers at 2.92, indicating that an appropriate alpha threshold to maintain the Type I error rate at ≤5% for a single phenotype would be P = 0.0171.
Permutation Tests within the Promoter
Another approach to multiple genotype/phenotype comparisons is the use of model-free exact (permutation) tests. We dichotomized continuous traits about the median value and then constructed 3 × 2 contingency tables (three diploid genotypes by two trait quantiles). After permutation, the effect of C-824T remained significant upon both urinary norepinephrine excretion (P = 0.00633) and the DBP response to cold stress (P = 0.0157).
Pleiotropy: Coordinate Effects of Promoter Variant C-824T on Biochemical and Physiological Autonomic Traits
C-824T: Biochemistry and Physiology
C-824T associated with urine catecholamine excretions: epinephrine (P = 0.0058, percent variation explained = 5.55%); and norepinephrine (P = 0.0069, percent variation explained = 1.52%). The T-824C minor (T) allele associated with higher urinary catecholamine excretion (Fig. 3A) and greater changes of blood pressure response to cold stress (Fig. 3B; ΔSBP: P = 0.01,% percent variation = 1.54% and ΔDBP: P = 0.0069, percent variation = 3.98%) (Fig. 3A and 3B).
Figure 3.
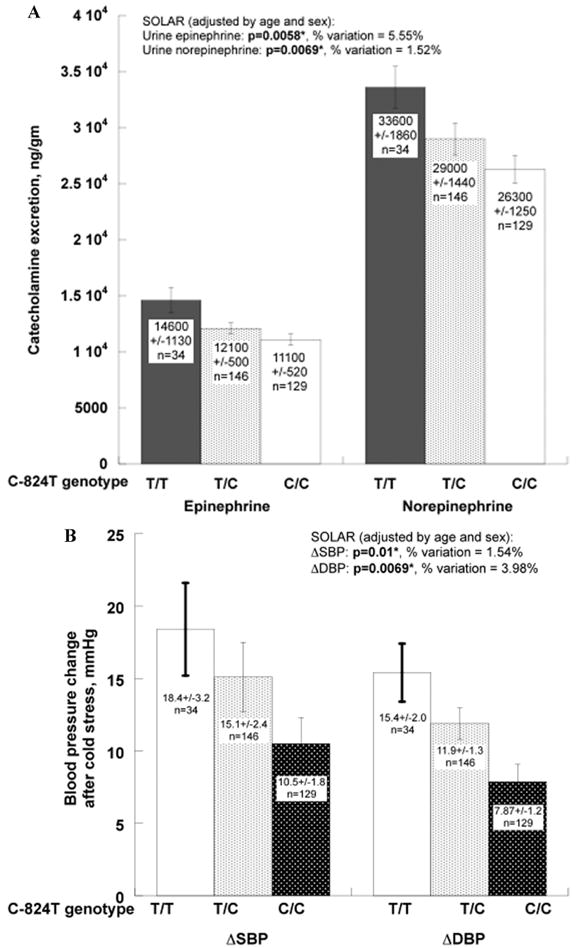

TH promoter polymorphism C-824T: Effects on catecholamine excretion and blood pressure response to stress in twins. Reproduced from Circulation (2007; 116(9): 993–1006.) (A) Influence of TH promoter polymorphism C-824T on catecholamine excretion. Urinary epinephrine excretion: SOLAR (adjusted by age, sex) P = 0.0058, explaining 5.55% of trait variation. Urinary norepinephrine excretion: SOLAR (adjusted by age, sex) P = 0.0069, explaining 1.52% of trait variation. (B) Influence of TH promoter polymorphism C-824T on blood pressure response to stress. Change of systolic blood pressure response to cold stress (ΔSBP), P = 0.01, explaining 1.54% of the trait variation. Change of diastolic blood pressure response to cold stress (ΔDBP), P = 0.0069, explaining 3.98% of the trait variation. (C) Pleiotropic effects of TH promoter polymorphism C-824T on the coupling between diastolic blood pressure response to stress (ΔDBP) and urinary norepinephrine. Bivariate χ2 = 10.4, P = 0.0013.
C-824T: Pleiotropy (Norepinephrine and Stress Blood Pressure)
C-824T exerted significant pleiotropic effects on the coupling between blood pressure response to cold stress and urinary norepinephrine (Fig. 3C). Increasing T-824C minor (T) allele copy number increased not only the change in DBP post cold stress, but also urinary norepinephrine excretion (bivariate likelihood ratio analyses: ΔDBP χ2 = 10.4, P = 0.0013; ΔSBP χ2 = 3.91, P = 0.048).
TH Promoter Haplotype Groups
From 10 SNPs in the TH proximal promoter, we inferred the presence of 17 haplotypes; the three most common haplotypes accounted for 84.8% of chromosomes examined. The most common haplotype overall (#1, CCGGTAAACG) is rather frequent (>37.1%) in Asian, Hispanic, and white populations, but relatively unusual (15.4%) in black samples. Haplotype #2 (CTGGTAGGCG) is the most common variant in blacks (at 35.6%), though relatively rare in Asians (10%). Similar haplotypes were derived by considering only the four most common promoter SNPs (C-824T, G-801C, A-581G, and G-494A).
Promoter Haplotype Effects on Autonomic Traits
Common Haplotypes
We formed haplotypes from the four most common promoter SNPs (C-824T, G-801C, A-581G, and G-494A), and then tested whether haplotype copy number (0, 1, or 2 per genome) at the diploid locus influenced biochemical or physiological trait means in twins. This approach is feasible (that is, it has sufficient power) for the most common haplotypes in a population. (We have designated these haplotypes #1 [CGAA], #2 [TGGG], and #3 [CCAG].)
The second most frequent promoter haplotype, haplotype #2, displayed copy number–dependent effects on stress change of blood pressure (both ΔSBP: P = 0.0154, % variation = 1.90%, and ΔDBP: P = 0.0004, % variation = 3.73%) (Fig. 4A), as well as urinary epinephrine (P = 0.0044, % variation = 5.7%) and norepinephrine excretion (P = 0.0125, % variation = 4.06%). Haplotype #3 displayed associations with both basal heart rate and change of heart rate during cold stress (P = 0.0104, % variation = 3.14%). However, there were no associations for trait means with copy number of the most frequent haplotype, haplotype #1.
Figure 4.

TH promoter haplotypes and autonomic traits. Reproduced from Circulation (2007; 116(9): 993–1006.) (A) Influence of TH promoter haplotype #2 (TGGG) on blood pressure response to stress. Change of systolic blood pressure response to cold stress (ΔSBP), P = 0.0154, explaining 1.90% of the trait variation; and diastolic blood pressure response to cold stress (ΔDBP), P = 0.0004, explaining 3.73% of the trait variation. (B) Diploid haplotypes: #1 & #2. Influence of TH promoter diploid haplotype (haplotypes #1 & #2) on change of diastolic blood pressure response during cold stress, P = 0.0312, explaining 3.47% of the trait variation.
Diploid Haplotypes (“Diplotypes”)
Haplotype #1/haplotype #2 diploid haplotype pairs influenced change of DBP during cold stress (ΔDBP: P = 0.0312, % variation = 3.47%; Fig. 4B). Haplotype #1/ haplotype #3 diploid combinations displayed associations with basal HR (P = 0.0335, % variation = 4.13%).
Promoter Haplotypes and Pleiotropy: Altering the Coupling between Norepinephrine Release and the Pressor Response to Environmental Stress
The effects of haplotype #2 displayed a pattern of pleiotropy (Fig. 5). Increasing copy number of haplotype #2 augmented changes in DBP (P = 0.0004, 3.73% variation explained) during cold stress, as well as urinary norepinephrine excretion (P = 0.0125, 4.06% variation explained), and the likelihood ratio test indicated a coordinate effect on the two traits (bivariate χ2 = 14.2, P = 0.0002).
Figure 5.

TH promoter haplotypes and pleiotropy. Pleiotropic effect of TH promoter haplotype #2 on the coupling between change of diastolic blood pressure during cold stress (ΔDBP) and renal norepinephrine excretion. Bivariate χ2 = 14.2, P = 0.0002. Reproduced from Circulation (2007; 116(9): 993–1006.)
Promoter Variants: Transcriptional Activity Probed by Chromaffin Cell Transfection/Expression
We assayed haplotype-specific gene expression in PC12 chromaffin cells (Fig. 6), with TH promoter/luciferase reporters for the two most common promoter haplotypes: #1 (most common) and #2 (second most common). Haplotype #2 was substantially more active in chromaffin cells; Figure 6B illustrates the increased activities of haplotype #2 both in vitro (driving transcription) and in vivo (determining norepinephrine secretion).
Figure 6.

Function of TH promoter haplotypes: Coordinate effects on in vitro TH transcription as well as in vivo catecholamine production. Results from promoter haplotype reporter transfection into PC12 chromaffin cells in vitro are shown on the X-axis, while renal norepinephrine excretion in vivo results for haplotype homozygotes are shown on the Y-axis. Haplotype #1 (CGAA) displays weaker promoter strength in vitro, while CGAA/CGAA homozygotes had diminished renal norepinephrine secretion in vivo. Conversely, haplotype #2 (TGGG) showed increased activity both in vitro and in vivo. Reproduced from Circulation (2007; 116(9): 993–1006.)
TH Promoter and Human Disease: Hypertension
Figure 7 illustrates a population-based case–control study, in which >1200 subjects were drawn from the highest and lowest 5th percentiles of blood pressure in a primary care practice of >53,000 adults. In a two-way ANOVA, there was a significant sex-by-genotype (TH C-824T) interaction on DBP (P = 0.044). As expected, sex also influenced DBP (P < 0.001). When the ANOVA was run in the presence or absence of C-824T, the results indicated that C-824T variation accounted for 3.4% of population DBP variance. When analyses were separately conducted on the sexes, the C-824T genotype effect was found in males (P = 0.045), though not females (P = 0.985). Inspection of the bar graph indicates that increasing numbers of the minor (T) allele increased DBP in males, though not females.
Figure 7.

TH promoter polymorphism and hypertension: Population blood pressure extremes. C-824T genotype interacts with sex to determine blood pressure in the population. The sample constituted >1200 individuals selected from the highest and lowest 4th–5th percentiles of DBP in a primary care population of >53,000. By two-way ANOVA there was a significant genotype-by-sex interaction (F = 3.14, P = 0.044), with results most prominent in males. Males alone also had a significant effect of genotype on DBP (F = 3.12, P = 0.045). Reproduced from Circulation (2007; 116(9): 993–1006.)
To explore the findings in the same group in model-free fashion, without relying on standard asymptotic assumptions, we also employed more computationally intensive permutation tests. We dichotomized subjects by blood pressure status (high versus low), and sex (male versus female). We then conducted 3-by-2 table permutation tests on the effect of C-824T diploid genotype (C/C, C/T, or T/T) on blood pressure status: the effect remained significant in males (P = 0.023), though not in females (P = 0.266).
Association of (TCAT)n (Intronic) Alleles with Autonomic Biochemistry and Physiology
At the intronic (TCAT)n polymorphism, significant associations were found for basal blood pressure and heart rate, post-stress heart rate, and catecholamine secretion. (TCAT)6 copy number affected basal pulse interval (P = 0.007) and heart rate (P = 0.0003), as well as post-stress heart rate (P = 0.0001). (TCAT)10i copy number affected basal pulse interval (P = 0.0349), plasma epinephrine (P = 0.0133), and renal norepinephrine excretion (P = 0.0309).
Discussion and Conclusions
Summary
We conclude that catecholamine secretory traits are heritable, displaying joint genetic determination (or pleiotropy) (Fig. 5) with autonomic activity and ultimately with blood pressure in the population (Figs. 7 and 8). Interindividual differences in catecholamine secretion are influenced by genetic variation in the adrenergic pathway encoding catecholamine synthesis, especially at the classically rate-limiting step, TH. These results document novel pathophysiological links between a key adrenergic locus, catecholamine metabolism, and blood pressure (Fig. 8), and suggest new strategies to approach the mechanism, diagnosis, and treatment of systemic hypertension.
Figure 8.

Intermediate phenotypes. The “intermediate phenotype” viewpoint formulates a series of time-dependent phenotypic manifestations of complex trait genetic variants: biochemical traits are hypothesized to be determined directly by genotype, followed later by physiological traits, and ultimately by late-penetrance disease (such as hypertension). Here the concept is illustrated by the findings at TH in the current study: the TH promoter variant C-824T initially alters norepinephrine production, subsequently influencing stress blood pressure responses (gene-by-environment interaction), finally predisposing to the development of fixed/established hypertension in the population. Reproduced from Circulation (2007).
Unifying Hypothesis
A schematic formulating our results into a global hypothesis is presented in Figure 8. It outlines the role of intermediate phenotypes and the TH candidate gene (especially its C-824T promoter variant) in the determination of hypertension via the initial intermediary of catecholamine metabolism.
Implications for Pathophysiology, Diagnosis, and Treatment
Our results suggest that the adrenergic pathway is centrally involved in the early pathogenesis of hypertension beginning in healthy individuals, perhaps initially by influencing transient blood pressure responses to environmental stress (Figs. 2, 3, and 8). Adrenergic genetic determination of biochemical (Figs. 2A and 3A), physiological (Figs. 2B and 3B), and ultimately disease traits (Fig. 7) suggests that treatments targeting the adrenergic pathway might be beneficial in preventing hypertension, if administered to subjects at specific genetic risk. Our results also suggest the possibility that adrenergic genetic profiling of patients with impaired autonomic activity or increased stress blood pressure might yield practical pharmacogenetic predictors of patients most likely to benefit from sympatholytic therapy.
Future Directions
Our results raise the possibility that profiling subjects for particular adrenergic and signaling polymorphisms would provide an index of risk for or susceptibility to hypertension. This prediction awaits testing in appropriate longitudinal cohorts.
Acknowledgments
We appreciate the assistance of the General Clinical Research Center (RR00827) and its core laboratory. Many of these data, including Tables and Figures, are reproduced from the original publication by us in Circulation (2007; 116(9): 993–1006.) This work was supported by the Department of Veterans Affairs and the National Institutes of Health, Bethesda, MD.
Footnotes
Conflicts of Interest The authors declare no conflicts of interest.
References
- 1.Flatmark T, Stevens RC. Structural insight into the aromatic amino acid hydroxylases and their disease-related mutant forms. Chem Rev. 1999;99:2137–2160. doi: 10.1021/cr980450y. [DOI] [PubMed] [Google Scholar]
- 2.Kobayashi K, Nagatsu T. Molecular genetics of tyrosine 3-monooxygenase and inherited diseases. Biochem Biophys Res Commun. 2005;338:267–270. doi: 10.1016/j.bbrc.2005.07.186. [DOI] [PubMed] [Google Scholar]
- 3.Zhou QY, Quaife CJ, Palmiter RD. Targeted disruption of the tyrosine hydroxylase gene reveals that catecholamines are required for mouse fetal development. Nature. 1995;374:640–643. doi: 10.1038/374640a0. [DOI] [PubMed] [Google Scholar]
- 4.Sharma P, Hingorani A, Jia H, et al. Positive association of tyrosine hydroxylase microsatellite marker to essential hypertension. Hypertension. 1998;32:676–682. doi: 10.1161/01.hyp.32.4.676. [DOI] [PubMed] [Google Scholar]
- 5.Zhang L, Rao F, Wessel J, et al. Functional allelic heterogeneity and pleiotropy of a repeat polymorphism in tyrosine hydroxylase: prediction of catecholamines and response to stress in twins. Physiol Genomics. 2004;19:277–291. doi: 10.1152/physiolgenomics.00151.2004. [DOI] [PubMed] [Google Scholar]
- 6.Rozen S, Skaletsky H. Primer3 on the WWW for general users and for biologist programmers. Methods Mol Biol. 2000;132:365–386. doi: 10.1385/1-59259-192-2:365. [DOI] [PubMed] [Google Scholar]
- 7.Nickerson DA, Tobe VO, Taylor SL. PolyPhred: automating the detection and genotyping of single nucleotide substitutions using fluorescence-based resequencing. Nucleic Acids Res. 1997;25:2745–2751. doi: 10.1093/nar/25.14.2745. [DOI] [PMC free article] [PubMed] [Google Scholar]
- 8.Buetow KH, Edmonson M, MacDonald R, et al. High-throughput development and characterization of a genomewide collection of gene-based single nucleotide polymorphism markers by chip-based matrix-assisted laser desorption/ionization time-of-flight mass spectrometry. Proc Natl Acad Sci USA. 2001;98:581–584. doi: 10.1073/pnas.021506298. [DOI] [PMC free article] [PubMed] [Google Scholar]
- 9.Kennedy B, Ziegler MG. A more sensitive and specific radioenzymatic assay for catecholamines. Life Sci. 1990;47:2143–2153. doi: 10.1016/0024-3205(90)90314-h. [DOI] [PubMed] [Google Scholar]
- 10.Parmer RJ, Cervenka JH, Stone RA, O’Connor DT. Autonomic function in hypertension. Are there racial differences? Circulation. 1990;81:1305–1311. doi: 10.1161/01.cir.81.4.1305. [DOI] [PubMed] [Google Scholar]
- 11.O’Connor DT, Insel PA, Ziegler MG, et al. Heredity and the autonomic nervous system in human hypertension. Curr Hypertens Rep. 2000;2:16–22. doi: 10.1007/s11906-000-0053-8. [DOI] [PubMed] [Google Scholar]
- 12.Do KA, Broom BM, Kuhnert P, et al. Genetic analysis of the age at menopause by using estimating equations and Bayesian random effects models. Stat Med. 2000;19:1217–1235. doi: 10.1002/(sici)1097-0258(20000515)19:9<1217::aid-sim421>3.0.co;2-q. [DOI] [PubMed] [Google Scholar]
- 13.Almasy L, Blangero J. Multipoint quantitative-trait linkage analysis in general pedigrees. Am J Hum Genet. 1998;62:1198–1211. doi: 10.1086/301844. [DOI] [PMC free article] [PubMed] [Google Scholar]
- 14.Stephens M, Smith NJ, Donnelly P. A new statistical method for haplotype reconstruction from population data. Am J Hum Genet. 2001;68:978–989. doi: 10.1086/319501. [DOI] [PMC free article] [PubMed] [Google Scholar]
- 15.Falconer DS, Mackay TFC. Heritability. Introduction to quantitative genetics. 1996;1996:160–183. [Google Scholar]
- 16.Almasy L, Dyer TD, Blangero J. Bivariate quantitative trait linkage analysis: pleiotropy versus co-incident linkages. Genet Epidemiol. 1997;14:953–958. doi: 10.1002/(SICI)1098-2272(1997)14:6<953::AID-GEPI65>3.0.CO;2-K. [DOI] [PubMed] [Google Scholar]
- 17.Nyholt DR. A simple correction for multiple testing for single-nucleotide polymorphisms in linkage disequilibrium with each other. Am J Hum Genet. 2004;74:765–769. doi: 10.1086/383251. [DOI] [PMC free article] [PubMed] [Google Scholar]
- 18.Mehta CR, Patel NR. A network algorithm for performing Fisher’s exact test in R×C contingency tables. J Am Stat Assoc. 1983;78:427–434. [Google Scholar]
- 19.Clarkson D, Fan YA, Joe H. A remark on algorithm 643: FEXACT: an algorithm for performing Fisher’s exact test in R×C contingency tables. ACM Trans Math Software. 1993;19:484–488. [Google Scholar]