Abstract
Macrophage colony-stimulating factor (M-CSF) is a critical cytokine in the development of monocytic lineage and may have immunoregulatory properties. Here we show that peritoneal antigen presenting cells (APCs) treated with M-CSF produced decreased levels of proinflammatory cytokines IFN-γ, TNF-α and IL-12. These APCs treated with M-CSF + autoantigen peptide significantly suppressed antigen-specific T cell proliferation, induced regulatory CD4+ and CD8+ T cells in vitro and in vivo, and significantly suppressed experimental autoimmune encephalomyelitis (EAE). Thus, in vitro treatment of APCs with M-CSF + autoantigen can be a novel therapeutic option for autoimmune diseases.
Keywords: APC, suppression, experimental autoimmune encephalomyelitis
1. INTRODUCTION
Antigen-presenting cells (APCs) play a pivotal role in the induction and expansion of antigen-specific T-cell responses (Lee et al., 2007; Saalmüller A. 2006). Professional APCs can either promote or suppress immune responses depending on their stage of maturation or level of activation (Lee et al., 2007; Saalmüller, 2006). In mice, APCs that produce large quantities of IL-12 and IFN-γ induce Th1 responses; APCs that produce low amounts of IL-12 but a high level of MCP-1 preferentially induce Th2 responses, whereas APCs that produce a low level of IL-12 but a high level of IL-10 induce regulatory T cell (Tr) responses (de Jong et al., 2005). In addition, our laboratory found that APCs of IL-12Rβ1−/− mice, which lack both IL-12 and IL-23 signaling, exhibit bias toward inducing Th2 response (Zhang et al., 2003). Dendritic cells (DCs) and macrophages are the two most important types of professional APCs, with similar functions and profiles of secreted cytokines (Lee et al., 2007; Saalmüller, 2006; Unanue, 1984). However, it has been found that, upon similar stimulation, such as with LPS + IFN-γ, DCs produced a high level of IL-12 but low level of IL-10, while macrophages produced high level of IL-10 but low level of IL-12 (Smith et al., 1998). This indicates that macrophages might have a natural propensity for producing regulatory cytokines, making them potentially a good candidate for generation of APCs with tolerogenic function.
Function of APCs can be modified by cytokine treatment (Kosiewicz et al., 1997; Steinbrink et al., 1997; Wilbanks et al, 1992). For example, in anterior chamber-associated immune deviation (ACAID), intraocular injection of antigen induces systemic and antigen-specific tolerance. Streilein and colleagues have suggested that in this model macrophages, under the influence of TGF-β produced in the ocular environment, acquire tolerogenic phenotype (Wilbanks et al., 1992; Hara et al., 1993). Adherent peritoneal exudate cells (PEC, primarily MΦ) cultured with antigen and TGF-β in vitro induced immunosuppression in vivo upon adoptive transfer (Wilbanks et al., 1992; Hara et al., 1992). Given the direct APC-T cell interaction, APCs that can induce antigen-specific tolerance could be an effective and specific means of targeting autoreactive T cells and thus treating autoimmune diseases.
Macrophage colony-stimulating factor (M-CSF) was first identified as a stimulus of monocyte maturation and function (Yanai et al., 1990). Subsequent investigations revealed that M-CSF has a variety of functions such as inhibiting production of proinflammatory cytokines (Kojima et al., 1996; Nishina et al., 2004), and M-CSF levels dramatically increase in immunosuppressive conditions (Bartocci et al., 1986; Ikeno et al., 1996; Saito et al., 1992). M-CSF-stimulated macrophages produce a large amount of IL-10, but a minimal level of IL-12 (Smith et al., 1998). Recently, Li et al. demonstrated an unrecognized role of M-CSF in driving monocyte differentiation into IL-10highIL-12null DCs with tolerogenic potential (Li et al., 2005). Taken together, these results suggest that M-CSF has the potential to induce tolerogenic phenotype in APC.
In this report, we investigate the effect of M-CSF-treated peritoneal APCs, encompassing >95% macrophages, on experimental autoimmune encephalomyelitis (EAE), an animal model of the human disease multiple sclerosis (MS). We found that APCs treated with M-CSF produced low levels of proinflammatory cytokines. These APCs pulsed with autoantigen peptide significantly suppressed antigen-specific T cell proliferation, induced regulatory CD4+ and CD8+ T cells in vitro and in vivo, and significantly suppressed EAE. These studies indicate that APCs treated with autoantigen and M-CSF in vitro could be a novel therapeutic modality for autoimmune diseases.
2. MATERIALS AND METHODS
2.1. APC preparation
Female, 8-week-old, C57BL/6 mice were purchased from the Jackson Laboratory (Bar Harbor, ME). PECs were generated by intraperitoneal injection of 2 ml of 3% thioglycolate. Cells were harvested 3 days later by peritoneal lavage (Wilbanks et al., 1992) and cultured 24 h in serum-free medium (1×10⁶ cells/ml). The cells were then collected and treated with DNAse, washed two times, and resuspended in HBSS or FACS staining buffer. The viability of cells was >97% as determined by trypan blue. The purity was determined by flow cytometry using antibodies to murine CD11b and CD11c (BD PharMingen, San Diego, CA). CD11b+CD11c− cells were considered to be macrophages, whereas CD11b+CD11c+ were identified as DCs.
2.2. Profiling of APCs treated with M-CSF
For cytokine profile analysis of APCs after M-CSF treatment, 1 × 10⁶ of PEC were cultured with or without 10 ng/ml of M-CSF overnight and then stimulated with 100 ng/ml Escherichia coli LPS (Sigma-Aldrich) for 24 h. Supernatants were then harvested and ELISA assays were performed for inflammatory cytokines IL-6, TNF-α, IFN-γ, IL-12p70 and immunoregulatory cytokines IL-10, TGF-β, using paired mAbs according to the manufacturer’s recommendations (PharMingen). Cells treated as described above were characterized by surface staining with antibodies to MHC II (I-A/I-E), CD40, CD80, CD86, PD-L1 and PD-L2 after blocking Fc receptors with anti-CD16/CD32, and subsequent analysis by flow cytometry. All data were analyzed using CellQuest software (Beckson-Dickson).
2.3. Co-culture system for Tr differentiation and lymphocyte proliferation response
The co-culture system was set up with MOG-reactive T cells and MOG35–55 + M-CSF-treated APCs. CD4+ and CD8+ T cells were purified from the spleen of naïve MOG35–55 TCR transgenic mice (gift from Dr. V. Kuchroo, Harvard University) using anti-CD4- or anti-CD8-coupled magnetic beads (Miltenyi Biotec). More than 95% of T cells in spleen of these mice were CD4+ cells, the majority of which expressed transgenic TCR Vα3.2 (91.3%) and Vβ11 (93.8%) (Bettelli et al., 2003). In contrast, 3–5% of T cells in spleen of these mice are CD8+, among which 20–30% express transgenic TCR (data not shown). Purity of CD4+ T cells, CD8+ T cells and APCs was ≥95% for all, as determined by FACS. APCs were cultured for 24 h with M-CSF only at 10 ng/ml, MOG35–55 only at 10 μM, or MOG35–55 + M-CSF, as previously described (Menges et al., 2002; Alard et al., 2004). Viability of the final APC population used for all experiments was >97% (data not shown). These MOG and/or M-CSF-treated APCs were washed and mixed with purified CD4+ or CD8+ T cells at a ratio of 1:1 as previously described (Zhang et al., 2003), and cultured at a final density of 2.0 × 10⁶/ml in RPMI 1640 supplemented with 10% FCS and 10 μg/ml of MOG35–55. To determine APC-driven Tr differentiation, immunostaining for cell surface molecules and intracellular Foxp3 expression was carried out after 5 days of culture. Briefly, 1 × 10⁶ cells/tube were incubated with antibodies to surface molecules CD4, CD8, CD25, CD152 (CTLA-4) and CD122 after blocking with Fc-block antibodies. Intracellular staining was performed for Foxp3 expression. Cells that had been stained for surface markers were fixed and permeabilized using Cytofix/Cytoperm system (BD bioscience). After permeablization, cells were intracellularly stained with antibody against Foxp3 for 30 min in 4°C. Data were collected using FACSAria and analyzed by FACSDiva software.
For proliferation, purified CD4+ cells from MOG-specific TCR transgenic mice were cocultured with MOG35–55 and/or M-CSF-treated APCs for 3 days. MOG35–55 was added to appropriate wells of all groups at a final concentration of 10 μg/ml, control antigen OVA323–336 at 10 μg/ml, Con A at 5 μg/ml, or no antigen/mitogen was added. After 60 h of incubation, cultures were pulsed for 12 h with 1 μCi of 3H-methylthymidine (42 Ci/mmol). Cells were harvested on fiberglass filters, and thymidine incorporation was measured by scintillation counter.
2.4. Treatment of EAE mice with APCs
To induce EAE, female, 8-week-old C57BL/6 mice were injected subcutaneously with 200 μg MOG35–55 in CFA containing 4 mg/ml Mycobacterium tuberculosis H37Ra (Difco, Detroit, MI) at 2 sites on the back. Two hundred ng of pertussis toxin was given i.p. on days 0 and 2 post immunization (p.i.). For APC-based treatment of EAE, APCs were cultured with M-CSF at 10 ng/ml, MOG35–55 only at 10 μM, or MOG35–55 + M-CSF for 24 h, washed, and injected i.v. at 1× 10⁶ cells/mouse in 200 μl of cell suspension. Choice of this cell number was based on published work (Menges et al., 2002; Alard et al., 2004). APCs cultured in medium only served as control. The final APC population used for all experiments was >95% CD11b+CD11c− and viability was >97% (data not shown). In another series of experiments, EAE mice were i.v. injected three times with APCs (1× 10⁶ cells/mouse in 200 μl of cell suspension) that had been subjected to different manipulations. To determine whether observed phenomenon is antigen specific, APCs cultured with M-CSF (10 ng/ml) + OVA323–336 (10 μM) were i.v. injected three times, and a group of EAE mice that received untreated APCs served as control. EAE was scored according to a 0–5 scale as follows (Benson et al., 2000): 1, limp tail or waddling gait with tail tonicity; 2, waddling gait with limp tail (ataxia); 2.5, ataxia with partial limb paralysis; 3, full paralysis of one limb; 3.5, full paralysis of one limb with partial paralysis of second limb; 4, full paralysis of 2 limbs; 4.5, moribund; and 5, death. Clinical EAE was scored daily in a blinded manner. All work was performed in accordance with Thomas Jefferson University guidelines for animal use and care.
2.5. Adoptive transfer of CD4+ or CD8+ T cells derived from EAE mice treated with manipulated APCs
To determine the cell types that are responsible to EAE suppression, CD4+ or CD8+ T cells were purified by negative selection with MACS magnetic cell sorting from the spleen of EAE mice that received MOG35–55 and M-CSF-treated APCs at week 5 p.i.. Purity was confirmed by flow-cytometric analyses of cells immunostained with anti-CD8 and anti-CD4 antibodies (both from BD PharMingen, San Diego, CA). CD4+ T cells, CD8+ T cells or CD4−CD8− cell fractions (5×10⁶) were injected i.v. into C57BL/6 mice 3 days before immunization for EAE. Clinical symptoms were monitored every other day for 6 weeks p.i.
2.6. Histopathology
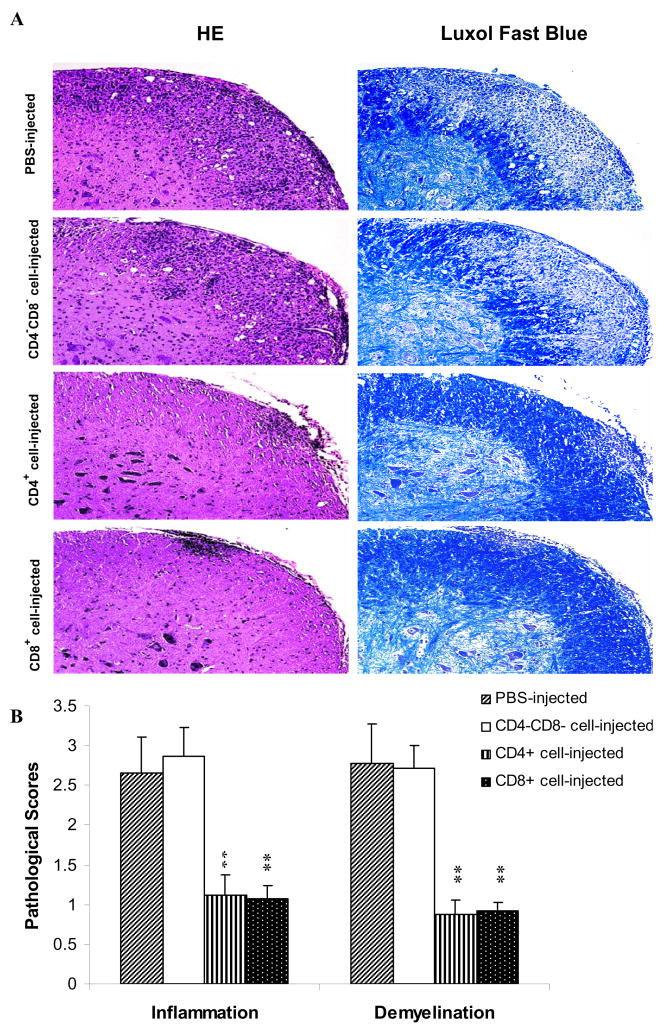
Six weeks p.i., spinal cords were harvested after extensive perfusion. Five-μm sections were stained with H&E or Luxol fast blue (myelin stain). Slides were assessed in a blinded fashion for inflammation and demyelination, as follows (Calida et al., 2001). For inflammation: 0, none; 1, a few inflammatory cells; 2, organization of perivascular infiltrates; and 3, increasing severity of perivascular cuffing with extension into the adjacent tissue. For demyelination: 0, none; 1, rare foci; 2, a few areas of demyelination; 3, large (confluent) areas of demyelination.
2.7. Serum cytokine production by cytometric bead array
Sera from T cell transferred mice were harvested at week 6 p.i. Cytokine profile was detected in these sera using the mouse Th1/Th2 cytokine CBA kit and inflammatory cytokine kit from BD Biosciences (San Jose, CA). Fifty microliters of supernatant, 50 μl of capturing beads and 50 μl of Th1/Th2 PE detection reagent were combined and incubated for 2 h at room temperature in the dark. Samples were washed, resuspended in approximately 200 μl of wash buffer and analyzed by flow cytometry (FACSCalibur; Becton Dickinson, San Jose, CA). Standard curves were generated for each cytokine using a mixed bead standard to quantify cytokine concentrations in pg/ml. CBA kit for IL-17 measurement is not available, and concentration of this cytokine was determined by an ELISA kit (PharMingen).
2.9. Statistics
Analysis of variance (ANOVA) was used for comparison of clinical score, proliferative responses and cytokine profiles between different groups. Flow cytometry data were analyzed using K-S statistics. All significance tests were two-sided.
3. RESULTS
3.1. Cytokine production by APCs treated with M-CSF
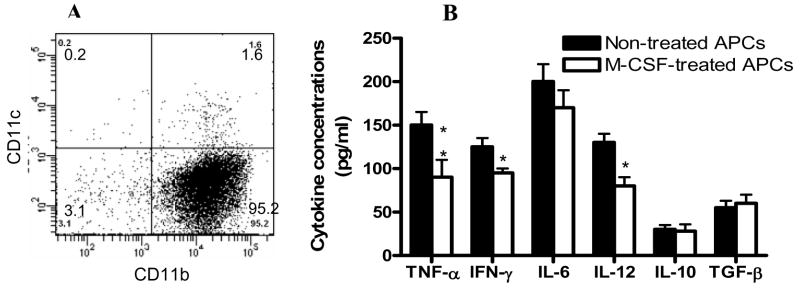
We first determined the purity of peritoneal APCs by flow cytometry and found that >95% of these cells were CD11b+CD11c− and 1.8% were CD11c+ (Fig. 1A). After overnight culture with 10 ng/ml of M-CSF followed by 100 ng/ml of LPS for 24 h, supernatants were assayed for the production of proinflammatory cytokines IL-6, IL-12p70, TNF-α, IFN-γ and anti-inflammatory cytokines IL-10 and TGF-β. M-CSF-treated APCs produced significantly lower levels of TNF-α, IFN-γ, and IL-12p70 than APCs that were not treated with M-CSF (p<0.05–0.01, Fig. 1B). The production of IL-10, TGF-β and IL-6 was not significantly different between APCs treated or not with M-CSF (Fig. 1B). No significant difference in expression of MHC class II and co-stimulatory molecules between APCs treated or not with M-CSF was found (data not shown
Fig. 1. Purity of APCs and cytokine profile after M-CSF treatment.
Peritoneal APCs were prepared as described in Materials and Methods. (A) Purity was determined by flow cytometry and >95% of these cells were CD11b+CD11c−. CD11c+ DCs constituted less than <2% of all cells. (B) Cytokine levels in supernatants of APCs treated with M-CSF. These cells were cultured with 10 ng/ml of M-CSF overnight and then stimulated with 100 ng/ml Escherichia coli LPS (Sigma-Aldrich) for 24 h. Cells cultured in the absence of M-CSF (non-treated APCs) served as control. After 24 hrs culture, supernatants were harvested and cytokine production was assayed by ELISA. P values refer to the comparisons between M-CSF-treated and non-treated groups. *, p< 0.05; **, p < 0.01. One representative of 3 experiments is shown.
3.2. M-CSF + MOG treated APCs induce CD4+ Tr and CD8+ Tr cells
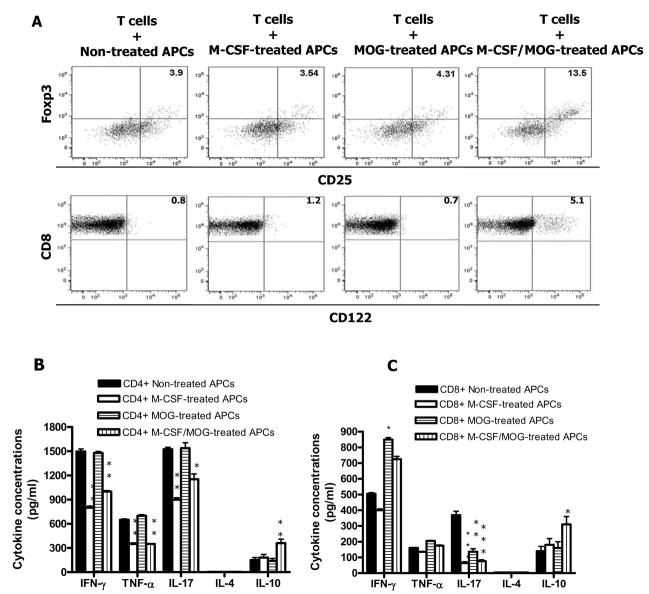
Since M-CSF-treated APCs produced lower levels of proinflammatory cytokines, we hypothesized that these APCs may have a capacity to drive a Th2 or Tr differentiation of naïve T cells. To test this possibility, we treated APCs with M-CSF and/or autoantigen MOG35–55, and afterwards cocultured them with CD4+ T cells isolated from MOG-specific TCR transgenic mice. M-CSF + MOG-treated APCs induced an increased number of cells with Tr phenotype (CD4+CD25+Foxp3+) compared to other groups (Fig. 2A). No difference was found in CTLA-4 expression among these groups (data not shown). We then investigated whether M-CSF + MOG-treated APCs induced regulatory CD8+ T cells. Coculture of CD8+ T cells from MOG specific TCR transgenic mice with M-CSF + MOG-treated APCs induced an increased level of CD8+CD122+ T cells, a phenotype characteristic of CD8+ Tr cells (Endharti et al., 2005; Rifa’i et al., 2007), whereas CD8+ T cells cultured with APCs stimulated with MOG or M-CSF alone were preferentially CD122− (Fig. 2A).
Fig. 2. M-CSF + MOG-treated APCs induce CD4+ Tr and CD8+ Tr in vitro.
CD4+ and CD8+ T cells were purified from spleen of MOG-specific TCR transgenic mice (C57BL/6 background). APCs were prepared from peritoneal cavity of syngenic C57BL/6 mice and cultured with M-CSF only, MOG35–55 only, and M-CSF + MOG35–55 for 24 hrs. Cells cultured in the absence of both M-CSF and MOG35–55 (non-treated APCs) served as control. These APCs were co-cultured with purified CD4+ and CD8+ at a 1:1 ratio for 5 days (n =5 in each group) in the presence of MOG35–55. After 3 days, cells were harvested and stained with anti-CD4, CD8, CD25, CD122 and Foxp3, and assayed by flow cytometry (A). Cytokine secretion in coculture supernatants of CD4+ (B) and CD8+ (C) T cells with treated and non-treated APCs after MOG35–55 stimulation. Columns refer to mean values, and bars to SD. P values refer to comparison between M-CSF + MOG-treated group and other groups. *, P<0.05; ** P<0.01. Data are representative of two repeated experiments.
We then determined cytokine levels in the co-culture supernatants. Co-culture of CD4+ or CD8+ T cells from MOG specific TCR transgenic mice with M-CSF or with M-CSF + MOG-treated APCs resulted in decrease production of proinflammatory cytokines IFN-γ, TNF-α, and IL-17, while co-culture of CD4+ and CD8+ T cells with M-CSF + MOG-treated APCs induced a significant increase in production of Tr cytokine IL-10 (Fig. 2B, C). Th2 cytokine IL-4 was not detectable. These data demonstrate that M-CSF + MOG-treated APCs induced an increased fraction of CD4+ and CD8+ T cells with Tr phenotype.
3.3. M-CSF + MOG treated APCs inhibited MOG-induced lymphocyte proliferation response
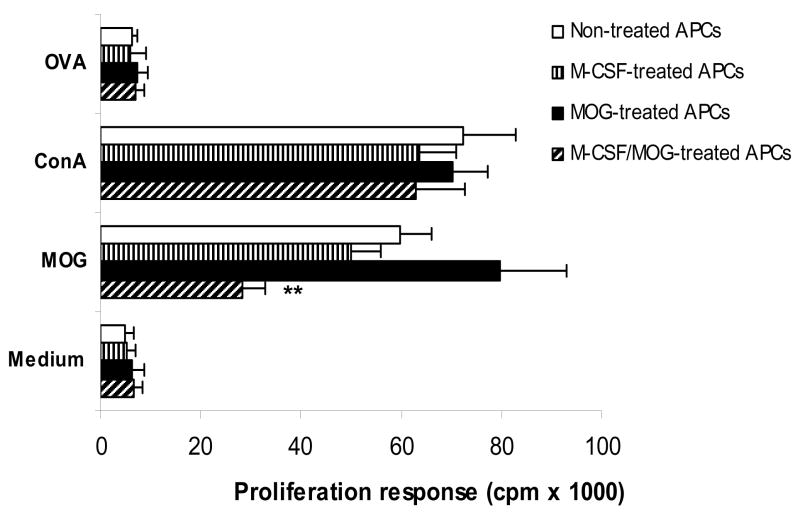
CD4+ cells from naïve MOG TCR transgenic mice co-cultured with M-CSF + MOG-treated APCs show a significantly lower proliferative response than CD4+ cells cocultured with MOG- or M-CSF-treated APCs or non-treated APCs (Fig. 3). These CD4+ cells proliferate in response to mitogen Con A to a similar level, but not to negative control peptide OVA323–336 demonstrating that only proliferation induced by antigen-specific stimulation is affected by M-CSF + MOG-treated APCs.
Fig. 3. M-CSF + MOG-treated APCs induce lower levels of T cell proliferative response.
Purified CD4+ T cells of MOG-specific TCR transgenic mice cocultured with M-CSF and/or MOG-treated APCs at a 1:1 ratio for 5 days (n =5 in each group) were cultured with MOG35–55 at 10 μg/ml, OVA323–336 at 10 μg/ml, Con A at 5 μg/ml, or without antigen/mitogen. APCs cultured in the absence of both M-CSF and MOG35–55 (non-treated APCs) served as control. Proliferation was detected by incorporation of 3H-methylthymidine. Columns refer to mean values, and bars to SD. P values refer to comparison between M-CSF + MOG-treated group and other groups. ** P<0.01. Data are representative of two experiments.
3.4. Suppression of EAE by M-CSF + MOG-treated APCs
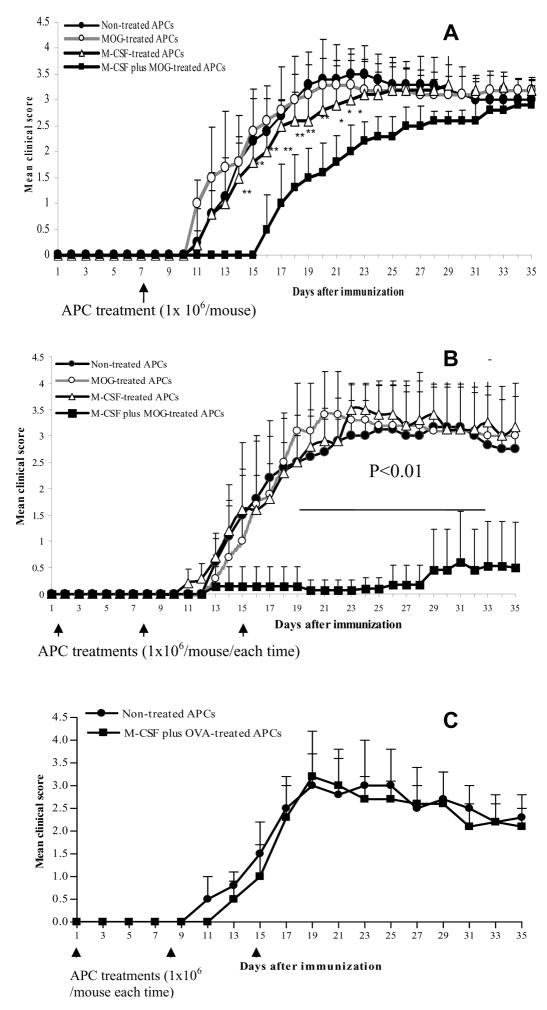
To determine the in vivo immunoregulatory properties of APCs treated with M-CSF and/or MOG35–55, these treated cells were i.v. injected (1 × 10⁶ cells/mouse) into mice immunized with MOG in CFA. EAE mice that received PBS only served as controls. We found that a single injection of M-CSF + MOG-treated APCs given at day 8 after EAE induction significantly ameliorated the early course of the disease (Fig. 4A). Three injections of M-CSF + MOG treated APCs (at 1, 8, 15 days p.i. after EAE induction) led to a profound inhibition of clinical EAE over the observation period (Fig. 4B). Although all other groups of mice had 100% incidence and 10%~25% mortality (1/10 with untreated APCs, 2/11 with MOG-treated APCs and 3/12 with M-CSF-treated APCs), mice that received M-CSF + MOG-treated APCs had lower EAE incidence (6 of 12) and no mice died from the disease (0/12). Ninety percent of mice that did not receive APC treatment had a severity score of >3.4; 80% of mice that received M-CSF + MOG-treated APCs had a score of 1 or 0. In contrast, APCs cultured with M-CSF + control antigen OVA failed to suppress EAE (Fig. 4C), demonstrating antigen-specific nature of observed suppression. Thus, repetitive administration of M-CSF + MOG-treated APCs represents an effective approach for EAE suppression.
Fig. 4. EAE suppression after APC treatments.
EAE was induced by MOG35–55 and CFA. (A) Seven days p.i., each mouse was given via tail vein 1 × 10⁶ APC cells after different manipulations as described in Materials and Methods. APCs cultured in the absence of both M-CSF and MOG35–55 (non-treated APCs) served as control. The final APC population used for all experiments was >95% CD11b+CD11c− and viability was >97%. EAE was scored according to a 0–5 scale. (B) In another series of experiment, EAE mice were i.v. injected three times with differently manipulated APCs. (C) OVA + M-CSF-treated APCs could not protect from EAE. As a peptide specificity control, three injections of OVA323–336 + M-CSF-pulsed APCs were given i.v. as described in (B) and a group of EAE mice received non-treated APCs. Data are shown as mean clinical scores ± SD (n = 10–12 per group). P values refer to the comparison between mice that received M-CSF + MOG-treated APCs with mice that received other types of APCs. * P<0.05; **, P<0.01. One representative of 2 experiments is shown. Arrows represent the time of APC injections.
3.5. Transfer of EAE inhibition by CD4+ and CD8+ cells from mice that received M-CSF + MOG-treated APCs
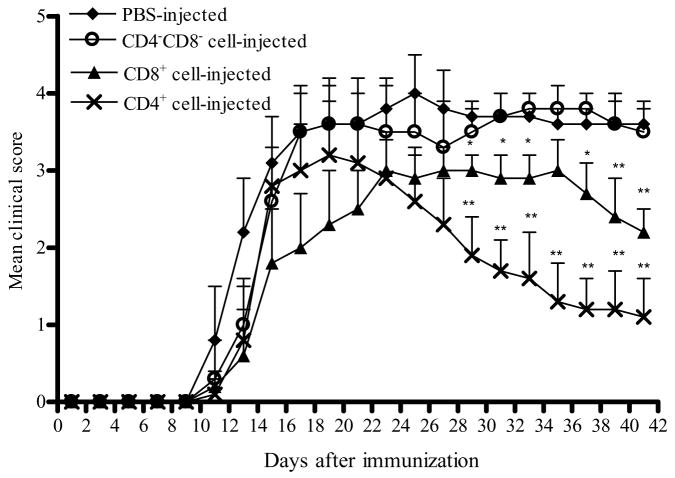
As M-CSF + MOG-treated APCs, but not APCs treated with MOG or M-CSF alone, could suppress EAE in vivo (Fig. 4) and induce CD4+ and CD8+ Tr cells in vitro (Fig. 3), we focused on the question whether suppression of EAE in mice that received M-CSF + MOG-treated APCs is through the in vivo induction of Tr cells. Splenic CD4+ and CD8+ T cells from mice that were adoptively transferred with M-CSF + MOG treated APCs, and subsequently exhibited a peak EAE score of 0 or 1 (at week 5 p.i.), were purified and transferred to a recipients (5 × 10⁶ cells/mouse) 3 days before EAE induction. EAE mice that received no cells served as control. As shown in Fig. 5, control mice developed typical EAE, while transfer of CD4+ or CD8+ cells from mice that received M-CSF + MOG-treated APCs resulted in accelerated recovery from clinical EAE. This phenomenon of facilitated recovery was more pronounced in mice transferred with CD4+ T cells than with CD8+ T cells (P<0.01). In contrast, mice that received splenic cells depleted of CD4+ and CD8+ cells (CD4−CD8− cell fraction) exhibited disease severity similar to non-treated EAE control mice, suggesting that Tr cells mediate EAE suppression induced by M-CSF + MOG treated APCs.
Fig. 5. Transfer of EAE suppression by CD4+ or CD8+ T cells of APC-treated mice.
CD4+ or CD8+ T cells were purified from spleen of EAE mice that received M-CSF + MOG-treated APCs at week 5 p.i. CD4+ or CD8+ T cells, or CD4−CD8− (non-T cell) cell fractions (5×10⁶) were injected i.v. into B6 mice at day -3 p.i. Clinical symptoms were monitored every other day up to 6 weeks p.i. A line chart represents mean EAE clinical scores over time among groups of mice that were given CD4+, CD8+, or CD4−CD8− cells, or no cells (n =10–13 per group). P values refer to the comparison between mice that received CD4+ or CD8+ T cells and mice that received no cells. * P<0.05; **, P<0.01. One representative of two experiments is shown.
Consistent with the clinical findings, histological examination of CNS tissues revealed a dramatic difference between CD4+ or CD8+ cell-treated mice and CD4−CD8− cell- or non-treated mice. In CD4−CD8− cell-treated or non-treated mice, multiple inflammatory foci were observed in the white matter of the spinal cord and infiltration scores were 2.65 ± 0.5, 2.87 ± 0.4, with extensive demyelination (Fig. 6A). By contrast, few inflammatory cells and little or no demyelination were detected in CD4+ or CD8+ T cell-treated groups (Fig. 6A). The differences between non-treated EAE mice and mice treated with CD4+ or CD8+ Tr cells were statistically significant (all P<0.01; Fig. 6B).
Fig. 6. Histopathology of the spinal cord.
Mice that received CD4+, CD8+, or CD4−CD8− cells of APC-treated mice were sacrificed at week 6 p.i. (n =5 in each group). Spinal cords were harvested after extensive perfusion, and 5-μm sections were stained with H&E (for inflammation) and Luxol fast blue (for demyelination) (A). Original magnification, × 40. The mean values ± SD (n =5 in each group) are shown in (B). P values refer to comparison between CD4+, CD8+, or CD4−CD8− cell-treated groups and non-treated EAE control. ** P<0.01. One representative of three experiments is shown.
3.6. Measurement of T cell proliferative responses
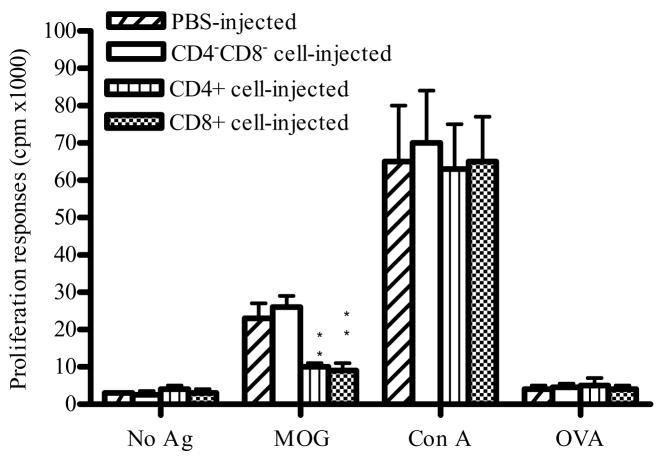
We further studied ex vivo proliferative response of splenocytes from T-cell transferred mice to MOG35–55, control antigen OVA, and mitogen Con A. Cells cultured without antigen/mitogen served as a background control. Low proliferative responses were observed in all groups without antigen stimulation or with control antigen OVA. Splenocytes from mice that received either purified CD4+ T cells or CD8+ T cells exhibited significantly lower MOG-induced proliferative responses compared to mice that received non-CD4, non-CD8 fraction or to mice that received no cells (P<0.01; Fig. 7). In contrast, splenocytes from all groups of mice proliferated vigorously in response to Con A (Fig. 7). These data demonstrate that adoptive transfer of CD4+ T cells or CD8+ T cells induced antigen-specific, but not general suppression of T cell proliferative responses.
Fig. 7. MOG35–55-induced proliferative responses.
4 × 10⁵ spleen cells from CD4+, CD8+, CD4−CD8− cell-treated mice and PBS-injected EAE control mice (n =5 in each group) at week 6 p.i. were cultured with MOG35–55 (10 μg/ml), OVA323–336 (10 μg/ml), Con A (5 μg/ml), or without antigen/mitogen. Proliferation was determined by incorporation of 3H-methylthymidine. Columns indicate mean values, and bars SD. P values refer to comparison between CD4+, CD8+, or CD4 −CD8 − cell-treated groups and non-treated EAE control. ** P<0.01. Data are representative of two repeated experiments.
3.7. Cytokine levels in the sera of mice transferred with T cells
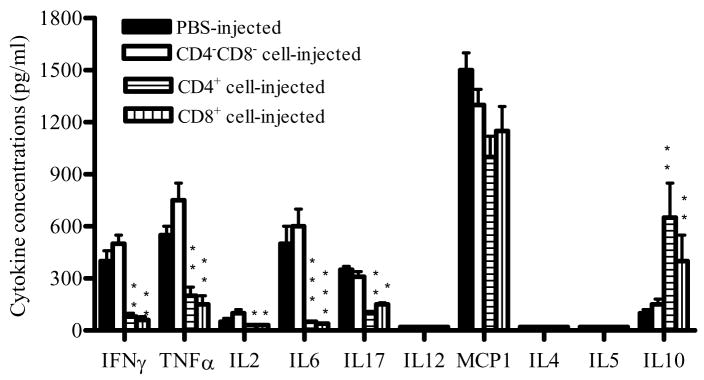
To study the in vivo cytokine profile in mice transferred with CD4+, CD8+ and non CD4/CD8 fractions, sera from these mice were studied at week 6 p.i. As shown in Fig. 8, the production of inflammatory cytokines TNF-α, IFN-γ, IL-2, IL-6 and IL-17 in CD4+ and CD8+ cell-injected mice decreased 2–5 fold compared to the CD4−CD8− cell-injected mice or the PBS-injected EAE control group (P<0.05–0.01), while the production of IL-10 increased dramatically (P<0.01). No significant difference was found in MCP-1 production among the groups. IL-4, IL-5 and IL-12p70 were below detectable levels in all groups.
Fig. 8. Cytokine profile in the serum of mice treated with different T cell fractions.
To determine the in vivo cytokine profile of mice treated with different T cell fractions, sera were collected from CD4+, CD8+, CD4−CD8− cell-treated mice and PBS-injected EAE control mice at week 6 p.i. Cytokine production was measured using a Th1/Th2 kit and a proinflammatory cytokine kit by flow cytometry while IL-17 level was determined by ELISA. Columns indicate mean values, and bars SD (n =5 in each group). P values refer to comparison between CD4+, CD8+, or CD4−CD8− cell-treated groups and non-treated EAE control. *P<0.05, ** P<0.01. Data are representative of two experiments.
4. DISCUSSION
In the present study we found that APCs stimulated with M-CSF + MOG35–55 peptide exhibit a tolerogenic phenotype, and exhibit a capacity to induce regulatory T cells in vitro and in vivo. We propose that APCs treated in vitro by M-CSF + autoantigen can have therapeutic potential in inflammatory autoimmune diseases.
APCs play an important role in initiating and directing T-cells towards immunity or tolerance (Raimondi et al., 2006; Lee et al., 2007). Indeed, APCs provide T cells not only with an antigen-specific stimulatory signal (ligation of TCR) and a series of costimulatory signals, but also produce cytokines that polarize T cells toward different lineages (Th1, Th2, Th17, Tr) (de Jong et al., 2005; Kapsenberg and Kalinski, 1999). Our results show that M-CSF + MOG-treated APCs produce a low level of proinflammatory cytokines IFN-γ, TNF-α and IL-12, indicating a tolerogenic APC phenotype. Functionally, these APCs possess a potent capacity to polarize naïve CD4+ and CD8+ T cells into Tr cells, demonstrated by decreased production of IFN-γ, TNF-α, IL-17, and increased IL-10 production. A high level of IL-10 but undetectable IL-4 production supported a Tr but not Th2 type differentiation (de Jong et al., 2005). More importantly, clinical EAE was effectively suppressed by injection of M-CSF + MOG-treated APCs. EAE inhibition could be transferred by both CD4+ and CD8+ T cells derived from mice that received M-CSF + MOG-treated APCs. These adoptively transferred mice showed significant increase in IL-10 production and decrease in the production of proinflammatory cytokines (Fig. 8), confirming the APC-driven Tr functions of transferred T cells. Significant suppression of proliferative responses was exhibited only to autoantigen MOG, but not to control antigen OVA or mitogen Con A, indicating that the immunoregulation induced in vivo by these APCs does not interfere with global immune response.
Although CD4+CD25+ Tr cells are primarily generated in the thymus, these cells can also originate from peripheral CD4+CD25− cells (Liang et al., 2005). The involvement of CD4+CD25+ cells in the suppression of EAE has been documented by in vivo and in vitro studies. In particular, depletion of CD4+CD25+ T cells using anti-CD25 antibodies enhances EAE, and results in the development of EAE in an otherwise resistant mouse strain (Reddy et al., 2004; Zhang et al., 2004). This effect is IL-10-dependent (Zhang et al., 2004). The forkhead/winged helix transcription factor Foxp3 is thought to program the development and function of CD4+CD25+ Tr cells and so far is the most unambiguous marker available to identify naturally occurring Tr cells (Shevach et al., 2006; Zheng et al., 2007). CTLA-4, a co-stimulatory molecule on CD4+ T cells, is also important in the development and function of Tr cells (Tuves et al., 2007). On the other hand, regulatory CD8 T cells can be identified as CD122+ (Endharti et al., 2005; Rifa’i et al., 2004). Our data show that M-CSF + MOG-treated APCs induced increased levels of both CD4+CD25+Foxp3+ and CD8+CD122+ MOG-specific T cells, while CTLA-4 expression was unchanged, indicating the capacity of these APCs to induce CD4 and CD8 Tr cells and the possible involvement of the Foxp3 pathway in induction of CD4+ Tr cells.
Costimulatory signals play an essential role in the activation/differentiation of the immune system (Larson et al., 2006). Overexpression of costimulatory molecules on APCs could activate self-reactive T cells, resulting in autoimmunity (Mitrasinovic et al., 2001). On the other hand, regulatory costimulation signals, such as PD-L1 and PD-L2 on APCs may be required for the generation of IL-10-producing regulatory T cells in response to tolerogenic APCs (Brown et al., 2003; Keir et al., 2007). Although in the present study we show an immunosuppressive cytokine profile of APCs treated with M-CSF and/or autoantigen, the expression of MHC class II and B7 family members CD80, CD86, PD-L1 and PD-L2 was not changed due to the treatment with M-CSF, MOG, or M-CSF + MOG. How M-CSF affects the expression of PD-L1 and PD-L2 on APCs has not yet been reported. Together, our data suggest that the induction of tolerogenic APCs by M-CSF may not be via the regulation of co-stimulatory molecules.
M-CSF is a growth factor for monocyte lineage (Yanai et al., 1990). Recently, an immunoregulatory property of this cytokine has also been suggested. M-CSF is constitutively present in human serum and is greatly elevated in immune suppressive conditions (Bartocci et al, 1986; Ikeno et al., 1996), probably playing a role in maintaining maternal tolerance toward embryos (Piccinni et al., 1997). M-CSF not only has the ability to drive monocyte differentiation into DCs with tolerogenic potential (Li et al., 2005), but also inhibits DC differentiation from CD34+ progenitors by downregulation of CD1a and upregulation of CD14 expression (Menetrier-Caux et al., 1998). Furthermore, M-CSF induces macrophages to constitutively produce low levels of IL-10 and high levels after activation (Smith et al., 1998). Although, in our study APCs treated with M-CSF alone produced fewer proinflammatory cytokines compared to non-treated cells, this effect may not be biologically important. Instead, APCs treated with M-CSF + autoantigen exhibited a more profound tolerogenic APC phenotype, and effectively suppressed autoimmune responses in vitro and in vivo, indicating that treatment with M-CSF alone is not an effective approach in preventing EAE.
The requirement for myelin antigen in inducing tolerogenic APCs has been previously addressed. DCs stimulated with antigen suppressed EAE in an antigen-specific manner (Huang et al., 2000; Xiao et al., 2001). However, APCs stimulated in vitro with autoantigen alone can also enhance autoimmunity when adoptively transferred into animals (Dittel et al., 1999). Use of APCs exposed to an immunoregulatory cytokine and autoantigen can mitigate the risk of enhancing autoimmunity, while leading to disease suppression. MOG-induced EAE was effectively prevented by repetitive administration of TNF-α-treated, MOG-pulsed bone marrow-derived dendritic cells, due to their ability to induce an IL-10-producing CD4+ Tr cell that presumably suppressed disease (Menges et al., 2002). Recently, it has been observed that MBP-pulsed, TGF-β-treated APCs halt the progression of EAE induced with MBP, and that they do so via their induction of CD8+ Tr cells (Faunce et al., 2004). Our work extends these observations by showing that APCs treated with M-CSF + autoantigen, but not M-CSF or autoantigen alone, effectively suppressed clinical EAE. These APCs possess the capacity to induce CD4+ and CD8+ regulatory T cells in vitro and in vivo. Further, APCs pulsed with M-CSF and control antigen OVA failed to protect mice from EAE (Fig. 4C), indicating that the immunoregulatory effect of these tolerogenic APCs is not due to bystander suppression.
In summary, in this report we show that experimentally generated tolerogenic APCs induced regulatory CD4+ and CD8+ T cells that effectively suppressed autoimmunity. Although treatment conditions such as cell dose and regimen of injections would need to be optimized for future clinical use, our results suggest that in vitro-manipulated APCs could potentially be used as a cell-based therapy to halt the progression of autoimmune diseases.
Acknowledgments
This work was supported by grants from the National Institutes of Health, the National Multiple Sclerosis Society, and the Groff Foundation. We would like to thank Katherine Regan for editorial assistance.
Abbreviations
- EAE
experimental autoimmune encephalomyelitis
- MOG
myelin oligodendrocyte glycoprotein
- MS
multiple sclerosis
- APC
antigen presenting cells
- PEC
peritoneal exudate cells
Footnotes
Publisher's Disclaimer: This is a PDF file of an unedited manuscript that has been accepted for publication. As a service to our customers we are providing this early version of the manuscript. The manuscript will undergo copyediting, typesetting, and review of the resulting proof before it is published in its final citable form. Please note that during the production process errors may be discovered which could affect the content, and all legal disclaimers that apply to the journal pertain.
References
- Alard P, Clark SL, Kosiewicz MM. Mechanisms of tolerance induced by TGF beta- treated APC: CD4 regulatory T cells prevent the induction of the immune response possibly through a mechanism involving TGF beta. Eur J Immunol. 2004;34:1021–1030. doi: 10.1002/eji.200324547. [DOI] [PubMed] [Google Scholar]
- Bartocci A, Pollard JW, Stanley ER. Regulation of colony-stimulating factor 1 during pregnancy. J Exp Med. 1986;164:956–961. doi: 10.1084/jem.164.3.956. [DOI] [PMC free article] [PubMed] [Google Scholar]
- Benson JM, Campbell KA, Guan Z, Gienapp IE, Stuckman SS, Forsthuber T, Whitacre CC. T-cell activation and receptor downmodulation precede deletion induced by mucosally administered antigen. J Clin Invest. 2000;106:1031–1038. doi: 10.1172/JCI10738. [DOI] [PMC free article] [PubMed] [Google Scholar]
- Bettelli E, Pagany M, Weiner HL, Linington C, Sobel RA, Kuchroo VK. Myelin oligodendrocyte glycoprotein-specific T cell receptor transgenic mice develop spontaneous autoimmune optic neuritis. J Exp Med. 2003;197:1073–81. doi: 10.1084/jem.20021603. [DOI] [PMC free article] [PubMed] [Google Scholar]
- Brown JA, Dorfman DM, Ma FR, Sullivan EL, Munoz O, Wood CR, Greenfield EA, Freeman GJ. Blockade of programmed death-1 ligands on dendritic cells enhances T cell activation and cytokine production. J Immunol. 2003;170:1257–66. doi: 10.4049/jimmunol.170.3.1257. [DOI] [PubMed] [Google Scholar]
- Calida DM, Constantinescu C, Purev E, Zhang GX, Ventura ES, Lavi E, Rostami A. Cutting edge: C3, a key component of complement activation, is not required for the development of myelin oligodendrocyte glycoprotein peptide-induced experimental autoimmune encephalomyelitis in mice. J Immunol. 2001;166:723–726. doi: 10.4049/jimmunol.166.2.723. [DOI] [PubMed] [Google Scholar]
- de Jong EC, Smits HH, Kapsenberg ML. Dendritic cell-mediated T cell polarization. Springer Semin Immunopathol. 2005;26:289–307. doi: 10.1007/s00281-004-0167-1. [DOI] [PubMed] [Google Scholar]
- Dittel BN, Visintin I, Merchant RM, Janeway CA., Jr Presentation of the self antigen myelin basic protein by dendritic cells leads to experimental autoimmune encephalomyelitis. J Immunol. 1999;163:32–39. [PubMed] [Google Scholar]
- Endharti AT, Rifa’I M, Shi Z, Fukuoka Y, Nakahara Y, Kawamoto Y, Takeda K, Isobe K, Suzuki H. Cutting edge: CD8+CD122+ regulatory T cells produce IL-10 to suppress IFN-gamma production and proliferation of CD8+ T cells. J Immunol. 2005;175:7093–7. doi: 10.4049/jimmunol.175.11.7093. [DOI] [PubMed] [Google Scholar]
- Faunce DE, Terajewicz A, Stein-Streilein J. Cutting Edge: In vitro-generated tolerogenic APC induce CD8+ T regulatory cells that can suppress ongoing experimental autoimmune encephalomyelitis. J Immunol. 2004;172:1991–1995. doi: 10.4049/jimmunol.172.4.1991. [DOI] [PubMed] [Google Scholar]
- Fitzgerald DC, Ciric B, Touil T, Harle H, Grammatikopolou J, Das-Sarma J, Gran B, Zhang GX, Rostami AM. Suppressive effect of IL-27 on encephalitogenic Th17 cells and the effector phase of experimental autoimmune encephalomyelitis (EAE) J Immunol. 2007 doi: 10.4049/jimmunol.179.5.3268. In Press. [DOI] [PubMed] [Google Scholar]
- Hara Y, Okamoto S, Rouse B, Streilein JW. Evidence that peritoneal exudate cells cultured with eye-derived fluids are the proximate antigen-presenting cells in immune deviation of the ocular type. J Immunol. 1993;151:5162–5171. [PubMed] [Google Scholar]
- Hara Y, Caspi RR, Wiggert B, Dorf M, Streilein JW. Analysis of an in vitro-generated signal that induces systemic immune deviation similar to that elicited by antigen injected into the anterior chamber of the eye. J Immunol 1992. 1992;149:1531–1538. [PubMed] [Google Scholar]
- Huang YM, Yang JS, Xu LY, Link H, Xiao BG. Autoantigen-pulsed dendritic cells induce tolerance to experimental allergic encephalomyelitis (EAE) in Lewis rats. Clin Exp Immunol. 2000;122:437–444. doi: 10.1046/j.1365-2249.2000.01398.x. [DOI] [PMC free article] [PubMed] [Google Scholar]
- Ikeno K, Koike K, Fukuromoto T, Shimizu T, Nagatomo M, Komiyama A. Increased macrophage-colony stimulating factor levels in neonates with perinatal complications. Early Hum Dev. 1996;46:229–237. doi: 10.1016/0378-3782(96)01766-5. [DOI] [PubMed] [Google Scholar]
- Kalinski P, Hilkens CM, Wierenga EA, Kapsenberg ML. T-cell priming by type-1 and type-2 polarized dendritic cells: the concept of a third signal. Immunol Today. 1999;20:561–567. doi: 10.1016/s0167-5699(99)01547-9. [DOI] [PubMed] [Google Scholar]
- Kapsenberg ML, Kalinski P. The concept of type 1 and type 2 antigen-presenting cells. Immunol Lett. 1999;69:5–6. doi: 10.1016/s0165-2478(99)00096-6. [DOI] [PubMed] [Google Scholar]
- Kasper LH, Haque A, Haque S. Regulatory mechanisms of the immune system in multiple sclerosis. T regulatory cells: turned on to turn off. J Neurol. 2007;254(Suppl 1):I10–I14. [Google Scholar]
- Keir ME, Francisco LM, Sharpe AH. PD-1 and its ligands in T-cell immunity. Curr Opin Immunol. 2007;19:309–14. doi: 10.1016/j.coi.2007.04.012. [DOI] [PubMed] [Google Scholar]
- Kojima K, Naomoto Y, Hizuta A, Tanaka N, Orita K. Cytokine production suppressive effect by macrophage colony-stimulating factor (M-CSF) Res Commun Mol Pathol Pharmacol. 1996;91:161–172. [PubMed] [Google Scholar]
- Kosiewicz M, Okamoto MS, Miki S, Ksander B, Shimizu BR, Streilein JW. Imposing deviant immunity on the presensitized state. J Immunol. 1994;153:2962–2973. [PubMed] [Google Scholar]
- Kubach J, Becker C, Schmitt E, Steinbrink K, Huter E, Tuettenberg A, Jonuleit H. Dendritic cells: sentinels of immunity and tolerance. Int J Hematol. 2005;81:197–203. doi: 10.1532/IJH97.04165. [DOI] [PubMed] [Google Scholar]
- Larsen CP, Knechtle SJ, Adams A, Pearson T, Kirk AD. A new look at blockade of T-cell costimulation: a therapeutic strategy for long-term maintenance immunosuppression. Am J Transplant. 2006;6:876–883. doi: 10.1111/j.1600-6143.2006.01259.x. [DOI] [PubMed] [Google Scholar]
- Lee HK, Iwasaki A. Innate control of adaptive immunity: dendritic cells and beyond. Semin Immunol. 2007;19:48–55. doi: 10.1016/j.smim.2006.12.001. [DOI] [PubMed] [Google Scholar]
- Li G, Kim YJ, Broxmeyer HE. Macrophage colony-stimulating factor drives cord blood monocyte differentiation into IL-10(high)IL-12absent dendritic cells with tolerogenic potential. J Immunol. 2005;174:4706–4717. doi: 10.4049/jimmunol.174.8.4706. [DOI] [PubMed] [Google Scholar]
- Liang S, Alard P, Zhao Y, Parnell S, Clark SL, Kosiewicz MM. Conversion of CD4+ CD25− cells into CD4+ CD25+ regulatory T cells in vivo requires B7 costimulation, but not the thymus. J Exp Med. 2005;201:127–37. doi: 10.1084/jem.20041201. [DOI] [PMC free article] [PubMed] [Google Scholar]
- Menetrier-Caux C, Montmain G, Dieu MC, Bain C, Favrot MC, Caux C, Blay JY. Inhibition of the differentiation of dendritic cells from CD34+ progenitors by tumor cells: role of interleukin-6 and macrophage colony stimulating factor. Blood. 1998;92:4778–4791. [PubMed] [Google Scholar]
- Menges M, Rossner S, Voigtlander C, Schindler H, Kukutsch NA, Bogdan C, Erb K, Schuler G, Lutz MB. Repetitive injections of dendritic cells matured with tumor necrosis factor induce antigen-specific protection of mice from autoimmunity. J Exp Med. 2002;195:15–21. doi: 10.1084/jem.20011341. [DOI] [PMC free article] [PubMed] [Google Scholar]
- Mitrasinovic OM, Perez GV, Zhao F, Lee YL, Poon C, Murphy GM., Jr Overexpression of macrophage colony stimulating factor Receptor on microglial cells induces an inflammatory response. J Biol Chem. 2001;276:30142–30149. doi: 10.1074/jbc.M104265200. [DOI] [PubMed] [Google Scholar]
- Nishina T, Naomoto Y, Gouchi A, Gunduz M, Shirakawa Y, Nobuhisa T, Motoki T, Kusaka S, Haisa M, Matsuoka J, Nakayama E, Tanaka N. Macrophage colony-stimulating factor inhibits tumor necrosis factor production and prolongs skin graft survival. Transplantation. 2004;77:456–459. doi: 10.1097/01.TP.0000100483.41935.B5. [DOI] [PubMed] [Google Scholar]
- Piccinni MP, Scaletti C, Vultaggio A, Maggi E, Romagnani S. Defective production of LIF, M-CSF and Th2-type cytokines by T cells at fetomaternal interface is associated with pregnancy loss. J Reprod Immunol. 2001;52:35–43. doi: 10.1016/s0165-0378(01)00111-5. [DOI] [PubMed] [Google Scholar]
- Raimondi G, Zanoni I, Citterio S, Ricciardi-Castagnoli P, Granucci F. Induction of peripheral T cell tolerance by antigen-presenting B cells. I. Relevance of antigen presentation persistence. J Immunol. 2006;176:4012–4020. doi: 10.4049/jimmunol.176.7.4012. [DOI] [PubMed] [Google Scholar]
- Reddy J, Illes Z, Zhang X, Encinas J, Pyrdol J, Nicholson L, Sobel RA, Wucherpfennig KW, Kuchroo VK. Myelin proteolipid protein-specific CD4+CD25+ regulatory cells mediate genetic resistance to experimental autoimmune encephalomyelitis. Proc Natl Acad Sci U S A. 101:15434–9. doi: 10.1073/pnas.0404444101. [DOI] [PMC free article] [PubMed] [Google Scholar]
- Rifa’i M, Kawamoto Y, Nakashima I, Suzuki H. Essential roles of CD8+CD122+ regulatory T cells in the maintenance of T cell homeostasis. J Exp Med. 2004;200:1123–34. doi: 10.1084/jem.20040395. [DOI] [PMC free article] [PubMed] [Google Scholar]
- Saalmüller A. New understanding of immunological mechanisms. Vet Microbiol. 2006;117:32–8. doi: 10.1016/j.vetmic.2006.04.007. [DOI] [PubMed] [Google Scholar]
- Shevach EM, DiPaolo RA, Andersson J, Zhao DM, Stephens GL, Thornton AM. The lifestyle of naturally occurring CD4+ CD25+ Foxp3+ regulatory T cells. Immunol Rev. 2006;212:60–73. doi: 10.1111/j.0105-2896.2006.00415.x. [DOI] [PubMed] [Google Scholar]
- Smith W, Feldmann M, Londei M. Human macrophages induced in vitro by macrophage colony-stimulating factor are deficient in IL-12 production. Eur J Immunol. 1998;28:2498–2507. doi: 10.1002/(SICI)1521-4141(199808)28:08<2498::AID-IMMU2498>3.0.CO;2-Q. [DOI] [PubMed] [Google Scholar]
- Sonoda KH, Stein-Streilein J. CD1d on antigen-transporting APC and splenic marginal zone B cells promotes NKT cell-dependent tolerance. Eur J Immunol. 2002;32:848–857. doi: 10.1002/1521-4141(200203)32:3<848::AID-IMMU848>3.0.CO;2-I. [DOI] [PubMed] [Google Scholar]
- Steinbrink K, Wolfl M, Jonuleit H, Knop J, Enk AH. Induction of tolerance by IL-10-treated dendritic cells. J Immunol. 1997;159:4772–4780. [PubMed] [Google Scholar]
- Sutton C, Brereton C, Keogh B, Mills KH, Lavelle EC. A crucial role for interleukin (IL)-1 in the induction of IL-17-producing T cells that mediate autoimmune encephalomyelitis. J Exp Med. 2006;203:1685–91. doi: 10.1084/jem.20060285. [DOI] [PMC free article] [PubMed] [Google Scholar]
- Tuve S, Chen BM, Liu Y, Cheng TL, Touré P, Sow PS, Feng Q, Kiviat N, Strauss R, Ni S, Li ZY, Roffler SR, Lieber A. Combination of tumor site-located CTL-associated antigen-4 blockade and systemic regulatory T-cell depletion induces tumor-destructive immune responses. Cancer Res. 2007;67:5929–39. doi: 10.1158/0008-5472.CAN-06-4296. [DOI] [PubMed] [Google Scholar]
- Unanue ER. Antigen-presenting function of the macrophage. Annu Rev Immunol. 1984;2:395–428. doi: 10.1146/annurev.iy.02.040184.002143. [DOI] [PubMed] [Google Scholar]
- Veldhoen M, Hocking RJ, Flavell RA, Stockinger B. Signals mediated by transforming growth factor-beta initiate autoimmune encephalomyelitis, but chronic inflammation is needed to sustain disease. Nat Immunol. 2006;7:1151–1156. doi: 10.1038/ni1391. [DOI] [PubMed] [Google Scholar]
- Wilbanks GA, Mammolenti M, Streilein JW. Studies on the induction of anterior chamber-associated immune deviation (ACAID). III. Induction of ACAID depends upon intraocular transforming growth factor-β. Eur J Immunol. 1992;22:165–173. doi: 10.1002/eji.1830220125. [DOI] [PubMed] [Google Scholar]
- Xiao BG, Huang YM, Yang JS, Xu LY, Link H. Bone marrow-derived dendritic cells from experimental allergic encephalomyelitis induce immune tolerance to EAE in Lewis rats. Clin Exp Immunol. 2001;125:300–309. doi: 10.1046/j.1365-2249.2001.01573.x. [DOI] [PMC free article] [PubMed] [Google Scholar]
- Yanai N, Yamada M, Motoyoshi K, Yokota H, Yoshida K, Kawashima M, Nishida T, Miura M, Saito M. Effect of human macrophage colony-stimulating factor on granulopoiesis and survival in bone-marrow-transplanted mice. Jpn J Cancer Res. 1990;81:355–362. doi: 10.1111/j.1349-7006.1990.tb02575.x. [DOI] [PMC free article] [PubMed] [Google Scholar]
- Zhang GX, Yu S, Gran B, Li J, Siglienti I, Chen X, Calida D, Ventura E, Kamoun M, Rostami A. Role of IL-12 receptor beta 1 in regulation of T cell response by APC in experimental autoimmune encephalomyelitis. J Immunol. 2003;171:4485–4492. doi: 10.4049/jimmunol.171.9.4485. [DOI] [PubMed] [Google Scholar]
- Zhang X, Koldzic DN, Izikson L, Reddy J, Nazareno RF, Sakaguchi S, Kuchroo VK, Weiner HL. IL-10 is involved in the suppression of experimental autoimmune encephalomyelitis by CD25+CD4+ regulatory T cells. Int Immunol. 2004;16:249–56. doi: 10.1093/intimm/dxh029. [DOI] [PubMed] [Google Scholar]
- Zheng Y, Rudensky AY. Foxp3 in control of the regulatory T cell lineage. Nat Immunol. 2007;8:457–62. doi: 10.1038/ni1455. [DOI] [PubMed] [Google Scholar]


