

Abstract
Protein folding is an exploding area of research in biophysics and physical chemistry. Here, we describe the integration of several techniques, including absorption spectroscopy, fluorescence spectroscopy, and Förster resonance energy transfer (FRET) measurements, to probe important topics in protein folding. Cytochrome c is used as a model protein; comparison of conformational stabilities ( ) measured via two chemical denaturants, urea and guanidinium hydrochloride, illustrate important concepts in protein folding and intermolecular interactions. In addition, the determination of intraprotein distances based upon the FRET pair Trp-59 and the heme group for unfolded states of cytochrome c highlights the evolution of the protein structure under unfolding conditions. Analysis and discussion of these results provide opportunities to gain in-depth understanding of models for protein folding while enhancing students’ skills with optical techniques. Collectively, the combination of optical spectroscopy, rigorous quantitative analysis, and a focus on biophysics illustrates the significance of fundamental research at the growing intersection of chemistry, biology, and physics.
Keywords: See attached keyword list
The study of biological macromolecules has become a major field in physical chemistry research. Numerous spectroscopic techniques, including electronic and vibrational spectroscopy, have been employed to investigate the thermodynamics and structural changes associated with protein folding and unfolding (1). In undergraduate physical chemistry laboratories, students are rarely given the opportunity to utilize a comprehensive set of techniques to study a single problem. Here, we describe a multifaceted approach towards the study of the important biophysical problem of protein folding. Specifically, the combination of absorption spectroscopy, fluorescence spectroscopy, and Förster resonance energy transfer (FRET) techniques provides complementary and in-depth information on the structural evolution and thermodynamics of biomolecules.
FRET is a spectroscopic technique that may be used to determine inter- or intramolecular distances (2,3). It has been applied to study a wide variety of systems to obtain structural information. FRET occurs via long-range dipole-dipole interactions between donor and acceptor molecules, and does not involve emission of a photon. The radiationless energy transfer from an excited-state donor to a ground-state acceptor requires spectral overlap between the emission spectrum of the donor and the absorption spectrum of the acceptor. The efficiency of FRET energy transfer is inversely proportional to the sixth power of the distance between the donor and acceptor. By utilizing this strong distance dependence, structural information about proteins can be obtained for various conformations.
Cytochrome c (cyt c) is an electron transfer protein found in the inner membrane of mitochondria and is a well-studied system for protein folding (4,5). This globular protein consists of a single polypeptide chain and contains one tryptophan residue at position 59 (Trp-59) and a covalently bound heme cofactor. The intrinsic fluorophore, tryptophan, serves as the FRET donor, while the heme cofactor serves as the acceptor. In the native structure of cyt c, Trp-59 is in close proximity to the heme group (Figure 1). When the protein is folded, energy is transferred from the excited tryptophan to the heme group, resulting in quenched tryptophan fluorescence. As the protein unfolds, the distance between the donor and acceptor increases, causing a decreased efficiency of energy transfer and hence, an increase in fluorescence signal.
Figure 1.
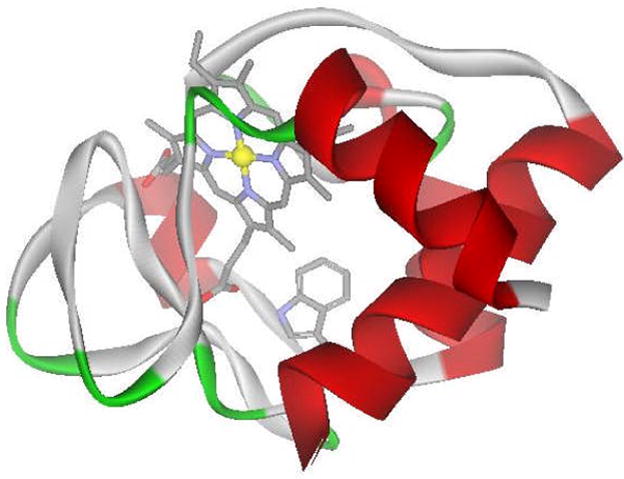
Crystal structure of cyt c (PDB 1HRC). Trp-59 and the heme group are shown.
Individual experiments that focus on FRET (6, 7), protein folding (8, 9), and cyt c (10) have been presented in this journal. However, a comprehensive set of experiments that integrates important topics in biophysics and optical spectroscopy has not been presented. Here, we describe an interdisciplinary and integrated array of experiments that can successfully be completed by a pair of students within four 3-hour periods in an upper-division physical chemistry laboratory course. The main goals of the experiment are:
Understand principles of Förster resonance energy transfer;
Calculate intramolecular distances for partially unfolded protein structures;
Determine the free energy associated with protein unfolding; and
Explore concepts in dynamic protein structures and protein folding.
FRET Theory
According to Förster’s theory on energy transfer (11) the rate of energy transfer kT is related to the lifetime of the donor in the absence of acceptor (τD) and the distance between the donor and acceptor (r) via
| (1) |
The Förster distance, R0, is the critical distance for energy transfer and is defined as the distance at which the efficiency of energy transfer is 50%. Förster distances typically range from 20–60 Å, and can be calculated using the relationship
| (2) |
where κ2 is the orientation factor between the transition dipoles of the donor and acceptor, n is the refractive index of the solvent, ΦD is the quantum yield of the donor in the absence of acceptor, and JDA (λ) is the overlap integral of the donor emission spectrum and the acceptor absorption spectrum. The numerical prefactor depends on the units of the overlap integral, which can be calculated as follows:
| (3) |
Here, JDA is in M−1cm3, λ is in units of cm, FD (λ) is the fluorescence of the donor in absence of acceptor, and εA(λ) is the extinction coefficient in units M−1 cm−1 of the acceptor at λ. FRET energy transfer efficiency, E, is defined by the following relationship:
| (4) |
Efficiency can be experimentally determined using the fluorescence intensities of the donor with and without the acceptor in the form of Equation 5:
| (5) |
where FDA is the fluorescence intensity of the donor in the presence of the acceptor, and FD is the fluorescence intensity of the donor in the absence of the acceptor.
Free Energy of Protein Unfolding
Native tertiary structures of biomolecules can be disrupted by a variety of methods, including changes in temperature and pH, as well as addition of chemical denaturants (12). Two common chemical denaturants, guanidinium hydrochloride and urea, disrupt native protein structures easily. The mechanisms by which these denaturants unfold proteins is an active area of research, and hypotheses regarding their modes of action involve direct solvation of peptide bonds and other hydrophobic regions as well as significant modification of solvent structure (13, 14). Relative concentrations of folded and unfolded proteins under specific denaturing conditions can be determined using optical techniques such as circular dichroism, UV-Vis absorption spectroscopy, and fluorescence spectroscopy. Generation of an unfolding curve in which the fraction of unfolded protein is plotted as a function of denaturant concentration allows for quantitative determination of protein stability (8, 15).
The simplest model of protein unfolding describes a two-state system of folded (F) and unfolded (U) species, F ⇌ U. A previous article in this journal (8) provides a comprehensive description of the concepts and equations related to the protein folding problem. Here, we present relevant equations used in the current study. A theoretical treatment by Schellman (16) (also described by Pace (15) and Jones (8)) approximates a linear perturbation of free energy, , as a function of denaturant concentration wherein extrapolation of this relationship to zero denaturant concentration gives rise to the free energy of unfolding in the absence of denaturant, :
| (6) |
where m reflects the rate of change of the free energy with respect to denaturant concentration and C is the molar concentration of denaturant. The denaturant concentration that gives rise to equal populations of folded and unfolded proteins is referred to as the midpoint concentration, Cm. At Cm, the free energy of unfolding is zero so that
| (7) |
In this two-state model, the fraction of unfolded protein, f, can be described by the following equation:
| (8) |
Experimental data points in an unfolding curve are fit to Equation 8, with f and C as dependent and independent variables, respectively, to yield values for m and Cm. Knowledge of the variables m and Cm then allows for determination of the free energy of unfolding in the absence of denaturant, , using Equation 7.
Experimental Procedure
Reagents and Apparatus
Horse heart cyt c (CAS 9007-43-6) was purchased from Acros Organics (New Jersey), ultra-pure grade urea (CAS 57-13-6) was purchased from MP Biomedicals (Ohio), guanidinium hydrochloride (gdmHCl) (CAS 50-01-1) was purchased from Acros Organics (New Jersey), free donor, n-acetyl-tryptophanamide (NATA) (CAS 2382-79-8), was purchased from Fisher BioReagents (New Jersey), and potassium phosphate monobasic (KH2PO4) (CAS 7778-77-0) and dibasic (K2HPO4) (CAS 7758-11-4) were from Fisher Scientific (Pennsylvania). Five aqueous stock solutions at pH 7.4 were prepared, with amounts indicated in parentheses: (A) 100 mL of 20mM phosphate buffer (0.174 g K2HPO4 and 0.136 g KH2PO4); (B) 50 mL of 10.0M urea (30.0 g urea) + 20mM phosphate buffer (0.087 g K2HPO4 and 0.068 g KH2PO4) solution; (C) 50 mL of 6.0M gdmHCl (28.7 g gdmHCl) + 20mM phosphate buffer (0.087 g K2HPO4 and 0.068 g KH2PO4) solution; (D) 1.2 mL of ~500μM cyt c (0.0075 g cyt c) + 20mM phosphate buffer solution; and (E) 5 mL of ~1mM NATA (0.0012 g NATA) + 20mM phosphate buffer solution. All spectroscopic measurements were acquired in a 1-cm quartz cuvette at 25 °C. Absorption spectra were measured on a UV-Vis Agilent 8453 absorption spectrophotometer. Fluorescence spectra were acquired on a Horiba Jobin Yvon fluorometer, model FL 3–11. Accurate urea and guanidinium hydrochloride concentrations were determined from refractive index values obtained with an Abbe 3L Bausch & Lomb refractometer (17). Data analysis was performed with Igor Pro (Wavemetrics), but could also be performed with Microsoft Excel (see supplementary lab documentation).
Procedure
Sample preparation
Twenty-one cyt c samples (1.5 mL each) with varying concentrations of urea were prepared by mixing the appropriate amounts of solution (D) with solutions (A) and (B) to achieve a final cyt c concentration of ~10μM and urea concentrations of 0.0M to 10.0M in 0.5M increments. An additional thirteen cyt c samples (1.5 mL each) with varying concentrations of gdmHCl were prepared by mixing the appropriate amounts of solution (D) with solutions (A) and (C) to achieve a final cyt c concentration of ~10μM and gdmHCl concentrations of 0.0M to 6.0M in 0.5M increments. Absorption spectra of all thirty-four cyt c solutions were acquired to accurately determine final cyt c concentrations using ε530= 11,200 M−1cm−1; the fully folded protein (0.0M denaturant) also has ε410 = 105,000 M−1cm−1 (18, 19).
Unfolding curves
Fluorescence spectra were measured using an excitation wavelength of 290nm, emission wavelength range of 305–500nm, and entrance and exit slit bandpass of ~5 nm. Fluorescence spectra of stock solutions (A), (B), and (C) were also acquired and subtracted from cyt c fluorescence spectra in order to remove Raman scattering and background fluorescence arising from water, phosphate, and urea/gdmHCl. These resulting background-corrected fluorescence spectra were adjusted for variations in cyt c concentration. After these corrections, the relative fluorescence intensities at the 355 nm emission peak are determined using the signal from fully unfolded protein (10.0M urea or 6.0M gdmHCl) as the maximum intensity, and plotted as a function of denaturant concentration for both urea and gdmHCl. This percentage of maximum fluorescence on the y-axis should reflect the fraction unfolded, f, and hence scale from 0 to 1, with f = 1 at the maximum denaturant concentration. The data are then fit to Equation 8, and free energies of unfolding are determined using Equation 7.
Determination of R0 and intraprotein distances
Solution (E) was diluted 100-fold to achieve a final NATA concentration of ~10 μM; the actual NATA concentration was determined using ε280 = 5630 M−1cm−1 (20). A fluorescence spectrum of this ~10 μM NATA solution which contains the model donor compound in absence of acceptor was acquired. Next, an absorption spectrum of ~5μM cyt c in solution (A) was acquired. Equation 2 along with the constants (2) κ2=2/3, n=1.4, ΦD=0.13 were invoked to calculate the Förster distance for the trp-heme pair. Variation in values of n and ΦD with denaturant concentration results in minimal (<5%) change in the value of R0. Average distances between Trp-59 and the heme group as a function of denaturant concentration were determined via the corrected fluorescence spectra, Equation 4, and Equation 5. For FD, the fluorescence intensity at 355 nm of a NATA solution with the same concentration as the cyt c solution in 10.0M urea should be used.
Results and Discussion
Unfolding curves for cyt c in urea and gdmHCl are shown in Figure 2 along with fits to the data using Equation 8; these results are similar to earlier studies (18, 21). Consistent with other findings that gdmHCl and urea exhibit different potency as denaturants (22), the free energy of unfolding, , measured with gdmHCl is higher (8.1 ± 0.7 kcal/mol) than that measured with urea (7.2 ± 0.3 kcal/mol). These results support the idea that unfolding mechanisms may depend on the chemical properties of the denaturant, and provide opportunities for students to discuss different intermolecular interactions that may dominate. For example, the effect of ionic charge on unfolding is an important factor since gdmHCl is a charged denaturant. In addition to comparison between the two denaturants, the unfolding curves suggest that there is further unfolding of the denatured state, especially in the case of gdmHCl-induced unfolding. This result highlights the limitations of the two-state model and encourages discussion regarding residual structure in nominally unfolded states.
Figure 2.
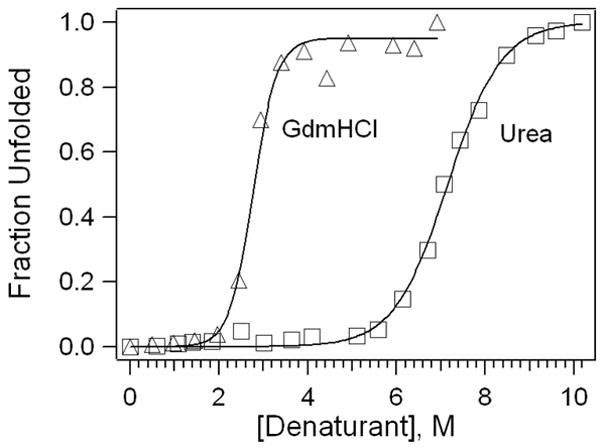
Unfolding curves for cyt c in gdmHCl and urea. Fits to Equation 8 yield m=3.0 kcal M−1 mol−1, Cm=2.7 M (gdmHCl) and m=1.0 kcal M−1 mol−1 and Cm=7.2 M (urea).
Equation 2 and the experimentally measured value for JDA (λ) were used to determine a Förster distance, R0, of ~34 Å. Figure 3 shows the efficiency for energy transfer of cyt c in gdmHCl and urea using Equation 5. The inset (solid curve) shows the theoretical distance-dependence for energy transfer obtained from Equation 4 with R0 = 34 Å. The experimental FRET efficiencies measured for cyt c in urea and gdmHCl (Equation 5) are marked on the theoretical curve inset. Consistent with a previous study, the fully unfolded protein exhibits ~50% fluorescence signal relative to the free model compound NATA, indicating that Trp-59 and the heme group remain in sufficient proximity for energy transfer under denaturing conditions (18). It is clear that there is a strong distance-dependence for energy transfer near the Förster distance. An important question is, over what range of distances is FRET reliable? Based on the decreased sensitivity of energy transfer at very long and short distances as well as the limitations of typical instruments found in undergraduate laboratories, we estimate that distances corresponding to energy transfer efficiencies within 5% and 95% are reliable, which correspond to distances ranging from ~20 to 55 Å in the current experiment.
Figure 3.
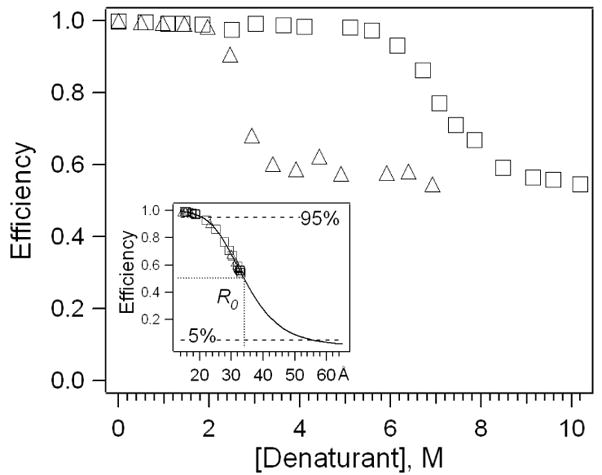
Trp-heme FRET efficiencies in cyt c as a function of gdmHCl (Δ) and urea (□) concentrations. Inset: FRET efficiency (solid curve) with R0 = 34Å. Experimental efficiencies in gdmHCl (Δ) and urea (□) are marked in the inset.
The distance between Trp-59 and the heme group was measured as <20 A and ~33 A for folded and unfolded cyt c, respectively (Figure 4). An important interpretation of Figure 4 is that the distance between Trp-59 and the heme moiety averaged over the ensemble increases as a result of denaturant-induced unfolding. These data from FRET open up the possible interpretation that numerous intermediates with different intramolecular distances coexist at a given denaturant concentration. This model differs fundamentally from the picture based on unfolding curves which assumes a two-state model in which the ensemble is composed of only folded and unfolded populations. This important contrast provides an opportunity for students to consider topics in dynamic protein structures, various models for protein folding/unfolding, and the significance of comprehensive analysis in data interpretation.
Figure 4.
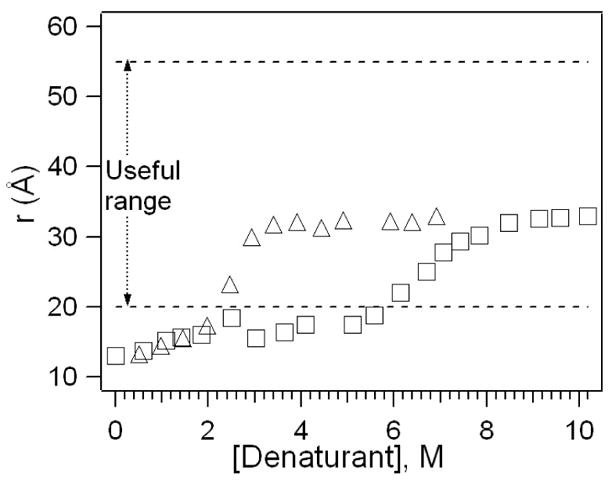
Average distance between Trp-59 and heme in cyt c as a function of gdmHCl (Δ) and urea (□) concentrations.
Interested students are encouraged to study advanced topics, such as kinetics of cyt c folding (23), identification and characterization of folding intermediates (24), and the role of cofactors in protein folding (25). Additional experiments may also be performed to probe the effects of oxidation state on the conformational stability of cyt c (21), determine with alternative probes, such as shift in Soret absorption at ~410 nm, and compare different denaturing mechanisms by generating unfolding curves as a function of temperature, pH, or ionic strength. Overall, there is great potential to expand the current experiment over additional lab days and hence, allow students to gain fundamental insight into topics relevant to physical chemistry, biophysics, and biochemistry.
Hazards
General lab safety practices should be followed; safety glasses, gloves, and lab coat should be worn at all times. Care should be taken when handling proteins in general. While cytochrome c and phosphate buffer are relatively harmless, other proteins and buffers can be potentially hazardous. Urea causes skin irritations; guanidinium hydrochloride causes eye, skin, and respiratory tract irritations. If a denaturant comes in contact with any of these areas, wash with copious amounts of water.
Supplementary Material
Acknowledgments
We thank the students of UCSD Chem105A/B, especially Eric J. Smoll, Jr., who have provided feedback on this experiment, and the following funding agencies that have supported our work: Department of Education Graduate Assistance in Areas of National Need Fellowship to K.M.S., UCSD National Institutes of Health Biophysics Training Grant fellowship to D.E.S., and NSF CAREER Award to J.E.K.
Literature cited
- 1.Wolynes PG, Eaton WA. Physics World. 1999 Sept;:39–44. [Google Scholar]
- 2.Lakowicz JR. Principles of Fluorescence Spectroscopy. 3. Springer; New York: 2006. [Google Scholar]
- 3.Stryer L. Ann Rev Biochem. 1978;47:819–846. doi: 10.1146/annurev.bi.47.070178.004131. [DOI] [PubMed] [Google Scholar]
- 4.Milgrom LR. The Colours of Life. 1. Oxford University Press; Oxford: 1997. [Google Scholar]
- 5.Englander SW, Sosnick TR, Mayne LC, Shtilerman M, Qi PX, et al. Acc Chem Res. 1998;31:737–744. [Google Scholar]
- 6.Hundzinski AM, Anderson BD. J Chem Educ. 1999;76:416–418. [Google Scholar]
- 7.Goodall DM, Roberts DR. J Chem Educ. 1985;62:711–714. [Google Scholar]
- 8.Jones CM. J Chem Educ. 1997;74:1306–1310. [Google Scholar]
- 9.Sykes PA, Shiue H, Walker JR, Bateman RC., Jr J Chem Educ. 1999;76:1283–1284. [Google Scholar]
- 10.Vincent JB, Woski SA. J Chem Educ. 2005;82:1211–1214. [Google Scholar]
- 11.Förster T. Intermolecule energy migration and fluorescence. In: Mielczarek EV, Greenbaum E, Knox RS, editors. Biological Physics. American Institute of Physics; New York: 1993. pp. 148–160. [Google Scholar]
- 12.Dill KA, Shortle D. Annu Rev Biochem. 1991;60:795–825. doi: 10.1146/annurev.bi.60.070191.004051. [DOI] [PubMed] [Google Scholar]
- 13.Soper AK, Castner EW, Luzar A. Biophys Chem. 2003;105:649–666. doi: 10.1016/s0301-4622(03)00095-4. [DOI] [PubMed] [Google Scholar]
- 14.Zhang Z, Zhu Y, Shi Y. Biophys Chem. 2001;89:145–162. doi: 10.1016/s0301-4622(00)00227-1. [DOI] [PubMed] [Google Scholar]
- 15.Pace CN. Methods Enzymol. 1986;131:266–280. doi: 10.1016/0076-6879(86)31045-0. [DOI] [PubMed] [Google Scholar]
- 16.Schellman JA. Biopolymers. 1978;17:1305–1321. doi: 10.1002/bip.1978.360170510. [DOI] [PubMed] [Google Scholar]
- 17.Shirley BA. Urea and guanidine hydrochloride denaturation curves. In: Shirley BA, editor. Protein Stability and Folding. Vol. 40. Human Press Inc.; Totowa: 1995. pp. 177–190. [DOI] [PubMed] [Google Scholar]
- 18.Tsong TY. Biochem. 1976;15:5467–5473. doi: 10.1021/bi00670a007. [DOI] [PubMed] [Google Scholar]
- 19.Eaton WA, Hochstrasser RM. J Chem Phys. 1967;46:2533–2539. doi: 10.1063/1.1841081. [DOI] [PubMed] [Google Scholar]
- 20.Pace CN, Vajdos F, Fee L, Grimsley G, Gray T. Prot Sci. 1995;4:2411–2423. doi: 10.1002/pro.5560041120. [DOI] [PMC free article] [PubMed] [Google Scholar]
- 21.Mines GA, Winkler JR, Gray HB. Spectroscopic Studies of Ferrocytochrome c Folding. In: Solomon E, Hodgson K, editors. Spectroscopic Methods in Bioinorganic Chemistry. Vol. 692. American Chemical Society; Washington, D.C.: 1997. pp. 188–211. [Google Scholar]
- 22.Monera OD, Kay CM, Hodges RS. Prot Sci. 1994;3:1984–1991. doi: 10.1002/pro.5560031110. [DOI] [PMC free article] [PubMed] [Google Scholar]
- 23.Elove GA, Bhuyan A, Roder H. Biochem. 1994;33:6925–6935. doi: 10.1021/bi00188a023. [DOI] [PubMed] [Google Scholar]
- 24.Latypov RF, Cheng H, Roder ND, Zhang J, Roder H. J Mol Biol. 2006;357:1009–1025. doi: 10.1016/j.jmb.2006.01.055. [DOI] [PubMed] [Google Scholar]
- 25.Wittung-Stafshede P. Acc Chem Res. 2002;35:201–208. doi: 10.1021/ar010106e. [DOI] [PubMed] [Google Scholar]
Associated Data
This section collects any data citations, data availability statements, or supplementary materials included in this article.