

Abstract
Summary
The ‘birthweight paradox’ describes the phenomenon whereby birthweight-specific mortality curves cross when stratified on other exposures, most notably cigarette smoking. The paradox has been noted widely in the literature and numerous explanations and corrections have been suggested. Recently, causal diagrams have been used to illustrate the possibility for collider-stratification bias in models adjusting for birthweight. When two variables share a common effect, stratification on the variable representing that effect induces a statistical relation between otherwise independent factors. This bias has been proposed to explain the birthweight paradox.
Causal diagrams may illustrate sources of bias, but are limited to describing qualitative effects. In this paper, we provide causal diagrams that illustrate the birthweight paradox and use a simulation study to quantify the collider-stratification bias under a range of circumstances. Considered circumstances include exposures with and without direct effects on neonatal mortality, as well as with and without indirect effects acting through birthweight on neonatal mortality. The results of these simulations illustrate that when the birthweight-mortality relation is subject to substantial uncontrolled confounding, the bias on estimates of effect adjusted for birthweight may be sufficient to yield opposite causal conclusions, i.e. a factor that poses increased risk appears protective. Effects on stratum-specific birthweight-mortality curves were considered to illustrate the connection between collider-stratification bias and the crossing of the curves. The simulations demonstrate the conditions necessary to give rise to empirical evidence of the paradox.
Keywords: collider-stratification bias, birthweight, directed acyclic graphs, neonatal nortality
Introduction
The birthweight paradox refers to a counter-intuitive observation related to birthweight, neonatal mortality and factors associated with both birthweight and mortality, such as maternal smoking, parity and race, among others; babies that would seem to be at the highest risk (e.g. those of low birthweight and with smoking mothers) appear to do better than those at lower risk (e.g. low birthweight and non-smoking mothers).1-8 Graphically, this is represented as the crossing of birthweight stratum-specific mortality curves, the hallmark of the birthweight paradox.9,10
The interpretation of this observation has long been a subject of debate in the literature.7,8,11-13 In the context of smoking, it has been proposed previously that maternal smoking might somehow modify the risk of low birthweight, although many theories seeking to explain the paradox focus on artifactual, modelling-induced origins.10,14,15 Some have suggested that there is no direct link between birthweight and mortality whatsoever; rather, birthweight has been implied as amarker for some other true link between these factors.16 Recently, directed acyclic graphs (DAG) have been used to illustrate the role of birthweight in the relationship between neonatal mortality and risk factors such as smoking.10 These causal graphs suggest birthweight to be a collider - a variable in a causal system that is a shared effect of more than one cause. In the case of birthweight, one may easily consider it to be affected by multiple factors including genetic, environmental and behavioural factors.17 Well-established rules show that stratification (via adjustment, restriction, or other approach) on a collider can introduce bias to estimates akin to selection bias.10,14 In the context of birthweight, the result of this collider-stratification bias would be to induce an association between factors affecting birthweight that are unconditionally independent, making them appear correlated within strata of the collider. As a result, neonatal mortality risk estimates may be biased (see Rothman et al. for an extended discussion of DAGs and colliders).18
Causal diagrams are useful for identifying sources of bias but provide no quantitative information regarding effects.19-21 In order for collider-stratification bias to provide explanation for empirical evidence, the magnitude of causal effects must be considered. While much has been written about confounding bias, there is limited research evaluating collider-stratification bias in applied research, particularly in the context of perinatal epidemiology. Greenland evaluated collider stratification bias and its magnitude, as well as comparing collider-stratification bias with confounding bias when a variable fits both definitions, as in a ‘bowtie’ causal diagram.22 It was shown theoretically that collider-stratification bias tends to be a less substantial source of bias than confounding, with formulas demonstrating how the bias is influenced by the causal associations of factors in the causal system.22 Importantly, the bias induced by adjustment for a collider can result in estimates with opposite direction from true effects under certain circumstances thereby altering conclusions, not just strength of evidence.
As illustrated in Fig. 1, various causal scenarios can be considered where the issue of the birthweight paradox may serve for evaluation of collider-stratification bias; biologically plausible causal models include birthweight as a collider. Many factors are known to affect birthweight, such as maternal smoking, altitude and infant sex. Other determinants of birthweight include processes with specific risk factors as yet unknown. Given assumptions, collider-stratification bias can be quantified and compared against available data used to demonstrate the paradoxical ‘crossing of the curves’.
Figure 1.
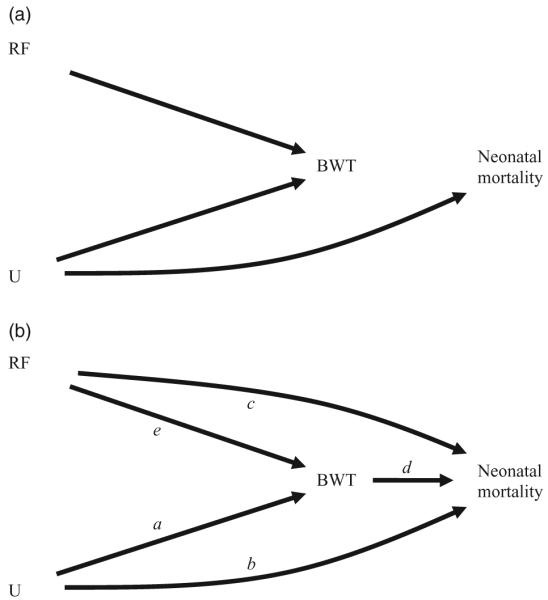
(a-b) Directed acyclic graphs representing possible causal relations among a risk factor (RF), birthweight (BWT), neonatal mortality and potentially unmeasured factor(s) U.
In this paper, we first consider causal diagrams to describe the role of birthweight in assessment of the relation between risk factors like smoking and neonatal mortality, to formalise the question of interest and to introduce the counterfactual notions of total, direct and indirect effects. Subsequently, we describe a simulation study to quantify collider-stratification bias using smoking as the risk factor of interest along with birthweight, and neonatal mortality. Finally, we describe the conditions necessary to give rise to the crossing of curves in the birthweight paradox when stratifying on birthweight.
Causal diagrams and framing the question of interest
Directed acyclic graphs are a type of causal diagram that can be used to represent hypothetical causal networks linking risk factors of interest like smoking, birthweight, and outcomes such as infant mortality. DAGs link variables (nodes) by arrows that represent direct causal effects of one variable on another. They are acyclic because the arrows never point from a given variable to any other variable in its past (i.e. causes precede their effects). An extensive literature has been developed providing rules for drawing inference from causal diagrams.23,24 With arrows signifying causal effects, the absence of an arrow between two variables indicates the absence of a direct effect (i.e. a causal effect not mediated through other variables in the causal diagram) of one variable on the other. DAGs are also useful for illustration of the notions of total, direct and indirect effects, and to consider the effect of these factors on inference.10
For example, diagrams in Fig. 1 display related causal scenarios including a risk factor (RF), birthweight (BWT), neonatal mortality (NM) and unmeasured factors (U), genotypes for example. Here we specify the risk factor as smoking status for illustration. In Fig. 1a smoking affects birthweight but not neonatal mortality, either directly or through birthweight, while U (e.g. proteins involved in placental development) directly affects both birthweight and neonatal mortality. In this scenario birthweight does not directly affect mortality; rather it only appears to do so through its relation with U. Figure 1b retains all the direct effects of 1a (arrows a,b,e) while adding relations between both smoking and birthweight with neonatal mortality (arrows c,d). Birthweight has now become an intermediary for both smoking and U, and each can now be thought of as having an indirect effect that works through birthweight, as well as a direct effect on neonatal mortality.
These diagrams are useful to illustrate the notion of collider-stratification bias that results from conditioning on birthweight. In Fig. 1a-b, low birthweight may be the result of processes related to the risk factor and/or those related to unspecified factors U. Given that an infant is of low birthweight, different causes of that low birthweight have different implications for risk of neonatal death. Those infants with low birthweight resulting from maternal smoking may have a lower risk of mortality than those with low birthweight due to other causes that are also associated with high mortality.
The notion of effect decomposition arises when investigators seek to analytically separate the direct effects of a factor from those acting through intermediates (indirect effect). The limitations of analytical approaches to identify mediators of effect have been described in the literature;25-28 the limitations include questionable required assumptions of monotonicity and consistency of effect. Additionally, the potential exists for analytical biases to arise through adjustment for mediating factors under complex, but common, causal situations. We consider this scenario as applied to questions of risk factors, birthweight and neonatal mortality. When either of the causal diagrams in Fig. 1 hold true, birthweight is not a confounding variable and its inclusion in statistical models has been demonstrated to create collider-stratification bias, the magnitude of which is a function of the strength of relations among each of the factors in the causal diagram.
Simulation study
In order to evaluate the magnitude of the bias that results from collider-stratification, a simulation study was conducted based upon the causal network depicted in Fig. 1b. For simplicity, we consider the diagram to represent a sufficient set (i.e. there is no residual confounding), and all variables to be measured without error. For each scenario, 5000 datasets were generated with 10 000 observations each.
In the simulations, birthweight was modelled as
and neonatal mortality risk as
where the coefficients a, b, c, d and e represent direct effects of one variable on another. Various scenarios were evaluated with a = (0, -200, -400, -600, -1000), b = (0.4, 1.0, 1.6), c = (0, 0.2,0.4), d = (0.0, -0.0005) and e = (0.0, -200, -400); values for a, the effects of U, were chosen to reflect the large potential number of unmeasured confounders of the birthweight-neonatal mortality relation. Values representing effects of the risk factor, e, include estimates seen in prior research17 in a range meant to represent various possible risk factors, including smoking, and relations with birthweight and outcomes. For example, multiple births and infant sex are risk factors with effects on birthweight of different magnitudes that may be considered.
Thus, for each scenario, the true direct effect of the risk factor is equal to ΘD = c, the true indirect effect is ΘI = d*e, and therefore the true total effect is ΘT = c + d*e. A log linear model was used to estimate the direct effects of the risk factor of interest:
Estimates of total effects were taken from the unadjusted log linear model:
Summary statistics were calculated for each scenario and effect estimate: the mean was calculated as the average estimate across all simulations; bias as the difference between the mean and the true parameter value, and mean squared error (MSE) as the sum of the variance and the squared bias of the estimator.
These parameters correspond to three overarching scenarios: a risk factor with no true effects on mortality (c = 0, e and/or d = 0), a risk factor with only direct effects on neonatal mortality (c ≠ 0, e and/or d = 0), and a risk factor with indirect effects on neonatal mortality through birthweight (c unconstrained, e and d ≠ 0). These scenarios cover the roles that risk factors may have in relation to birthweight and neonatal mortality.
In all cases, the effect of adjustment for birthweight on estimates in the presence of unmeasured factors was assessed by comparison of estimates from adjusted and unadjusted models. Additionally, data from these simulations were used to generate birthweight-specific mortality curves stratified on a binary risk factor of interest to illustrate the potential effects of collider-stratifications under the conditions considered.
Results
Quantifying collider-stratification bias
Table 1 shows direct effect estimates, bias and MSE for the circumstance where no indirect effect is present, so that total effects are equal to the direct effect of the risk factor on neonatal mortality. Under this circumstance, birthweight is not a collider in causal diagrams, and adjustment for it does not represent a source of collider-stratification bias. A small bias (0-2%) was present regardless of whether the risk factor affected birthweight, and varied slightly with the effect of U on neonatal mortality. This bias was present in estimates of the direct effect (adjusted model) as well as those of the total effect (unadjusted model).
Table 1.
Bias to log risk ratio estimates and mean square error from simulation data comparing neonatal mortality in those with risk factor = 1 with those with risk factor = 0; risk factor has no indirect effect (i.e. ΘId=0)
| Parameter values |
True effects |
ADJUSTED MODEL |
UNADJUSTED MODEL |
||||
|---|---|---|---|---|---|---|---|
| aa | bb | ΘDc | ΘId | β̂RF|BW-θD | MSE | β̂RF-θT | MSE |
| 0 | -0.0055 | 0.0147 | -0.0055 | 0.0147 | |||
| -200 | 0.2 | -0.0045 | 0.0130 | -0.0045 | 0.0130 | ||
| 0.4 | 0.4 | -0.0001 | 0.0110 | -0.0001 | 0.0110 | ||
| 0 | -0.0028 | 0.0149 | -0.0029 | 0.0149 | |||
| -1000 | 0.2 | -0.0001 | 0.0128 | -0.0002 | 0.0128 | ||
| 0.4 | 0 | -0.0010 | 0.0115 | -0.0010 | 0.0116 | ||
| 0 | -0.0002 | 0.0107 | -0.0002 | 0.0107 | |||
| -200 | 0.2 | -0.0027 | 0.0095 | -0.0026 | 0.0095 | ||
| 1.6 | 0.4 | 0.0003 | 0.0084 | 0.0003 | 0.0084 | ||
| 0 | -0.0048 | 0.0110 | -0.0048 | 0.0111 | |||
| -1000 | 0.2 | -0.0015 | 0.0089 | -0.0019 | 0.0091 | ||
| 0.4 | 0.0003 | 0.0082 | -0.0003 | 0.0083 | |||
a = E[bw|U = 1] - E[bw|U = 0].
b = log (p[NM = 1|U = 1]/p[NM = 1|U = 0]).
c ≡ ΘD = log (p[NM=1|RF=1]/p[NM=1|RF=0])=0.
ΘI, the indirect effect of RF=d * e=0.
In Table 2, the importance of the effect of the risk factor on birthweight to bias is illustrated. Estimates under the circumstance of a true direct effect of the risk factor on neonatal mortality while varying the components of the indirect effect (i.e. the relationship between risk factor and birthweight, and that of birthweight and neonatal mortality) are shown. As previously, an unmeasured confounder of the birthweight-mortality relation, U, is present as well. When the risk factor affects birthweights (i.e. parameter e has non-zero value), birthweight is a collider, andestimates from birthweight-adjusted models are accordingly affected by collider-stratification bias. Even when birthweight had no impact on neonatal mortality (d =-0.0005, top half of table), bias was observed in the adjusted model in the circumstance where birthweight was a collider; however, bias to birthweight-adjusted estimates was much greater when increasing birthweight resulted in decreased risk of mortality (d = 0, bottom half of table). For a binary risk factor that has no effect on birthweight (e = 0) with true relative risk (RR) of 1.22, birthweight is not a collider and the RR was estimated as 1.21 by both the birthweight-adjusted and unadjusted models. When the risk factor has an effect on birthweight, collider-stratification bias occurs. When an average decrease in birthweight of 200 g, (e =-200) is added to the risk factors with true RR of 1.22, models adjusting for birthweight yielded an estimate of 1.03, a bias of -87%. Under these same settings, the RR estimate from the unadjusted model was 1.34 - nearly equal to the true total effect of 1.35 and a bias of less than 1%.
Table 2.
Log risk ratio estimates and mean square errors from simulation data comparing neonatal mortality in those with risk factor = 1 with those with risk factor = 0; collider-stratification bias with the effect of U on birthweight fixed at -600 g
| Parameter values |
True effects |
Estimates - ADJUSTED MODELa |
Estimates - UNADJUSTED MODELb |
||||||||
|---|---|---|---|---|---|---|---|---|---|---|---|
| bc | de | ef | ΘIg | ΘDd | ΘTh | β̂RF|BW | β̂RF|BW-θD | MSE | β̂RF | β̂RF-θT | MSE |
| 0 | 0.2 | 0.2 | 0.200 | 0.000 | 0.013 | 0.200 | 0.000 | 0.013 | |||
| 0.4 | -200 | 0.174 | -0.026 | 0.013 | 0.201 | 0.001 | 0.012 | ||||
| 0 | 0.4 | 0.4 | 0.400 | 0.000 | 0.011 | 0.400 | 0.000 | 0.011 | |||
| 0 | -200 | 0 | 0.372 | -0.028 | 0.013 | 0.398 | -0.002 | 0.011 | |||
| 0 | 0.2 | 0.2 | 0.199 | -0.001 | 0.009 | 0.199 | -0.001 | 0.009 | |||
| 1.6 | -200 | 0.043 | -0.157 | 0.035 | 0.198 | -0.002 | 0.010 | ||||
| 0 | 0.4 | 0.4 | 0.399 | -0.001 | 0.008 | 0.398 | -0.002 | 0.008 | |||
| -200 | 0.246 | -0.154 | 0.032 | 0.401 | 0.001 | 0.008 | |||||
| 0 | 0 | 0.2 | 0.2 | 0.189 | -0.011 | 0.072 | 0.189 | -0.011 | 0.072 | ||
| 0.4 | -200 | 0.1 | 0.2 | 0.3 | 0.162 | -0.038 | 0.074 | 0.292 | -0.008 | 0.070 | |
| 0 | 0 | 0.4 | 0.4 | 0.394 | -0.006 | 0.065 | 0.393 | -0.007 | 0.065 | ||
| -0.0005 | -200 | 0.1 | 0.4 | 0.5 | 0.369 | -0.031 | 0.065 | 0.500 | 0.000 | 0.061 | |
| 0 | 0 | 0.2 | 0.2 | 0.192 | -0.008 | 0.051 | 0.191 | -0.009 | 0.051 | ||
| 1.6 | -200 | 0.1 | 0.2 | 0.3 | 0.026 | -0.174 | 0.079 | 0.294 | -0.006 | 0.047 | |
| 0 | 0 | 0.4 | 0.4 | 0.396 | -0.004 | 0.043 | 0.396 | -0.004 | 0.044 | ||
| -200 | 0.1 | 0.4 | 0.5 | 0.227 | -0.173 | 0.074 | 0.496 | -0.004 | 0.042 | ||
Adjusted model includes birthweight (BW) and risk factor (RF) as independent variables.
Unadjusted model includes only risk factor (RF) as an independent variable.
b = log (p[NM = 1|U = 1]/p[NM = 1|U = 0]).
c ≡ ΘD = log (p[NM=1|RF=1]/p[NM=1|RF=0]).
d = log (p[NM = 1|bw = k + 1]/p[NM = 1|bw = k]).
e = E[bw|RF = 1] - E[bw|RF = 0] = -200 g.
ΘI: the indirect effect of RF=d * e.
ΘT: the total effect of RF=c+(d * e).
Table 3 shows the factors that influence bias when birthweight is a collider, and includes the estimated coefficients, bias and MSE. These results provide further emphasis on the importance of the relationship between risk factor and birthweight, in combination with the degree of confounding of the birthweight-mortality relation. For the results shown in Table 3, effects of factor U on mean birthweight were fixed to be a decrease of 600 g, and risk factor as a decrease in mean birthweight of 200 g. In this setting, even when the risk factor has no direct (c = 0) or even indirect (d = 0) effect on neonatal mortality, bias was observed to the direct effects (i.e. birthweight-adjusted) estimates that was in some cases quite substantial. Under conditions of the strongest confounding of the birthweight-mortality by U, a null direct effect was estimated to be as low as a 27% reduction in risk(RR = 0.73). With birthweight as a collider, bias was observed to vary little within levels of parameter b, the effect of U on risk of neonatal mortality; bias was most influenced by the effect of U on birthweight (parameter a), the effect of U on neonatal mortality (parameter b) and the effect of the risk factor on birthweight (parameter e). Conversely, estimates of the total effect (i.e. unadjusted) were minimally biased.
Table 3.
Estimated log risk ratio for neonatal mortality due to RF and mean square error under varying true direct and indirect effects of RF on neonatal mortality, and varying direct effects of U on neonatal mortality; the effect of RF on birthweight is fixed at -200 g and the effect of U on birthweight is fixed at -600 g
| Parameter values |
True effects |
Estimates - ADJUSTED MODELa |
Estimates - UNADJUSTED MODELb |
||||||||
|---|---|---|---|---|---|---|---|---|---|---|---|
| bc | dd | ee | ΘIf | ΘDg | ΘTh | β̂RF|BW | β̂RF|BW-θD | MSE | β̂RF | β̂RF-θT | MSE |
| 0 | 0 | 0 | 0 | -0.054 | -0.054 | 0.020 | -0.001 | -0.001 | 0.015 | ||
| 0.2 | 0 | 0.2 | 0.2 | 0 | 0.148 | -0.052 | 0.018 | 0.200 | 0.000 | 0.013 | |
| 0.4 | 0.4 | 0.4 | 0.4 | 0 | 0.347 | -0.053 | 0.016 | 0.400 | 0.000 | 0.011 | |
| 0 | 0.2 | 0 | 0.2 | -0.069 | -0.069 | 0.091 | 0.193 | -0.007 | 0.072 | ||
| 0.2 | -0.0005 | 0.4 | 0.2 | 0.2 | 0.129 | -0.071 | 0.079 | 0.388 | -0.012 | 0.064 | |
| 0.4 | 0.6 | 0.4 | 0.2 | 0.334 | -0.066 | 0.069 | 0.594 | -0.006 | 0.054 | ||
| 0 | 0 | 0 | 0 | -0.314 | -0.314 | 0.111 | -0.004 | -0.004 | 0.011 | ||
| 0.2 | 0 | 0.2 | 0.2 | 0 | -0.111 | -0.311 | 0.108 | 0.199 | -0.001 | 0.009 | |
| 1.6 | 0.4 | 0.4 | 0.4 | 0 | 0.089 | -0.311 | 0.107 | 0.399 | -0.001 | 0.008 | |
| 0 | 0.2 | 0 | 0.2 | -0.350 | -0.350 | 0.183 | 0.190 | -0.010 | 0.052 | ||
| 0.2 | -0.0005 | 0.4 | 0.2 | 0.2 | -0.145 | -0.345 | 0.171 | 0.391 | -0.009 | 0.044 | |
| 0.4 | 0.6 | 0.4 | 0.2 | 0.060 | -0.340 | 0.163 | 0.598 | -0.002 | 0.039 | ||
Adjusted model includes birthweight (BW) and risk factor (RF) as independent variables.
Unadjusted model includes only RF as an independent variable.
b = log (p[NM = 1|U = 1]/p[NM = 1|U = 0]).
d = log (p[NM = 1|bw = k + 1]/p[NM = 1|bw = k]).
e = E[bw|RF = 1] - E[bw|RF = 0] = -200 g.
ΘI: the indirect effect of RF=d * e.
c ≡ ΘD=log (p[NM=1|RF=1]/p[NM=1|RF=0]).
ΘT: the total effect of RF=c+(d * e).
Effect of collider-stratification on mortality curves and the birthweight paradox
Figure 2 illustrates the manifestation of collider-stratification bias on mortality curves, and represents an explanation for the crossing of the curves. In each of the four panels, the relationships among a risk factor of interest, birthweight, factor U and neonatal mortality were varied to show their impact on the curves. In panel A, parameters were set as follows: presence of U reduces birthweight by 1000 g and directly increases risk of neonatal mortality with RR = 1.5; the risk factor reduces birthweight by 400 g and directly increases risk of neonatal mortality with RR = 1.8; increasing birthweight decreases risk of neonatal mortality by 5% per 100 g change from a baseline of 3000 g (parameter e =-0.0005). In panel A, infants of mothers with the risk factor have higher mortality than those of mothers without the risk factor at all birthweights.
Figure 2.

Effect of a risk factor on mortality as a function of birthweight. Mortality curves as a function of: the effects of an unknown factor U on birthweight (parameter a) and neonatal mortality risk (parameter b); the effects of a risk factor of interest on birthweight (parameter e) and neonatal mortality (parameter c); and the effect of birthweight on neonatal mortality (parameter d).
Panel A: a =-1000, b = 0.4, c = 0.6, d =-0.0005, e =-400. Panel B: a =-500, b = 0.8, c = 0.2, d =-0.0005, e =-600. PanelC:a =-500, b = 1.2, c = 0.4, d =-0.0005, e =-400. Panel D: a =-500, b = 1.6, c = 0.2, d = 0, e =-600. Control of the magnitude of the collider-stratification bias through these parameters allows for reversal of effect (higher risk for those with the risk factor in Panel A, higher risk for those without the risk factor in Panel D) or for the crossing of the curves at 2000 g in Panel C.
In panel B, the mortality curves are seen to completely overlap; this results when the risk factor reduces birthweight by 600 g and directly increases risk of neonatal mortality with RR = 1.2; U causes a decrease in birthweight of 500 g and increases risk of neonatal mortality with RR = 2.2. The curves for those with and without the risk factor are observed to cross in panel C; in this panel, U causes an average decrease in birthweight of 500 g, the risk factor causes a decrease in birthweight of 400 g, and other parameters were unchanged from those of panel B. Panel D illustrates a reversal of the circumstance in panel A. When U causes a decrease in birthweight by 500 g and a RR for neonatal death of 3.3, the risk factor causes a decrease in birthweight of 600 g and a RR for neonatal death of 1.2, and birthweight itself has no direct effect on neonatal mortality; infants of mothers with the risk factor have lower mortality at all birthweights compared with infants of mothers without the risk factor.
Conclusions
The ‘birthweight paradox’ has perplexed epidemiologists for some time and numerous investigators have discussed explanations and solutions to the issue.7,8,11-13 The paradox has raised questions regarding the significance of birthweight in questions of perinatal outcomes, and the proper handling of birthweight in statistical models. In this paper, we have demonstrated that adjustment for birthweight in the presence of unmeasured factors that affect both birthweight and neonatal mortality not only results in bias, but that bias can change the direction of estimates and may be of sufficient magnitude to result in the crossing of the birthweight mortality curves - the hallmark of the birthweight paradox.
The notion of bias introduced through statistical adjustment for a collider - known as collider-stratification bias - has been discussed generally in the literature as well as in the context of perinatal epidemiology.22 Causal diagrams and the well-developed rules for their use have been shown to have particular utility for illustrating this source of bias.29 For risk factors that have a direct effect on perinatal outcomes as well as those mediated through an effect on birthweight, inclusion of birthweight in regression models will lead to bias due to other factors that affect birthweight and perinatal outcomes. Adjustment for birthweight, the mediating factor, causes a statistical association between the factor of interest and any unmeasured factor also causal of birthweight - factors that are marginally independent. This situation has been shown to apply to the scenario of the birthweight paradox.10 Beyond issues with monotonicity and consistency of effect, this scenario has been discussed as one of the potential shortcomings of adjusting for mediating variables for effect decomposition.25-28
Nevertheless, the question of the potential magnitude of collider-stratification bias has received limited attention. Previous work suggests that collider-stratification bias tends not to be large, except in the presence of strong confounding factors.22 In our study, we observed small biases when the unmeasured confounder of the birthweight-mortality was weakly confounding. Conversely, we observed large biases to regression parameter estimates when adjusting for birthweight when strong confounding of the relation between birthweight and neonatal mortality exists; in some settings, protective effects were observed for risk factors with a true relative risk of 1.5. Our results demonstrate that the largest determinants of bias that occurs due to adjustment for birthweight are the relationships of the unmeasured factors with birthweight and outcomes, so long as the risk factor has any affect on birthweight making it a collider. This remains true regardless of the strength of the effect of the risk factor on outcomes. We focused on smoking as the risk factor and a 200 g decrease in birthweight, but simulated a range of effects on birthweight to reflect other possible risk factors with varying effects. Thus, these findings are relevant to investigation of other risk factors. The effect on mortality curves shown here apply to other risk factors for which birthweight is a collider.
Controversy exists as to the causal role of birthweight in neonatal mortality;2 however, it is likely to be subject to substantial confounding.15,30 A wide array of factors has been postulated that may affect both birthweight and, independent of birthweight, neonatal mortality, including genetic, environmental, or other exposures. Taken together, the net confounding effect may be substantial. In order to address the possible range of confounding that may exist, our simulations included factors with varying effects on birthweight and on outcomes. We note that similar results may be found when gestational age at delivery is used in a similar fashion to birthweight as described herein. To some extent, this will occur due to the correlation between gestational age at delivery and birthweight. This may also be manifest when risk factors act on the timing of birth directly rather than on birthweight.31 Regardless, these results will apply whenever variables fit the DAGs used for this evaluation.
The observation of substantial analytical bias resulting from adjustment for birthweight suggests a caution to investigators. As shown here, the bias from collider-stratification can be substantial. Other reasons for caution are relevant as well. As previously mentioned, strong assumptions regarding monotonicity of effect and absence of effect modification are necessary to use adjustment for effect decomposition.25-28 Even when these assumptions are met and there are no uncontrolled confounders of the birthweight-neonatal mortality relationship, birthweight adjustment may be problematic. If birthweight is only a proxy for other variables causally related (e.g. fetal development or timing issues like gestational age at delivery), inclusion in regression models of neonatal mortality comprises overadjustment.32
It is not uncommon practice to adjust for an intermediate variable (e.g. birthweight) when estimating the effect of a risk factor on an outcome (e.g. smoking on neonatal mortality). In this paper, we have used the example of the birthweight paradox to evaluate the bias that may result from such adjustment. This bias has the potential to substantially affect findings and conclusions, such as for the crossing curves of the birthweight paradox. With this understanding, we have attempted to show the effects of statistical adjustment-induced bias when stratifying or standardising on an intermediate variable and through this logic, unravel the birthweight paradox.
Acknowledgements
Brian Whitcomb, Neil Perkins and Enrique Schisterman are supported by the Intramural Research Program of the Eunice Kennedy Shriver National Institute of Child Health and Human Development, National Institutes of Health. Robert Platt is supported by a Chercheur-boursier award, and by core support to the Montreal Children’s Hospital Research Institute, from the Fonds de la Recherche en Santé du Quebec. The authors would like to thank Drs Miguel Hernan and Sonia Hernandez-Diaz for their helpful suggestions on a previous version of this paper and are grateful to the editor and referees for their insightful comments.
References
- 1.Wilcox AJ. Commentary: on the paradoxes of birthweight. International Journal of Epidemiology. 2003;32:632–633. doi: 10.1093/ije/dyg193. [DOI] [PubMed] [Google Scholar]
- 2.Wilcox AJ. On the importance - and the unimportance - of birthweight. International Journal of Epidemiology. 2001;30:1233–1241. doi: 10.1093/ije/30.6.1233. [DOI] [PubMed] [Google Scholar]
- 3.Wilcox AJ, Russell IT. Birthweight and perinatal mortality: III. Towards a new method of analysis. International Journal of Epidemiology. 1986;15:188–196. doi: 10.1093/ije/15.2.188. [DOI] [PubMed] [Google Scholar]
- 4.Wilcox AJ, Russell IT. Perinatal mortality: standardizing for birthweight is biased. American Journal of Epidemiology. 1983;118:857–864. doi: 10.1093/oxfordjournals.aje.a113704. [DOI] [PubMed] [Google Scholar]
- 5.Wilcox AJ, Russell IT. Birthweight and perinatal mortality: II. On weight-specific mortality. International Journal of Epidemiology. 1983;12:319–325. doi: 10.1093/ije/12.3.319. [DOI] [PubMed] [Google Scholar]
- 6.Wilcox AJ, Russell IT. Birthweight and perinatal mortality: I. On the frequency distribution of birthweight. International Journal of Epidemiology. 1983;12:314–318. doi: 10.1093/ije/12.3.314. [DOI] [PubMed] [Google Scholar]
- 7.Yerushalmy J. The relationship of parents’ cigarette smoking to the outcome of pregnancy - implications as to the problem of inferring causation from observed associations. American Journal of Epidemiology. 1971;93:443–456. doi: 10.1093/oxfordjournals.aje.a121278. [DOI] [PubMed] [Google Scholar]
- 8.Klebanoff MA, Schoendorf KC. Invited commentary: what’s so bad about curves crossing anyway? American Journal of Epidemiology. 2004;160:211–212. doi: 10.1093/aje/kwh203. [DOI] [PubMed] [Google Scholar]
- 9.Ananth CV, Wilcox AJ. Placental abruption and perinatal mortality in the United States. American Journal of Epidemiology. 2001;153:332–337. doi: 10.1093/aje/153.4.332. [DOI] [PubMed] [Google Scholar]
- 10.Hernandez-Diaz S, Schisterman EF, Hernan MA. The birthweight ‘paradox’ uncovered? American Journal of Epidemiology. 2006;164:1115–1120. doi: 10.1093/aje/kwj275. [DOI] [PubMed] [Google Scholar]
- 11.Platt RW, Joseph KS, Ananth CV, Grondines J, Abrahamowicz M, Kramer MS. A proportional hazards model with time-dependent covariates and time-varying effects for analysis of fetal and infant death. American Journal of Epidemiology. 2004;160:199–206. doi: 10.1093/aje/kwh201. [DOI] [PubMed] [Google Scholar]
- 12.Joseph KS. Theory of obstetrics: the fetuses-at-risk approach as a causal paradigm. Journal of Obstetrics and Gynaecology Canada. 2004;26:953–960. doi: 10.1016/s1701-2163(16)30414-5. [DOI] [PubMed] [Google Scholar]
- 13.Hertz-Picciotto I. Is it time to abandon adjustment for birthweight in studies of infant mortality? Paediatric and Perinatal Epidemiology. 2003;17:114–116. doi: 10.1046/j.1365-3016.2003.00483.x. [DOI] [PubMed] [Google Scholar]
- 14.Hernandez-Diaz S, Wilcox AJ, Schisterman EF, Hernán MA. From causal diagrams to birthweight-specific curves of infant mortality. European Journal of Epidemiology. 2008;23:163–166. doi: 10.1007/s10654-007-9220-4. [DOI] [PMC free article] [PubMed] [Google Scholar]
- 15.Schisterman EF, Hernandez-Diaz S. Invited commentary: simple models for a complicated reality. American Journal of Epidemiology. 2006;164:312–314. doi: 10.1093/aje/kwj238. [DOI] [PubMed] [Google Scholar]
- 16.Wilcox AJ. Invited commentary: the perils of birthweight - a lesson from directed acyclic graphs. American Journal of Epidemiology. 2006;164:1121–1123. doi: 10.1093/aje/kwj276. [DOI] [PubMed] [Google Scholar]
- 17.Kramer MS. Determinants of low birthweight: methodological assessment and meta-analysis. Bulletin of the World Health Organization. 1987;65:663–737. [PMC free article] [PubMed] [Google Scholar]
- 18.Glymour MM, Greenland S. Causal diagrams. In: Rothman KJ, Greenland S, Lash TL, editors. Modern Epidemiology. 3rd edn. Lippincott Williams & Wilkins; Philadelphia, PA: 2008. [Google Scholar]
- 19.Hernán MA, Hernández-Díaz S, Werler MM, MitcheIl AA. Causal knowledge as a prerequisite for confounding evaluation: an application to birth defects epidemiology. American Journal of Epidemiology. 2002;155:176–184. doi: 10.1093/aje/155.2.176. [DOI] [PubMed] [Google Scholar]
- 20.Hernán MA, Hernández-Diaz S, Robins JM. A structural approach to selection bias. Epidemiology. 2004;15:615–625. doi: 10.1097/01.ede.0000135174.63482.43. [DOI] [PubMed] [Google Scholar]
- 21.Schisterman EF, Whitcomb BW, Louis GM, Louis TA. Lipid adjustment in the analysis of environmental contaminants and human health risks. Environmental Health Perspectives. 2005;113:853–857. doi: 10.1289/ehp.7640. [DOI] [PMC free article] [PubMed] [Google Scholar]
- 22.Greenland S. Quantifying biases in causal models: classical confounding vs. collider-stratification bias. Epidemiology. 2003;14:300–306. [PubMed] [Google Scholar]
- 23.Greenland S, Pearl J, Robins JM. Causal diagrams for epidemiologic research. Epidemiology. 1999;10:37–48. [PubMed] [Google Scholar]
- 24.Pearl J. Causal inference from indirect experiments. Artificial Intelligence in Medicine. 1995;7:561–582. doi: 10.1016/0933-3657(95)00027-3. [DOI] [PubMed] [Google Scholar]
- 25.Kaufman JS, Maclehose RF, Kaufman S. A further critique of the analytic strategy of adjusting for covariates to identify biologic mediation. Epidemiologic Perspectives and Innovations. 2004;1:4. doi: 10.1186/1742-5573-1-4. [DOI] [PMC free article] [PubMed] [Google Scholar]
- 26.Kaufman S, Kaufman JS, MacLehose RF, Greenland S, Poole C. Improved estimation of controlled direct effects in the presence of unmeasured confounding of intermediate variables. Statistics in Medicine. 2005;24:1683–1702. doi: 10.1002/sim.2057. [DOI] [PubMed] [Google Scholar]
- 27.Robins JM, Greenland S. Identifiability and exchangeability for direct and indirect effects. Epidemiology. 1992;3:143–155. doi: 10.1097/00001648-199203000-00013. [DOI] [PubMed] [Google Scholar]
- 28.Cole SR, Hernán MA. Fallibility in estimating direct effects. International Journal of Epidemiology. 2002;31:163–165. doi: 10.1093/ije/31.1.163. [DOI] [PubMed] [Google Scholar]
- 29.Pearl J. Causal diagrams for empirical research. Biometrika. 1995;82:669–710. [Google Scholar]
- 30.Basso O, Wilcox AJ, Weinberg CR. Birthweight and mortality: causality or confounding? American Journal of Epidemiology. 2006;164:303–311. doi: 10.1093/aje/kwj237. [DOI] [PubMed] [Google Scholar]
- 31.Whitcomb BW, Schisterman EF, Louis GM. Gestational age and gestational age-at-delivery: cause, effect, or time-scale? Human Reproduction. 2007;22:3267. doi: 10.1093/humrep/dem332. [DOI] [PubMed] [Google Scholar]
- 32.Schisterman EF, Cole SR, Platt RW. Overadjustment bias and unnecessary adjustment in epidemiologic studies. Epidemiology. 2009;20:488–495. doi: 10.1097/EDE.0b013e3181a819a1. [DOI] [PMC free article] [PubMed] [Google Scholar]