

Abstract
Atoh1 is a basic helix–loop–helix transcription factor necessary for the specification of inner ear hair cells and central auditory system neurons derived from the rhombic lip. We used the Cre–loxP system and two Cre-driver lines (Egr2Cre and Hoxb1Cre) to delete Atoh1 from different regions of the cochlear nucleus (CN) and accessory auditory nuclei (AAN). Adult Atoh1-conditional knock-out mice (Atoh1CKO) are behaviorally deaf, have diminished auditory brainstem evoked responses, and have disrupted CN and AAN morphology and connectivity. In addition, Egr2; Atoh1CKO mice lose spiral ganglion neurons in the cochlea and AAN neurons during the first 3 d of life, revealing a novel critical period in the development of these neurons. These new mouse models of predominantly central deafness illuminate the importance of the CN for support of a subset of peripheral and central auditory neurons.
Introduction
Deafness is one of the most common sensory abnormalities in humans, affecting an estimated 16.1% (29 million people) of the United States population (Agrawal et al., 2008). The pathology leading to deafness can occur in the PNS and/or CNS. Peripheral hearing impairment comprises the majority of cases and arises from gross cochlear malformations, dysfunction of cochlear hair cells, which detect auditory stimuli and transmit the signal to spiral ganglion neurons (SGNs), dysfunction of the constant ionic current flow within the cochlea necessary for normal hair cell transduction, and/or dysfunction of the auditory nerve, which contains SGN axons and relays the auditory signal to the brainstem cochlear nucleus (CN). Central hearing impairment arises from disruption of the central auditory pathways, which comprises two parts. The main pathway for sound perception runs from the CN through the lateral lemniscus to the nuclei of the inferior colliculus, which in turn relay auditory information to the medial geniculate bodies of the thalamus and on to the temporal lobes. The other pathway travels from the CN through the trapezoid body to the accessory auditory nuclei (AAN) of the brainstem, which comprise the superior olivary complex (SOC) and the nuclei of the trapezoid body (NTB). These nuclei are thought to function in the localization of the temporal and spatial origins of sounds (Willott, 2001). The etiologies of primary central deafness are varied; examples include brainstem malformations, environmental causes (such as fetal alcohol syndrome), dementia, CNS infection, stroke, and trauma (Griffiths, 2002). Unfortunately, the pathogenesis of deafness caused by central defects is poorly understood, in part because of the absence of genetic animal models that selectively affect these components of the auditory pathway.
Atoh1, or Math1, is a basic helix–loop–helix transcription factor important for the development of cells in the peripheral and central portions of the auditory system. In the peripheral auditory system, Atoh1 is both necessary and sufficient to direct the differentiation and maintenance of hair cells of the cochlea (Bermingham et al., 1999). In the CNS, Atoh1 is necessary for the specification of populations of neurons in the nuclei of the dorsal lateral lemniscus and CN, which derive mostly from the Atoh1-expressing dorsal region of the developing embryonic hindbrain known as the rhombic lip (Akazawa et al., 1995; Ben-Arie et al., 1996; Wang et al., 2005). We hypothesized that deletion of Atoh1 exclusively in regions of the developing CNS would create an excellent model of central deafness and would provide insight regarding the connectivity and maintenance of the central pathways.
To test our hypothesis, we used knowledge of the spatial embryonic origins of the CN (Marín and Puelles, 1995; Cambronero and Puelles, 2000; Cramer et al., 2000; Farago et al., 2006) to design an experimental paradigm using Cre–loxP technology to specifically ablate expression of Atoh1 in areas of the murine rhombic lip known to contribute neurons to the developing CN. We demonstrate that loss of Atoh1 expression in these hindbrain regions results in primary loss of neurons from the CN and AAN. This neuronal loss causes secondary disruption of both the peripheral and central auditory systems, possibly attributable to loss of trophic support for these neuronal populations.
Materials and Methods
Mice and mating paradigms.
The generation of Atoh1CreER-T2, Atoh1flox, Atoh1LacZ, Egr2Cre, Hoxb1Cre, and ROSAR26R mice were described previously (Ben-Arie et al., 1996; Soriano, 1999; Voiculescu et al., 2000; Arenkiel et al., 2003; Machold and Fishell, 2005; Shroyer et al., 2007). All animals used for these experiments were maintained on mixed genetic backgrounds except for the Atoh1LacZ and ROSAR26R mice, which are congenic on the C57BL/6J strain background.
Atoh1 conditional knock-out (Atoh1CKO) mice were generated by first crossing either Egr2Cre mice or Hoxb1Cre mice with Atoh1LacZ mice to generate Egr2 Cre/+; Atoh1 LacZ/+ and Hoxb1 Cre/+; Atoh1 LacZ/+ double transgenic animals. These animals were mated with Atoh1flox/flox mice to generate triple transgenic mice of four genotypes: Cre +/+; Atoh1 +/flox, Cre Cre/+; Atoh1 +/flox, Cre +/+; Atoh1LacZ/flox, and Cre Cre/+; Atoh1LacZ/flox. Only animals with Egr2Cre and Atoh1LacZ or Hoxb1Cre and Atoh1LacZ alleles lack Atoh1 expression in the Egr2Cre (Egr2; Atoh1CKO) or Hoxb1Cre (Hoxb1; Atoh1CKO) distributions. Mice of the other three genotypes (Cre +/+; Atoh1 +/flox, Cre Cre/+; Atoh1 +/flox, and Cre +/+; Atoh1LacZ/flox) are collectively referred to as “wild-type” because they display no abnormal phenotypes and are indistinguishable based on the testing reported here.
Behavioral testing.
Acoustic startle responses of 2- to 10-month-old mice (6–15 mice of each genotype) were measured using the SR-Lab System (San Diego Instruments). Mice were placed in a Plexiglas cylinder and left undisturbed for 5 min, and 70 dB background white noise was played throughout the testing period. Test sessions consisted of six blocks of eight different trial types presented in pseudorandom order such that each trial type occurred once within a block of eight trials (average intertrial interval, 15 s; range, 10–20 s). One trial type consisted of the startle stimulus alone, which was a 120 dB pure tone sound played for 40 ms. Three different “prepulse” trial types consisted of 20 ms sounds of 74, 78, or 82 dB presented 100 ms before the 120 dB startle stimulus. These three prepulse sounds were also presented separately without the startle stimulus. Finally, trials in which no stimulus was presented were used to establish the startle baseline. The startle response, consisting of movement by the test mouse when the sounds were played, was recorded every 1 ms for 65 ms starting with the onset of the stimulus trial, and the maximum startle amplitude recorded during the 65 ms sampling window was used for comparison between mice of different genotypes.
Electrophysiological testing.
Our methodology for measuring auditory brainstem evoked responses (ABRs), distortion product otoacoustic emissions (DPOAEs), compound action potentials (CAPs), and cochlear microphonics (CMs) in mice has been described previously (Xia et al., 2007). Briefly, 6- to 7-week-old mice were anesthetized using ketamine (100 mg/kg) and xylazine (5 mg/kg). Mice were placed on a heating pad to maintain normal body temperature throughout the test procedures. Different sets of animals were used for ABR/DPOAE (n = 6–9 per genotype) and CAP/CM (n = 3–4 per genotype) measurements; typical recording times ranged from 25 to 40 min. Acoustic stimuli were generated digitally, converted to analog signals, and then attenuated to the appropriate intensity according to our experimental design (RP2 and PA5; Tucker Davis Technologies). Two different speaker systems were used: high-frequency piezoelectric speakers for the ABR and DPOAE measurements (EC1; Tucker Davis Technologies) and a Super Tweeter (Radio Shack) for the CAP and CM measurements. The speakers were connected to an ear bar inserted into the ear canal and calibrated from 4 to 95 kHz by a probe-tip microphone (type 8192, NEXUS conditioning amplifier; Brüel and Kjær) inserted through the ear bar. The tip of the microphone was within 3 mm of the tympanic membrane.
The ABR was measured from a needle electrode positioned at the ventral surface of the tympanic bulla referenced to an electrode placed at the vertex of the skull. A ground electrode was placed in the hindleg. The stimulus was a 5 ms sine-wave tone pip of alternating polarity with cos2 envelope rise and fall times of 0.5 ms and a repetition time of 50 ms. The stimulus intensity ranged from 10 to 80 dB sound pressure level (SPL) in 10 dB steps. The frequency range studied was 4 to 90 kHz. Two hundred fifty ABR responses were sampled at each frequency over the 50 ms repetition time and averaged. Thresholds were calculated by interpolating the peak-to-peak voltages of the ABR waveforms over the range of stimulus intensities and determining when the ABR was 4 SDs above the noise floor. If no ABR response was detected at our equipment limit of 80 dB SPL, we arbitrarily defined the threshold to be 80 dB.
To measure the CAP, a surgical procedure was performed to open the tympanic bulla. The anesthetized mouse was secured rigidly in a head holder, a ventral incision was made, and the pinna was resected. The bulla was carefully opened medial to the tympanic annulus, and the ear bar was secured within the ear canal. The CAP was measured from the ball-ended tip of a Teflon-coated silver wire (0.003 inch diameter; A-M Systems) advanced onto the round window membrane with a micromanipulator. The signal was referenced to a silver wire inserted under the skin near the vertex of the skull. The ground electrode was placed in the hindleg. The stimulus used to elicit the CAP was identical to that used to elicit the ABR, but only 24 repetitions were averaged at each stimulus intensity level.
The stimuli for eliciting DPOAEs were two sine-wave tones of differing frequencies (F2 = 1.2 × F1) of 1 s duration, with F2 ranging from 4 to 90 kHz. The two tones were presented at identical intensities, which ranged from 20 to 80 dB SPL in 10 dB increments. The acoustic signal picked up by the microphone in the ear bar was digitized at 200 kHz and the magnitude of the 2 × F1 − F2 distortion product determined by fast Fourier transform (FFT). The surrounding noise floor was also calculated by averaging 20 adjacent frequency bins around the distortion product frequency. DPOAE thresholds were calculated offline by interpolating the data and identifying when the signal was more than −5 dB SPL and greater than 2 SDs above the noise floor. If no DPOAE response was detected at our equipment limits of 80 dB SPL, we arbitrarily defined the threshold to be 80 dB.
The CM signal was measured from a silver wire placed on the round window membrane, as described for the CAP measurement. The stimulus was a 30 ms, 6 kHz tone repeated every 1 s, and its intensity was ranged from 10 to 100 dB SPL. By measuring the speaker output with the probe tip microphone in the ear bar, FFT analysis demonstrated that all stimulus harmonics and noise at all other frequencies were at least 50 dB below the primary signal at all stimulus intensities. The CM signal measured by the bioamplifier was digitized at 200 kHz, and the magnitude of the response at 6 kHz determined by FFT.
Tissue harvesting and processing.
For embryonic tissue, pregnant dams were killed, and embryos were dissected into cold 1× PBS. Either whole embryos [embryonic day 9.5 (E9.5)] or dissected heads and brains [E16 to postnatal day 0 (P0)] were immersion fixed for 30 min overnight at 4°C in either fresh 4% paraformaldehyde (PFA)/0.1 m phosphate buffer or 10% neutral buffered Formalin (NBF) (Thermo Fisher Scientific). Mice 3 d of age and older were transcardially perfused with 10% NBF. Brains and heads were dissected at P3, whereas for older ages, brains and cochlea were dissected and tissues were postfixed overnight at 4°C. After fixation, all tissues were washed three times in 1× PBS. Brains were stored in 70% EtOH for paraffin embedding or 30% sucrose/1× PBS for cryoembedding. Heads and cochlea were decalcified in 0.12 m EDTA for 5 d and then transferred to 70% EtOH and embedded in paraffin.
For lipophilic dye injections, P0–P18 mice were anesthetized with 60 mm tribromoethanol (Avertin) and then transcardially perfused with cold 1× PBS, followed by cold 4% PFA/0.1 m phosphate buffer. Heads were stored in 0.4% PFA/0.1 m phosphate buffer at 4°C until the time of dye injection.
For paraffin sectioning, tissues were dehydrated and embedded in Paraplast (McCormick Scientific) or TissuePrep (Thermo Fisher Scientific). Six micrometer serial sections were cut on a Leica microtome and collected on Superfrost/Plus slides (Thermo Fisher Scientific).
For cryostat sectioning, tissues were embedded in Tissue-Tek OCT (Sakura Finetek), serially sectioned at 20–25 μm on a freezing microtome, and collected on Superfrost/Plus slides.
Histology.
Embryonic and P0 tissues were stained for β-galactosidase activity in whole-mount preparations for 2–24 h at 37°C. Tissues were then washed three times in 1× PBS and transferred to 70% EtOH for storage. Slides with cryostat sections of adult brain were stained in a similar manner, then counterstained with Nuclear Fast Red (Vector Laboratories), dehydrated, and mounted with Cytoseal 60 (Richard Allan Scientific).
Paraffin sections from brains of all ages were rehydrated and stained with cresyl violet, dehydrated, and coverslipped. Paraffin sections of heads and cochlea of all ages were rehydrated and sequentially stained with Mayer's Hematoxylin/Eosin Y (Sigma), followed by dehydration and coverslipping.
For all histological analyses [cresyl violet, 5-bromo-4-chloro-3-indolyl-β-d-galactopyranoside (X-gal), immunochemistry, and in situ hybridization (ISH)], series of slides were processed to allow exact matching of the anteroposterior levels between wild-type, Egr2; Atoh1CKO, and Hoxb1; Atoh1CKO brains.
Immunochemistry.
Tissue sections from at least two brains of each genotype were blocked for 1–2 h at room temperature (RT) in 1× PBS/0.3% Triton X-100 (PBST) with 2% normal goat or donkey serum (PBST-S). Slides were incubated at 4°C overnight in primary antibodies diluted in PBST-S: mouse anti-Cat-301 (MAB5284; Millipore Corporation) at 1:500 and chicken anti-choline acetyltransferase (ChAT) (AB15468; Millipore Bioscience Research Reagents) at 1:2000. Goat anti-mouse (Jackson ImmunoResearch) and donkey anti-goat (Jackson ImmunoResearch) secondary antibodies conjugated to cyanine 3 were used at a 1:500 dilution in PBST-S and applied for 30 min at RT. For horseradish peroxidase staining (ChAT), HRP-conjugated goat anti-chicken secondary antibody from Vector Laboratories was used following the directions of the manufacturer.
Goat polyclonal anti-retinoid orphan receptor α (RORα) (SC-6062; Santa Cruz Biotechnology) was used on antigen retrieved tissue (Ino, 2004). After fixation and before cryoembedding, brains were cut into 3- to 5-mm-thick slices in the coronal plane and boiled for 3 min in 10 mm sodium citrate buffer, pH 6.0. A 1:2000 dilution of the primary antibody was used in PBST in 2% normal donkey serum. Diaminobenzidine labeling was performed using a Vectastain kit (Vector Laboratories) according to the instructions of the manufacturer.
In situ hybridization.
Tissue preparation and automated ISH were performed as described previously (Carson et al., 2002; Visel et al., 2004; Yaylaoglu et al., 2005) and as described online at http://www.genepaint.org/RNA.htm. Briefly, heads of embryonic mice were embedded in OCT and fresh frozen in a custom-made freezing chamber that allows stereotaxic alignment of the specimen. Serial sections were cut at 20 μm thickness on a freezing microtome. After PFA fixation and acetylation, the slides were assembled into flow-through hybridization chambers and placed into a Tecan Genesis 200 liquid-handling robot, which executes a script that performs nonradioactive ISH in <24 h. Antisense probes for Atoh1 and VGLUT2 were generated from PCR-amplified cDNA clones and used for in vitro transcription of digoxygenin-labeled riboprobe using either T7 or SP6 RNA polymerase. Robotic ISH was performed according to a previously published protocol (Yaylaoglu et al., 2005). Hybridized antisense probe was detected by catalyzed reporter deposition using biotinylated tyramide, followed by colorimetric detection of biotin with avidin coupled to alkaline phosphatase (Carson et al., 2005; Yaylaoglu et al., 2005). At least two brains of each genotype were analyzed.
Atoh1-lineal fate mapping.
Pregnant dams obtained from matings of Atoh1CreER-T2 and ROSAR26R animals were intraperitoneally injected at E9.5 or E10.5 with 4 mg (200 μl) of a 20 mg/ml solution of tamoxifen (Sigma) dissolved in corn oil. Embryos were harvested on day E18.5 of gestation.
Lipophilic dye injections.
Wedges soaked with lipophilic dyes of different colors (Fritzsch et al., 2005) were injected into the ear (base, apex, and vestibular organs) or the brainstem (ventral acoustic stria, cochlear nuclei) using appropriate landmarks (trigeminal nerve or facial nerve) of P0–P19 conditional knock-out and wild-type mice. Brains and ears were incubated for 7–14 d (depending on age) at 36°C in 4% PFA. Ears were dissected and imaged as whole mounts to ensure application accuracy. Brains were viewed as whole mounts and subsequently embedded in 4% gelatin and hardened for 10 d in 10% PFA at 4°C. One-hundred-micrometer-thick coronal sections were mounted in glycerol and viewed with a Carl Zeiss LSM 510 or Leica SPE confocal microscope using appropriate filter settings. Image stacks along the z-axis were taken and combined using Carl Zeiss LSM or Leica software. Two or three brains or cochlea from each genotype were analyzed.
Cell and axon counts.
SGN counts were done on 6 μm paraffin sections. Consecutive sections through the entire spiral ganglion were stained with Mayer's Hematoxylin/Eosin Y, and all SGNs with a clear nuclear membrane were counted on every fifth section (every 30 μm) at 200× magnification on a Carl Zeiss Axioplan 2 microscope (Carl Zeiss). Neurons and pyknotic nuclei of the medial nucleus of the trapezoid body (MNTB) were counted in a similar manner, except every 10th (every 60 μm; P0, P3, P7) or every 20th (every 120 μm; adult) section was analyzed. A total of three or four cochlea and four MNTBs from two animals of each genotype at each age were counted.
Axonal counts were obtained from three ears of P17–P19 wild-type (Egr2 +/+; Atoh1LacZ/flox) and Egr2; Atoh1CKO mice. For this, ears were osmicated, and tangential sections were taken parallel to the basal hook region and the middle turn (Postigo et al., 2002). Images were taken from the middle and basal cochlear turns using a Nikon E800 with a 60× oil-immersion lens (numerical aperture 1.4), and all myelinated axons in a 100 μm stretch of these sections were counted on prints as described previously (Postigo et al., 2002).
To correct for overcounting of SGNs, digital photographs of all regions of the spiral ganglion were taken in a single mid-modiolar section using a Carl Zeiss Axiocam, and nuclear diameters were measured using Carl Zeiss Axiovision software (version 4.5). The Hendry method (Hendry, 1976) was used to correct for overrepresentation of nuclei in multiple sections. No corrections were done for axon counts.
Statistical analysis.
All statistical analysis was done using SPSS version 11 for Mac OS-X (SPSS). ANOVA was used to compare ABR, acoustic startle, CAP, CM, and DPOAE values across genotypes, followed by calculation of least-square differences for pairwise comparisons. Cell and axon counts were compared using independent sample two-tailed t tests.
Results
Deletion of Atoh1 from rhombomeres 3–5 disrupts cochlear nucleus formation
The Egr2Cre line drives Cre expression specifically in rhombomeres 3 and 5 of the embryonic neural tube (Voiculescu et al., 2000), whereas the Hoxb1Cre line drives expression in the rhombencephalon distal to the posterior border of rhombomere 3 (Arenkiel et al., 2003). We verified these expression patterns and demonstrated that cells derived from these lineages populate different regions of the adult CN and AAN (supplemental Fig. 1A–H, available at www.jneurosci.org as supplemental material). Virtually all neurons of the anteroventral cochlear nucleus (AVCN) and AAN are descended from the Egr2 lineage, as are large neurons of the posteroventral (PVCN) and dorsal (DCN) cochlear nuclei (supplemental Fig. 1B–D, available at www.jneurosci.org as supplemental material). In contrast, the Hoxb1 lineage densely populates the PVCN and DCN but contributes very few neurons to the AVCN (supplemental Fig. 1F,G, available at www.jneurosci.org as supplemental material). The majority of the AAN is also derived from the Hoxb1 lineage with the exception of the MNTB, in which only approximately half of the neurons are labeled (supplemental Fig. 1H, available at www.jneurosci.org as supplemental material). These data suggest that the AVCN is derived almost solely from rhombomere 3, the PVCN from rhombomeres 3 and 4, the DCN from rhombomeres 4 and 5, the MNTB from rhombomeres 3 and 5, and the rest of the AAN from rhombomere 5. This is in good agreement with previous fate maps of the mouse CN (Farago et al., 2006) and chick superior olivary complex (Marín and Puelles, 1995).
We next used these Cre-driver alleles to delete a floxed allele of Atoh1 (Atoh1flox) (Shroyer et al., 2007) in transgenic mice. Cre expression in both of these lines precedes Atoh1 expression by 0.5–1 d, and we verified that Atoh1 expression was completely absent from the regions in which Cre protein was produced (supplemental Fig. 1I–N, available at www.jneurosci.org as supplemental material). This suggests that the overall recombination efficiency was close to 100% in both lines. Egr2; Atoh1CKO animals were born in the expected Mendelian ratio, had a normal lifespan, and did not display any overt morphological or behavioral phenotypes. Hoxb1; Atoh1CKO animals were born in the expected Mendelian ratio, but ∼50% of these animals died within 24–36 h of birth.
We examined the CN of adult Egr2; Atoh1CKO and Hoxb1; Atoh1CKO animals for morphological abnormalities. Egr2; Atoh1CKO animals lack nearly the entire AVCN with the exception of a small portion of the posterior region, and both the DCN and PVCN are small compared with wild-type animals (Fig. 1 B,E,H) (supplemental Fig. 2, available at www.jneurosci.org as supplemental material). In contrast, the AVCN is completely preserved in Hoxb1; Atoh1CKO animals, but the majority of the PVCN and DCN are lost (Fig. 1 C,F,I) (supplemental Fig. 3, available at www.jneurosci.org as supplemental material). Cochlear root neurons are absent from adult Egr2; Atoh1CKO and Hoxb1; Atoh1CKO animals (supplemental Fig. 2, 3, available at www.jneurosci.org as supplemental material). This pattern of neuronal loss corresponds to the areas of highest Cre expression in these Cre-driver lines and substantiates the proposed rhombomeric origins of the CN (supplemental Fig. 1B,C,F,G, available at www.jneurosci.org as supplemental material).
Figure 1.
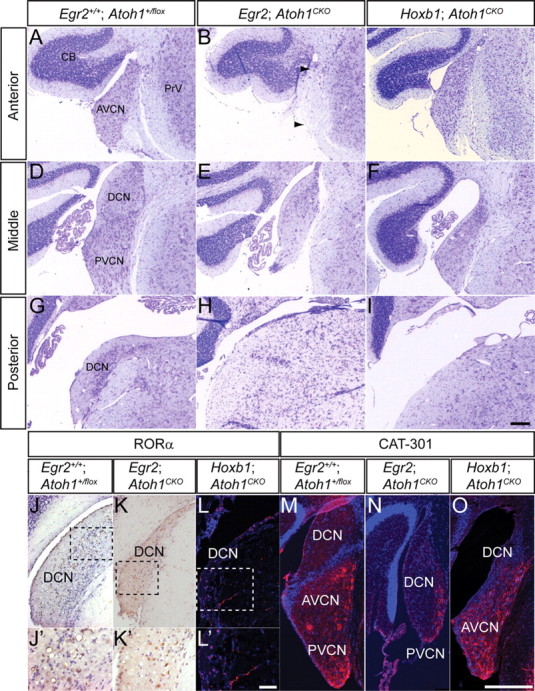
Different subnuclei of the CN are disrupted in adult Egr2; Atoh1CKO and Hoxb1; Atoh1CKO mice. A–I, Cresyl-violet-stained sections of CN from wild-type (A, D, G), Egr2; Atoh1CKO (B, E, H), and Hoxb1; Atoh1CKO (C, F, I) animals at anterior (A–C), middle (D–F), and posterior (G–I) levels. The AVCN is most severely affected in Egr2; Atoh1CKO mice, although the auditory nerve fibers are preserved (B, arrows). The PVCN and DCN are most severely affected in Hoxb1; Atoh1CKO animals. J–L, RORα immunostaining of DCN from wild-type (J, J′), Egr2; Atoh1CKO (K, K′), and Hoxb1; Atoh1CKO (L, L′) animals. RORα-positive cells, which are present only in the DCN, are seen in all three genotypes. J′–L′, Higher-magnification views of boxed areas in J–L, respectively. M–O, Cat-301 immunostaining is present in the VCN of wild-type (M), Egr2; Atoh1CKO (N), and Hoxb1; Atoh1CKO (O) animals. Scale bars: A–I, M–O, 200 μm; J–L, 100 μm; J′–L′, 12.5 μm.
We performed immunocytochemistry for RORα, which is expressed by cartwheel cells in the DCN (Ino, 2004), and Cat-301, a marker of the extrasynaptic neuronal surface expressed throughout the AVCN and PVCN (Lurie et al., 1997), to more accurately identify the missing regions of the disrupted CN of Atoh1CKO animals. RORα-positive and Cat-301-positive neurons are present in the CN of Egr2; Atoh1CKO and Hoxb1; Atoh1CKO animals (Fig. 1 J–O). These data demonstrate that no subdivision of the CN is completely lost in either of these Atoh1CKO lines.
Accessory auditory neurons are lost in Egr2; Atoh1CKO and Hoxb1; Atoh1CKO animals attributable to primary and secondary effects of Atoh1 loss
Given the disruption of CN structure, we hypothesized that output from the CN would also be disrupted. To assess this possibility, we examined the size of the trapezoid body, or ventral acoustic stria, a fiber tract that projects from the CN to the brainstem AAN. Nissl-stained sections of and lipophilic dye injections directly into the trapezoid body demonstrate that it is of reduced caliber in Egr2; Atoh1CKO and Hoxb1; Atoh1CKO animals but that this reduction is much more dramatic in Egr2; Atoh1CKO animals (Fig. 2 A–C, single arrows). In addition, dye injections into the trapezoid body failed to back-label CN neurons of Egr2; Atoh1CKO mice, suggesting that these fibers do not originate from or connect to the CN (Fig. 2 B). Finally, dye injections into the CN of Egr2; Atoh1CKO animals labeled cochlear afferents but failed to label the trapezoid body or AAN (data not shown). These results suggest that the cellular disruption in the CN of Hoxb1; Atoh1CKO mice reduces the projection to the AAN and completely ablates this projection in Egr2; Atoh1CKO animals.
Figure 2.
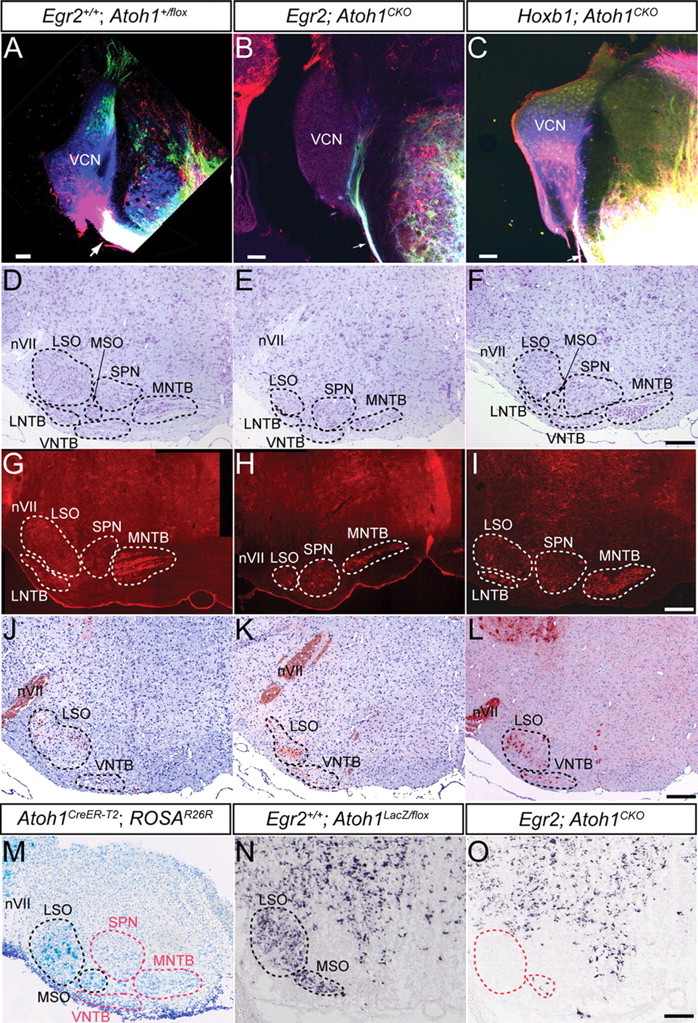
The brainstem AAN and pathways are disrupted in Egr2; Atoh1CKO and Hoxb1; Atoh1CKO mice. A–C, Lipophilic dye injections into the acoustic stria at P18 retrogradely label the CN of wild-type and Hoxb1; Atoh1CKO (A, C) but not Egr2; Atoh1CKO (B) animals. NeuroVue dyes were injected into the ventral acoustic stria near the facial nerve (red) and trigeminal nerve (blue) and into the dorsal and ventral acoustic striae between the other two injections (green). Note the massive filling of the ventral acoustic stria and retrograde filling of DCN (green cells) and VCN (blue and red cells) in wild-type (A) and Hoxb1; Atoh1CKO (C) mice. The caliber of the ventral acoustic stria is much smaller in Egr2; Atoh1CKO animals (compare single arrows in A–C), showing only fibers projecting into the ventral cochlear nucleus that may represent inferior colliculus, superior olive, or trigeminal fibers known to reach the CN in mice. The ventral acoustic stria is also reduced in size in Hoxb1; Atoh1CKO mice (arrow), but retrogradely labeled neurons are still found throughout the CN. For the remaining panels, sections from similar anteroposterior levels of the brainstem are presented for each of the genotypes. D–F, Cresyl violet stain of AAN in 7-week-old wild-type, Egr2; Atoh1CKO, and Hoxb1; Atoh1CKO mice. The nuclear subdivisions are outlined and labeled. The LSO, MNTB, MSO, and VNTB are reduced in size in Egr2; Atoh1CKO animals (E), whereas only the LSO appears to be affected in Hoxb1; Atoh1CKO animals (F). G–I, Cat-301 immunostaining of accessory auditory nuclei shows loss of neurons from the LNTB, LSO, and MNTB of Egr2; Atoh1CKO animals and cell loss from only the LSO of Hoxb1; Atoh1CKO animals. J–L, ChAT immunostaining of brainstems from wild-type, Egr2; Atoh1CKO, and Hoxb1; Atoh1CKO mice confirms that, in all genotypes, neurons in the LSO and VNTB that project in the olivocochlear bundle are present. Note the increased packing density and different positions of these neurons in the LSO of Egr2; Atoh1CKO and Hoxb1; Atoh1CKO compared with wild-type animals. M, X-gal stain of AAN from E18.5 Atoh1CreER-T2 embryo whose pregnant dam was injected with tamoxifen at E10.5. Labeled cells are found in the developing LSO and MSO (black dotted lines). AAN without labeled cells are designated by red dotted lines. N, O, VGLUT2 in situ hybridization of brainstem sections from E18.5 wild-type (N) and Egr2; Atoh1CKO (O) embryos. The wild-type distribution of VGLUT2 mRNA in the AAN is virtually identical to the X-gal expression pattern in M. Only a few VGLUT2-expressing cells are present in the LSO and MSO of the Egr2; Atoh1CKO embryo, suggesting a primary effect of Atoh1 deletion. Red dotted lines in O show the expected position of these cells. nVII, Seventh nerve. Scale bars: A–C, 100 μm; D–O, 200 μm.
The brainstem AAN, comprising the SOC and NTB, are major targets of the CN. We therefore examined the morphology of these regions for possible secondary affects of CN disruption. The lateral superior olive (LSO), medial superior olive (MSO), and MNTB are dramatically smaller in Egr2; Atoh1CKO compared with wild-type animals, whereas more subtle decreases in size of the lateral NTB (LNTB) and ventral NTB (VNTB) are also present (Fig. 2 D,E,G,H) (supplemental Fig. 4, available at www.jneurosci.org as supplemental material). In contrast, the effects on the AAN of Hoxb1; Atoh1CKO animals are much less dramatic, with qualitative evidence of cell loss visible only in the LSO and MSO (Fig. 2 F,I) (supplemental Fig. 4, available at www.jneurosci.org as supplemental material). The superior periolivary nucleus (SPN) is not affected in either Atoh1CKO line.
The olivocochlear bundle (OCB) is the main efferent pathway to the cochlea. In rodents, ChAT-positive neurons of the LNTB, LSO, and VNTB project in the OCB (Yao and Godfrey, 1998). Because neurons in these regions are lost in Egr2; Atoh1CKO and Hoxb1; Atoh1CKO animals, we sought to determine whether olivocochlear neurons were affected. ChAT-positive neurons are found in the regions of the LNTB, LSO, and VNTB of Egr2; Atoh1CKO and Hoxb1; Atoh1CKO animals but are more densely packed and located more ventrally than in wild-type animals (Fig. 2 J–L). These data demonstrate that the efferent auditory connections to the cochlea are not dependent on connectivity with the CN for their survival.
The AAN lie within the domains of Egr2Cre and Hoxb1Cre expression (supplemental Fig. 1D,H, available at www.jneurosci.org as supplemental material), opening the possibility that primary deletion of Atoh1 from this region could directly result in loss of neurons. Preliminary fate mapping data from our laboratory suggested that a population of SOC neurons that express the vesicular glutamate transporter VGLUT2 were derived from an early (E9.5–E10.5) Atoh1-expressing lineage and that these neurons were lost in Atoh1-null mice (H. Y. Zoghbi, unpublished observation). No Atoh1-lineal neurons labeled from E11.5–E14.5 populated the AAN (data not shown). We used a tamoxifen-inducible system to fate map these cells in Atoh1CreER-T2; ROSAR26R mice and verified that a subset of neurons that populate the LSO and MSO were indeed descended from the Atoh1 lineage (Fig. 2 M). In situ hybridization for VGLUT2 on sections of the AAN from E18.5 Egr2; Atoh1CKO animals shows that these neurons are missing, suggesting a primary effect of Atoh1 loss on this neuronal population (Fig. 2 N,O). Neurons in other regions of the AAN are not descended from the Atoh1 lineage, suggesting that loss of neurons in these areas must be secondary to deletion of Atoh1 from the CN, LSO, and/or MSO neurons.
Egr2; Atoh1CKO and Hoxb1; Atoh1CKO mice are deaf
We next sought to characterize the behavioral and physiological effects caused by disruptions of the central auditory system in Atoh1CKO mice. We used the acoustic startle response to test hearing in Egr2; Atoh1CKO and Hoxb1; Atoh1CKO mice. Mice were placed in a small Plexiglas chamber in which a piezoelectric device detected their movement in response to sounds of varying intensities. Hoxb1; Atoh1CKO mice demonstrated no response to sounds of 120 dB (n = 7, no stimulus vs 120 dB; t test p = 0.36). Egr2; Atoh1CKO animals responded to sounds of 120 dB (n = 15, no stimulus vs 120 dB; t test p = 0.006), but this response was greatly attenuated when compared with littermate controls (intergenotype comparison, ANOVA, p = 0.0002; least-squares difference for pairwise comparisons, p = 0.00002 to 0.33 for Egr2; Atoh1CKO vs other genotypes). Thus, Egr2; Atoh1CKO and Hoxb1; Atoh1CKO mice are behaviorally deaf.
To uncover the underlying auditory system defects, we performed electrophysiological testing of cochlear hair cell, auditory nerve, and brainstem auditory pathway function. We measured DPOAEs, sounds generated secondary to nonlinearities associated with outer hair cell force production, to examine forward and reverse transduction in Atoh1CKO mice. Hoxb1; Atoh1CKO animals had no measurable DPOAEs at any frequency or sound intensity tested, suggesting that defects in the peripheral auditory system are sufficient to explain their deafness. In contrast, DPOAEs and CMs, which are field potentials representing outer hair cell receptor potentials in response to acoustic stimuli, were normal in Egr2; Atoh1CKO mice (Fig. 3 A,B). This demonstrates that hair cell function is normal in Egr2; Atoh1CKO animals.
Figure 3.
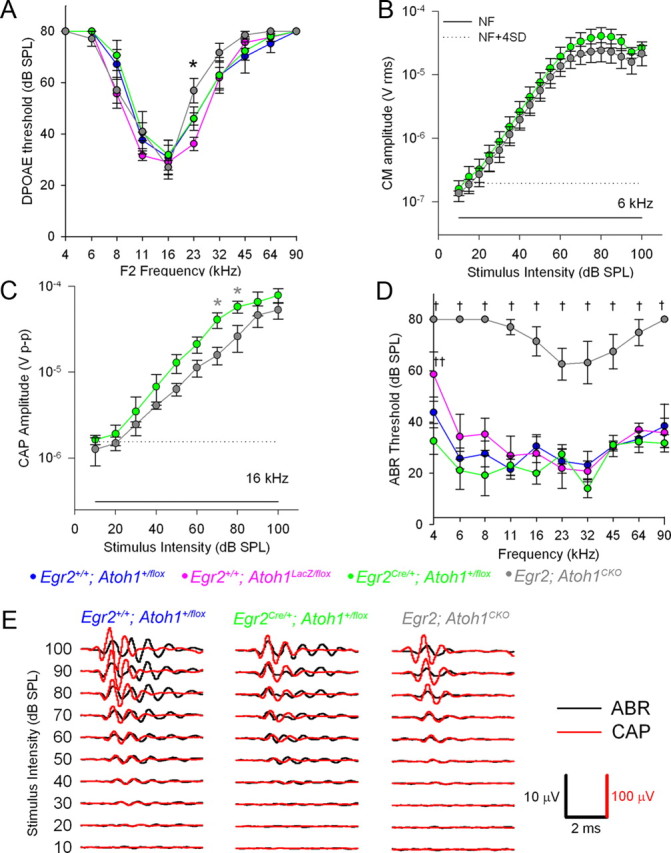
Egr2; Atoh1CKO mice have normal cochlear function but have mild auditory nerve and severe brainstem auditory pathway dysfunction. Data are plotted as mean ± SEM. A, DPOAE thresholds (n = 6–9 animals per genotype). There is only one statistically significant difference at 23 kHz (ANOVA followed by least-squares difference for pairwise comparisons, *p = 0.032 for Egr2; Atoh1CKO vs Egr2 +/+; Atoh1 +/flox and p = 0.0002 for Egr2; Atoh1CKO vs Egr2 +/+; Atoh1LacZ/flox). B, CM amplitudes from Egr2 Cre/+; Atoh1 +/flox (n = 4) and Egr2; Atoh1CKO (n = 3) animals. The solid line is the noise floor (NF), and the dotted line is the root mean square noise floor + 4 SD. There were no statistically significant differences between the responses of the two genotypes at any of the stimulus intensities tested. C, CAP amplitudes from Egr2 Cre/+; Atoh1 +flox (green circles; n = 4) and Egr2; Atoh1CKO (gray circles; n = 3) mice. t test, *p = 0.05. CAP amplitudes were mildly reduced in Egr2; Atoh1CKO mice relative to controls. Solid and dotted lines same as B. D, ABR thresholds (n = 7–9 animals per genotype). ANOVA followed by least-squares differences, † p ≤ 0.00000001 to 0.018 Egr2; Atoh1CKO vs others, †† p = 0.005 Egr2 Cre/+; Atoh1 +/flox vs Egr2 +/+; Atoh1LacZ/flox. ABR thresholds were significantly elevated in Egr2; Atoh1CKO mice relative to controls. E, Representative ABR and CAP waveforms from single mice. The CAP waveforms (shown in red) are similar among the animals, confirming that the auditory nerve is receiving information from the inner hair cell appropriately. However, the ABR waveform (shown in black) in the Egr2; Atoh1CKO animal is shorter in duration and has fewer peaks, suggesting that the signal is not propagated within the brainstem.
We next tested auditory nerve function in Egr2; Atoh1CKO mice by recording CAPs, field potentials generated by the synchronized firing of SGNs in response to tone burst stimuli (Fig. 3 C,E). CAPs with normal waveform morphology (Fig. 3 E) but slight decreases in amplitude were found in Egr2; Atoh1CKO mice (Fig. 3 C, t test, *p = 0.05). Together with the normal hair cell function testing, these data suggest that defects in the peripheral auditory system are insufficient to explain the profound hearing impairment of Egr2; Atoh1CKO mice.
In contrast, we found that the ABR, consisting of synchronized field potentials generated by the auditory nerve and brainstem neurons in response to acoustic stimuli, had threshold elevations of 34–53 dB (mean of 44 dB) across all frequencies tested and showed loss of the later waveforms generated by the brainstem auditory pathways (Fig. 3 D,E). These findings show that sound information does not propagate beyond the auditory nerve. Together with the histological findings, these data demonstrate that CN dysfunction causes the deafness seen in Egr2; Atoh1CKO mice.
Spiral ganglion cells are lost in Egr2; Atoh1CKO animals despite normal cochlear structure and hair cell morphology
Atoh1 is necessary for the development of inner ear hair cells (Bermingham et al., 1999). To be certain that Atoh1 was not deleted from this cell population, we carefully analyzed the structure of Egr2; Atoh1CKO mouse cochleae (Fig. 4). The overall structure of the cochlea is unchanged in Egr2; Atoh1CKO animals, in which a continuous line of Atoh1-expressing hair cells is present in all turns of the cochlea at birth (Fig. 4 A,B). In addition, both inner and outer hair cell morphology is preserved throughout all cochlear turns, as demonstrated by representative sections from the mid-modiolar region of adult cochleae shown in Figure 4 C–F. These data, combined with normal hair cell electrophysiological data, suggest that the hair cell population is not affected in Egr2; Atoh1CKO animals. The cochlear hair cell population of Hoxb1; Atoh1CKO mice, however, was not normal (data not shown); additional studies of these abnormalities will be the subject of another report. Based on the potential complex interactions of primary peripheral and central effects on the auditory system of Hoxb1; Atoh1CKO mice, the rest of the present report will focus on further characterization of Egr2; Atoh1CKO animals.
Figure 4.
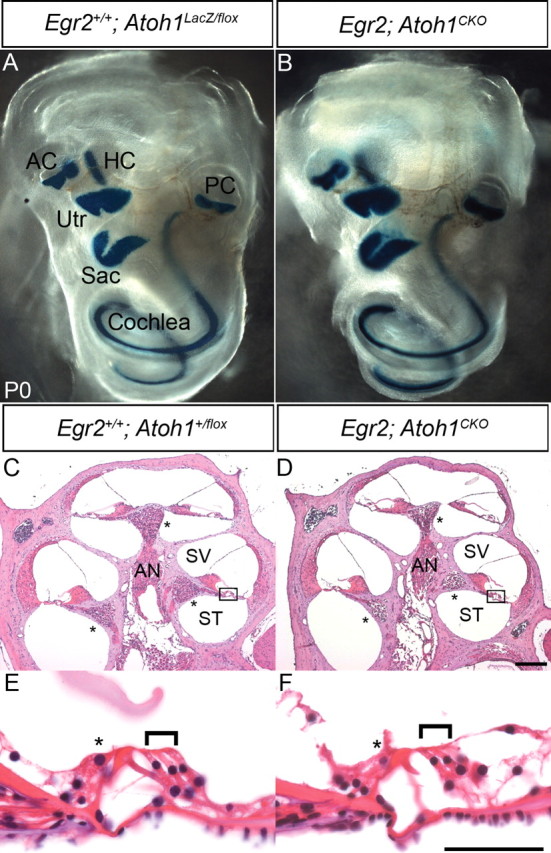
The cochlea and organ of Corti are structurally normal in Egr2; Atoh1CKO animals. A, Egr2 +/+; Atoh1LacZ/flox; C, E, Egr2 +/+; Atoh1 +/flox; B, D, F, Egr2; Atoh1CKO. A, B, Whole-mount β-galactosidase staining of P0 cochleae. The Atoh1LacZ allele is expressed by hair cells in the cochlea and vestibular system. A continuous line of staining is seen in cochleae from both genotypes, suggesting that the majority of hair cells are present. C, D, Hematoxylin and eosin-stained mid-modiolar sections of 6- to 7-week-old cochlea. The overall structure appears normal in the Egr2; Atoh1CKO animal. Asterisks mark the spiral ganglion. E, F, High-magnification view of boxed areas in C and D. The organ of Corti appears normal, with one row of inner (asterisk) and three rows of outer (bracket) hair cells present in the Egr2; Atoh1CKO animal. AC, Anterior crista; AN, auditory nerve; HC, horizontal crista; PC, posterior crista; Sac, saccule; ST, scala tympani; SV, scala vestibule; Utr, utricle. Scale bars: A, B, 1 mm; C, D, 200 μm; E, F, 10 μm.
We were surprised to find that SGNs and their axons were missing from P18 and adult Egr2; Atoh1CKO cochleae (Fig. 5 A–C). Quantification of SGN soma (means: 10,258 neurons in Egr2 +/+; Atoh1 +/flox vs 7094 neurons in Egr2; Atoh1CKO; t test p = 0.01) and axon numbers (means: base, 70 axons in Egr2 +/+; Atoh1 +/flox vs 48 axons in Egr2; Atoh1CKO, t test, p = 0.09; middle, 247 axons in Egr2 +/+; Atoh1 +/flox vs 148 axons in Egr2; Atoh1CKO, t test, p = 0.004) in the cochlea and auditory nerve demonstrated a 30% reduction in Egr2; Atoh1CKO animals (Fig. 5 C). This reduction in SGN and auditory nerve fiber numbers probably accounts for the decreased CAP amplitude found in Egr2; Atoh1CKO mice (Fig. 3 C). SGN numbers in wild-type animals with one copy of the Egr2Cre or Atoh1LacZ allele were normal (Egr2 +/+; Atoh1 +/flox vs Egr2 Cre/+; Atoh1 +/flox vs Egr2 +/+; Atoh1LacZ/flox; ANOVA, p = 0.21), demonstrating that this effect was specific to conditional deletion of Atoh1.
Figure 5.
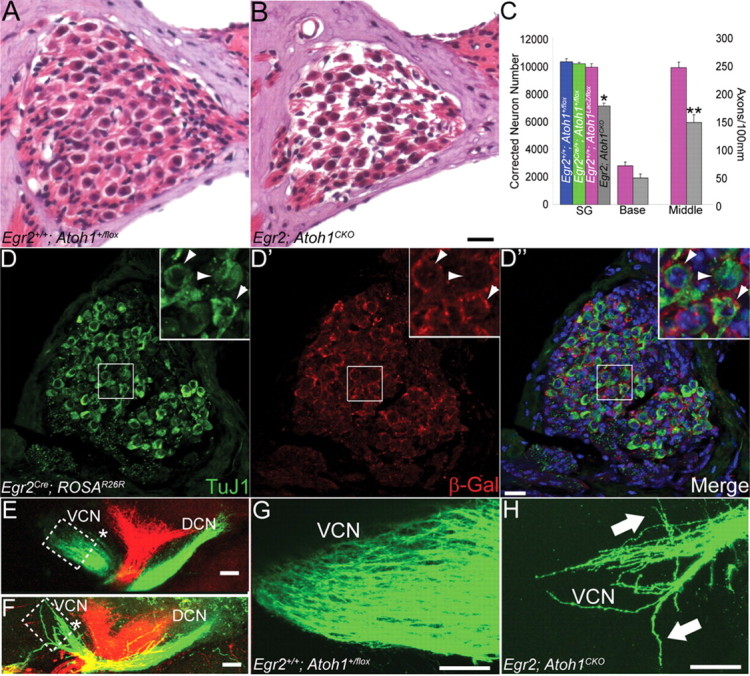
SGN and auditory nerve axon number are decreased in Egr2; Atoh1CKO animals, and auditory nerve axons show pathfinding errors in the CN. A, B, Hematoxylin and eosin-stained spiral ganglion of 6-week-old wild-type (A) and Egr2; Atoh1CKO (B) animals. Note the decreased packing density in the Egr2; Atoh1CKO spiral ganglion. C, Total spiral ganglion neuron number and auditory nerve axon number at the base and middle of the cochlea. Error bars show SEM. All three populations are reduced by ∼30% in Egr2; Atoh1CKO animals relative to wild-type (t test, *p = 0.01, **p = 0.004). D–D″, Spiral ganglion sections from an adult Egr2Cre; ROSAR26R animal immunostained for TuJ1 and β-Gal. Insets show higher-magnification views of the boxed region in each panel. Arrowheads denote TuJ1-positive neurons that are surrounded by Egr2-lineal cells. E–H, Lipophilic dye injections into the apex (green) and base (red) of P0 wild-type (E, G) and Egr2; Atoh1CKO (F, H) cochleae label auditory nerve projections into the VCN and DCN. The VCN projections, particularly those from the apex of the cochlea, are much thinner in Egr2; Atoh1CKO mice, and fibers aberrantly defasciculate and travel in abnormal anterior and posterior directions (H, arrows). Boxes in E and F delineate areas shown in G and H, respectively. * denotes the body of the VCN, which is much smaller in the Egr2; Atoh1CKO CN. Projections to the DCN in Egr2; Atoh1CKO animals are present and appear to be less affected than their VCN counterparts. Scale bars: A, B, D–D″, 20 μm; E–H, 100 μm.
Atoh1 is expressed by postnatal SGNs, although its role in this cell population is unclear (Matei et al., 2005). To rule out a direct effect of Atoh1 deletion on SGNs, we fate mapped Egr2-lineal cells in the cochlea of adult Egr2Cre; ROSAR26R animals (Fig. 5 D–D″). Double immunolabeling for β-galactosidase and a neuronal marker (TuJ1) demonstrated that the two antigens have nonoverlapping expression patterns in the spiral ganglion. These data show that, as expected, Egr2Cre was expressed only by Schwann cells of the spiral ganglion. Although it has never been demonstrated in any region of the CNS or PNS, it is also possible that Atoh1 could be expressed by glial cells of the SG and is somehow necessary for their survival. Glial cells are present in SGs of adult and early postnatal Egr2; Atoh1CKO animals (Fig. 6 C,D), demonstrating that deleterious effects of Atoh1 loss on this cell population cannot explain SGN loss. Thus, loss of Atoh1 expression from the spiral ganglion is not the cause of the decreased SGN number seen in Egr2; Atoh1CKO cochleae.
Figure 6.

Loss of neurons from the spiral ganglion and AAN is a secondary effect of Atoh1 disruption. A, B, Hematoxylin and eosin-stained P0 wild-type (A) and Egr2; Atoh1CKO (B) spiral ganglia. No cell loss is evident in the Egr2; Atoh1CKO spiral ganglion at this age. C, D, Hematoxylin and eosin-stained P3 wild-type (C) and Egr2; Atoh1CKO (D) spiral ganglia. White arrowheads denote SGNs; black arrows denote glial cells. E, Egr2; Atoh1CKO SGN number graphed as a percentage of wild-type number at P0, P3, and 6 weeks of age. All of the cell loss in the SGN population occurs between P0 and P3 (t test, *p = 0.02). F–I, Cresyl-violet-stained coronal brainstem sections. F, G, P0 AAN are identical in wild-type (F) and Egr2; Atoh1CKO (G) brains. H, I, Neuronal loss is present at P3 in the LNTB, MNTB, and VNTB of Egr2; Atoh1CKO mice (I). Inset in I shows pyknotic nuclei (arrows) in the MNTB. J, Egr2; Atoh1CKO MNTB neuron number graphed as a percentage of wild-type number at P0, P3, P7, and 6 weeks of age. The majority of the neuronal loss occurs between P0 and P3 (t test, **p < 0.001). K, Number of pyknotic nuclei in the MNTB at P0, P3, and P7 (t test, ***p = 0.05). The time course of neuronal loss is the same in the spiral ganglion and AAN. Scale bars: A, B, 20 μm; C, D, inset, 10 μm; F–I, 200 μm.
We next examined the central auditory nerve projection using lipophilic dyes to determine whether SGN axons projected appropriately to the CN. At P0, robust projections normally connect the apex (green) and base (red) to the DCN and VCN (Fig. 5 E,G). Axon bundles of the central projection to the VCN are reduced in size in P0 Egr2; Atoh1CKO animals, and the axons of the auditory nerve fibers defasciculate and project aberrantly in both the rostral and caudal dimensions (Fig. 5 F,H). These data, along with the SGN counts, suggest that the deletion of Atoh1-lineal cells from the CN of Egr2; Atoh1CKO animals causes secondary loss of SGNs and their axons and aberrant projection of the remaining auditory nerve fibers.
Neuronal loss in the SG and AAN occurs between P0 and P3, revealing a novel critical period
If the neuronal loss in the peripheral and central auditory systems is in fact secondary to a failure in genesis of CN and SOC neurons, there should be a time period at which the SGN, LNTB, MNTB, and VNTB neuronal populations are normal in appearance. We therefore examined the morphology of the SGN and AAN of Egr2; Atoh1CKO animals and counted the number of neurons in these structures at different postnatal times. SGs of Egr2; Atoh1CKO mice were normal in appearance and neuron number at P0, but, by P3, the number of neurons dropped to 70% of the wild-type value (Fig. 6 A,B,E). Similarly, the LNTB, MNTB, and VNTB of Egr2; Atoh1CKO animals appeared qualitatively normal at P0 but showed loss of neurons by P3 (Fig. 6 F–I). Quantification of MNTB neurons (chosen because the nucleus is easily identifiable at all postnatal ages) revealed no difference between wild-type and Egr2; Atoh1CKO animals at P0 (t test, p = 0.43). However, neuronal number decreased to 50% of the wild-type value at P3 and to ∼30% at P7 and in adulthood (Fig. 6 J). In addition, there was a sevenfold increase in cell death (as measured by the number of pyknotic nuclei) in the MNTB of P3 Egr2; Atoh1CKO compared with wild-type animals but no difference at P0 or P7 (Fig. 6 K). These data identify a critical period between P0 and P3 during which the SGN and MNTB neuronal populations require contact with CN neurons for their survival.
Discussion
Secondary dependence of spiral ganglion and AAN neurons on Atoh1-lineal neurons
The most novel finding of our study is that the survival of a subset of neurons in the spiral ganglion and AAN depends on Atoh1-lineal neurons in the central auditory system during a well defined developmental time period coincident with the first 3 d of postnatal life. This critical period is not concomitant with or an extension of any previously reported period of naturally occurring cell death in these populations. This observation adds to the evidence for a complex interdependence of peripheral and central auditory system neurons that changes during developmental time.
Our data suggest that the majority of AAN neuronal loss in Atoh1CKO animals is a secondary effect of disruption of the AVCN. Primary deletion of Atoh1 from the LSO and MSO should occur to a similar extent in Egr2; Atoh1CKO and Hoxb1; Atoh1CKO animals because these nuclei are derived from rhombomere 5, yet loss of neurons from AAN subnuclei not derived from the Atoh1 lineage (LNTB, MNTB, and VNTB) occurs only in Egr2; Atoh1CKO animals. In addition, the magnitude of neuronal loss from the LSO and MSO themselves is much greater in Egr2; Atoh1CKO than Hoxb1; Atoh1CKO animals. These findings are consistent with the fact that the AVCN provides the majority of afferents to the LNTB, LSO, MNTB, and MSO (Harrison and Irving, 1966; Willott, 2001). These data are surprising given that they suggest that deafferentation of AAN neurons rather than loss of target is what leads to their demise; possible reasons for this are discussed in the next section.
Lesions of the AVCN and cochlear nerve cause substantial loss (up to 95%) of SGNs in adult animals, suggesting that the mature SGN population must maintain central connectivity to remain viable (Spoendlin, 1971; Leake et al., 1992; Sekiya et al., 2003). However, interpretation of these studies is difficult because damage to SGN axons and/or the cochlear blood supply occurs and probably contributes to the neuronal loss. No experiments before our own have attempted to assess the dependency of the mammalian SGN population on central connectivity during early postnatal development.
In contrast to peripheral lesions, the effects of central deafferentation depend on the age of the animal. In adult animals, cochlear ablation results only in decreased soma size and dendritic arborization, but no cell loss, in the CN and AAN (Powell and Erulkar, 1962; Pasic et al., 1994). Cochlear ablation before the onset of hearing, however, causes neuronal death in the ipsilateral VCN and LSO (Trune, 1982; Moore, 1990, 1992) but not until the age of hearing onset. This suggests that a critical period concomitant with the initiation of sensory-evoked activity exists in these neuronal populations. The secondary neuronal loss that we observe in the AAN of Egr2; Atoh1CKO mice precedes the onset of hearing by more than 1 week, which occurs between P11 and P15 in mice (Friauf and Lohmann, 1999). This suggests that a mechanism independent of sensory-evoked activity is responsible for the secondary neuronal loss. We propose that this mechanism involves neurotrophin signaling.
Proposed mechanisms for neuronal loss
Neuronal death in the spiral ganglion and AAN of Egr2; Atoh1CKO mice could be secondary to the loss of trophic factors normally supplied by the AVCN. BDNF, Ntf3, and their receptors (Ntrk2 and Ntrk3, respectively) are expressed during embryonic and early postnatal development in the cochlea and in regions of the auditory brainstem (Ylikoski et al., 1993; Schecterson and Bothwell, 1994; Hafidi et al., 1996; Pirvola et al., 1997). Both neurotrophins are necessary for maintenance of the SGN population, because Ntf3 null mice lose ∼85%, BDNF null mice lose 7–15%, and BDNF/Ntf3 double-null mice lose all of their SGNs (Jones et al., 1994; Ernfors et al., 1995; Rubel and Fritzsch, 2002). Combined disruption of the cognate BDNF and Ntf3 receptors (Ntrk2 and Ntrk3, respectively) also results in complete loss of SGNs (Silos-Santiago et al., 1997), and incomplete deficiencies of these receptors lead to variable amounts of regional SGN loss (Fritzsch et al., 1998). In the AAN, an unusual twist in this scenario is that the trophic support would have to occur in an anterograde rather than retrograde manner. There is precedence for this phenomenon, because anterograde actions of Ntf3 have been described in the CNS, primarily in the visual system (von Bartheld et al., 1996; Wang et al., 2002; Butowt and von Bartheld, 2005; von Bartheld and Fritzsch, 2006).
Other trophic influences could also be involved in the maintenance of neurons in the spiral ganglion and AAN. For instance, the ablation of the CN could negatively impact the propagation of spontaneous activity between these regions. Spontaneous activity in the developing auditory system begins during embryogenesis (Lippe, 1994; Jones et al., 2001), but its role in development and trophism in these cell populations remains unknown. However, spontaneous activity has been demonstrated to be important for the correct differentiation and maintenance of neuronal subclasses in other regions of the CNS (Hanson and Landmesser, 2004). Other forms of trophism stemming from direct neuronal contact might also be important for the maintenance of these cell populations. Additional experiments are necessary to determine the relative contributions of these potential trophic interactions on the developing auditory system.
Evolutionary conservation of Atoh1 function
Our data provide additional support for the evolutionary conservation of Atoh1 function in the organization of the auditory system as a whole. In Drosophila, atonal is necessary and sufficient for specifying sensory neurons found in chordotonal organs (CHOs), which act as proprioceptors in the fly cuticle (Jarman et al., 1993). An array of CHOs make up Johnston's organ, a structure in the second antennal segment that is specialized for hearing; atonal-null flies lack this structure and are subsequently deaf. In mammals, there is recent evidence that Atoh1 may be expressed at low levels in a subset of SGNs (Matei et al., 2005), although the role this expression plays in this cell population is unknown. In contrast, Atoh1 is highly expressed by inner ear hair cells (which detect the auditory signal) and by neurons of the CN, LSO, and MSO. These cell groups contribute to the afferent auditory pathway and require Atoh1 for their specification, and their presence is necessary for SGN survival. In addition, we show that brainstem AAN neurons depend on the presence of Atoh1-lineal neurons in the CN for their maintenance. So, although the sites of Atoh1 expression have changed through evolutionary time, the gene is still required for the organization of both the peripheral and central auditory pathways.
In summary, we demonstrate that conditional deletion of Atoh1 from rhombomeres 3–5 results directly in deletion of neurons from the CN, LSO, and MSO and in secondary loss of neurons in the spiral ganglion and brainstem AAN. Thus, Egr2; Atoh1CKO and Hoxb1; Atoh1CKO mice represent novel model systems to examine perturbations of the central auditory system. Our findings may have relevance for understanding the extent to which malformations of and/or prenatal insults to the brainstem in human patients impair hearing and may help to provide insight into why cochlear implants in these patients sometimes prove unsuccessful.
Footnotes
This work was supported by National Institutes of Health Grants K08NS053419 (S.M.M.), K08DC006671 (J.S.O.), and R01DC005590 (B.F.), and H.Y.Z. is an investigator in the Howard Hughes Medical Institute. We thank Drs. Patrick Charnay (Egr2Cre) and Mario Capecchi (Hoxb1Cre) for generously sharing mouse lines with us, Dr. William Brownell, Dr. Sharyl Fyffe, and members of the Zoghbi laboratory for thoughtful discussions of the data and critical reading of this manuscript, and Bobbie Antalffy, Nancy Ao, Gabrielle Schuster, and Sukeshi Vaishnav for technical assistance. Mouse behavior testing was supported by the Baylor College of Medicine Mental Retardation and Developmental Disabilities Research Center (MRDDRC) Neurobehavioral Core. In situ hybridization was done by MRDDRC In Situ Hybridization Core (National Institutes of Health Grant HD024064), and confocal work was done at the MRDDRC Imaging Core, Case Western Reserve University Neurosciences Imaging Center, and Creighton University in part through a gift from the Roy J. Carver Foundation (B.F.).
References
- Agrawal Y, Platz EA, Niparko JK. Prevalence of hearing loss and differences by demographic characteristics among US adults: data from the National Health and Nutrition Examination Survey, 1999–2004. Arch Intern Med. 2008;168:1522–1530. doi: 10.1001/archinte.168.14.1522. [DOI] [PubMed] [Google Scholar]
- Akazawa C, Ishibashi M, Shimizu C, Nakanishi S, Kageyama R. A mammalian helix-loop-helix factor structurally related to the product of Drosophila proneural gene atonal is a positive transcriptional regulator expressed in the developing nervous system. J Biol Chem. 1995;270:8730–8738. doi: 10.1074/jbc.270.15.8730. [DOI] [PubMed] [Google Scholar]
- Arenkiel BR, Gaufo GO, Capecchi MR. Hoxb1 neural crest preferentially form glia of the PNS. Dev Dyn. 2003;227:379–386. doi: 10.1002/dvdy.10323. [DOI] [PubMed] [Google Scholar]
- Ben-Arie N, McCall AE, Berkman S, Eichele G, Bellen HJ, Zoghbi HY. Evolutionary conservation of sequence and expression of the bHLH protein Atonal suggests a conserved role in neurogenesis. Hum Mol Genet. 1996;5:1207–1216. doi: 10.1093/hmg/5.9.1207. [DOI] [PubMed] [Google Scholar]
- Bermingham NA, Hassan BA, Price SD, Vollrath MA, Ben-Arie N, Eatock RA, Bellen HJ, Lysakowski A, Zoghbi HY. Math1: an essential gene for the generation of inner ear hair cells. Science. 1999;284:1837–1841. doi: 10.1126/science.284.5421.1837. [DOI] [PubMed] [Google Scholar]
- Butowt R, von Bartheld CS. Anterograde axonal transport of BDNF and NT-3 by retinal ganglion cells: roles of neurotrophin receptors. Mol Cell Neurosci. 2005;29:11–25. doi: 10.1016/j.mcn.2005.02.004. [DOI] [PubMed] [Google Scholar]
- Cambronero F, Puelles L. Rostrocaudal nuclear relationships in the avian medulla oblongata: a fate map with quail chick chimeras. J Comp Neurol. 2000;427:522–545. doi: 10.1002/1096-9861(20001127)427:4<522::aid-cne3>3.0.co;2-y. [DOI] [PubMed] [Google Scholar]
- Carson JP, Thaller C, Eichele G. A transcriptome atlas of the mouse brain at cellular resolution. Curr Opin Neurobiol. 2002;12:562–565. doi: 10.1016/s0959-4388(02)00356-2. [DOI] [PubMed] [Google Scholar]
- Carson JP, Eichele G, Chiu W. A method for automated detection of gene expression required for the establishment of a digital transcriptome-wide gene expression atlas. J Microsc. 2005;217:275–281. doi: 10.1111/j.1365-2818.2005.01450.x. [DOI] [PubMed] [Google Scholar]
- Cramer KS, Fraser SE, Rubel EW. Embryonic origins of auditory brain-stem nuclei in the chick hindbrain. Dev Biol. 2000;224:138–151. doi: 10.1006/dbio.2000.9779. [DOI] [PubMed] [Google Scholar]
- Ernfors P, Van De Water T, Loring J, Jaenisch R. Complementary roles of BDNF and NT-3 in vestibular and auditory development. Neuron. 1995;14:1153–1164. doi: 10.1016/0896-6273(95)90263-5. [DOI] [PubMed] [Google Scholar]
- Farago AF, Awatramani RB, Dymecki SM. Assembly of the brainstem cochlear nuclear complex is revealed by intersectional and subtractive genetic fate maps. Neuron. 2006;50:205–218. doi: 10.1016/j.neuron.2006.03.014. [DOI] [PubMed] [Google Scholar]
- Friauf E, Lohmann C. Development of auditory brainstem circuitry. Activity-dependent and activity-independent processes. Cell Tissue Res. 1999;297:187–195. doi: 10.1007/s004410051346. [DOI] [PubMed] [Google Scholar]
- Fritzsch B, Barbacid M, Silos-Santiago I. The combined effects of trkB and trkC mutations on the innervation of the inner ear. Int J Dev Neurosci. 1998;16:493–505. doi: 10.1016/s0736-5748(98)00043-4. [DOI] [PubMed] [Google Scholar]
- Fritzsch B, Muirhead KA, Feng F, Gray BD, Ohlsson-Wilhelm BM. Diffusion and imaging properties of three new lipophilic tracers, NeuroVue Maroon, NeuroVue Red and NeuroVue Green and their use for double and triple labeling of neuronal profile. Brain Res Bull. 2005;66:249–258. doi: 10.1016/j.brainresbull.2005.05.016. [DOI] [PMC free article] [PubMed] [Google Scholar]
- Griffiths TD. Central auditory pathologies. Br Med Bull. 2002;63:107–120. doi: 10.1093/bmb/63.1.107. [DOI] [PubMed] [Google Scholar]
- Hafidi A, Moore T, Sanes DH. Regional distribution of neurotrophin receptors in the developing auditory brainstem. J Comp Neurol. 1996;367:454–464. doi: 10.1002/(SICI)1096-9861(19960408)367:3<454::AID-CNE10>3.0.CO;2-H. [DOI] [PubMed] [Google Scholar]
- Hanson MG, Landmesser LT. Normal patterns of spontaneous activity are required for correct motor axon guidance and the expression of specific guidance molecules. Neuron. 2004;43:687–701. doi: 10.1016/j.neuron.2004.08.018. [DOI] [PubMed] [Google Scholar]
- Harrison JM, Irving R. Ascending connections of the anterior ventral cochlear nucleus in the rat. J Comp Neurol. 1966;126:51–63. doi: 10.1002/cne.901260105. [DOI] [PubMed] [Google Scholar]
- Hendry IA. A method to correct adequately for the change in neuronal size when estimating neuronal numbers after nerve growth factor treatment. J Neurocytol. 1976;5:337–349. doi: 10.1007/BF01175119. [DOI] [PubMed] [Google Scholar]
- Ino H. Immunohistochemical characterization of the orphan nuclear receptor ROR alpha in the mouse nervous system. J Histochem Cytochem. 2004;52:311–323. doi: 10.1177/002215540405200302. [DOI] [PubMed] [Google Scholar]
- Jarman AP, Grau Y, Jan LY, Jan YN. atonal is a proneural gene that directs chordotonal organ formation in the Drosophila peripheral nervous system. Cell. 1993;73:1307–1321. doi: 10.1016/0092-8674(93)90358-w. [DOI] [PubMed] [Google Scholar]
- Jones KR, Fariñas I, Backus C, Reichardt LF. Targeted disruption of the BDNF gene perturbs brain and sensory neuron development but not motor neuron development. Cell. 1994;76:989–999. doi: 10.1016/0092-8674(94)90377-8. [DOI] [PMC free article] [PubMed] [Google Scholar]
- Jones TA, Jones SM, Paggett KC. Primordial rhythmic bursting in embryonic cochlear ganglion cells. J Neurosci. 2001;21:8129–8135. doi: 10.1523/JNEUROSCI.21-20-08129.2001. [DOI] [PMC free article] [PubMed] [Google Scholar]
- Leake PA, Snyder RL, Merzenich MM. Topographic organization of the cochlear spiral ganglion demonstrated by restricted lesions of the anteroventral cochlear nucleus. J Comp Neurol. 1992;320:468–478. doi: 10.1002/cne.903200405. [DOI] [PubMed] [Google Scholar]
- Lippe WR. Rhythmic spontaneous activity in the developing avian auditory system. J Neurosci. 1994;14:1486–1495. doi: 10.1523/JNEUROSCI.14-03-01486.1994. [DOI] [PMC free article] [PubMed] [Google Scholar]
- Lurie DI, Pasic TR, Hockfield SJ, Rubel EW. Development of Cat-301 immunoreactivity in auditory brainstem nuclei of the gerbil. J Comp Neurol. 1997;380:319–334. doi: 10.1002/(sici)1096-9861(19970414)380:3<319::aid-cne3>3.0.co;2-5. [DOI] [PubMed] [Google Scholar]
- Machold R, Fishell G. Math1 is expressed in temporally discrete pools of cerebellar rhombic-lip neural progenitors. Neuron. 2005;48:17–24. doi: 10.1016/j.neuron.2005.08.028. [DOI] [PubMed] [Google Scholar]
- Marín F, Puelles L. Morphological fate of rhombomeres in quail/chick chimeras: a segmental analysis of hindbrain nuclei. Eur J Neurosci. 1995;7:1714–1738. doi: 10.1111/j.1460-9568.1995.tb00693.x. [DOI] [PubMed] [Google Scholar]
- Matei V, Pauley S, Kaing S, Rowitch D, Beisel KW, Morris K, Feng F, Jones K, Lee J, Fritzsch B. Smaller inner ear sensory epithelia in Neurog 1 null mice are related to earlier hair cell cycle exit. Dev Dyn. 2005;234:633–650. doi: 10.1002/dvdy.20551. [DOI] [PMC free article] [PubMed] [Google Scholar]
- Moore DR. Auditory brainstem of the ferret: early cessation of developmental sensitivity of neurons in the cochlear nucleus to removal of the cochlea. J Comp Neurol. 1990;302:810–823. doi: 10.1002/cne.903020412. [DOI] [PubMed] [Google Scholar]
- Moore DR. Trophic influences of excitatory and inhibitory synapses on neurones in the auditory brain stem. Neuroreport. 1992;3:269–272. doi: 10.1097/00001756-199203000-00014. [DOI] [PubMed] [Google Scholar]
- Pasic TR, Moore DR, Rubel EW. Effect of altered neuronal activity on cell size in the medial nucleus of the trapezoid body and ventral cochlear nucleus of the gerbil. J Comp Neurol. 1994;348:111–120. doi: 10.1002/cne.903480106. [DOI] [PubMed] [Google Scholar]
- Pirvola U, Hallböök F, Xing-Qun L, Virkkala J, Saarma M, Ylikoski J. Expression of neurotrophins and Trk receptors in the developing, adult, and regenerating avian cochlea. J Neurobiol. 1997;33:1019–1033. doi: 10.1002/(sici)1097-4695(199712)33:7<1019::aid-neu11>3.0.co;2-a. [DOI] [PubMed] [Google Scholar]
- Postigo A, Calella AM, Fritzsch B, Knipper M, Katz D, Eilers A, Schimmang T, Lewin GR, Klein R, Minichiello L. Distinct requirements for TrkB and TrkC signaling in target innervation by sensory neurons. Genes Dev. 2002;16:633–645. doi: 10.1101/gad.217902. [DOI] [PMC free article] [PubMed] [Google Scholar]
- Powell TP, Erulkar SD. Transneuronal cell degeneration in the auditory relay nuclei of the cat. J Anat. 1962;96:249–268. [PMC free article] [PubMed] [Google Scholar]
- Rubel EW, Fritzsch B. Auditory system development: primary auditory neurons and their targets. Annu Rev Neurosci. 2002;25:51–101. doi: 10.1146/annurev.neuro.25.112701.142849. [DOI] [PubMed] [Google Scholar]
- Schecterson LC, Bothwell M. Neurotrophin and neurotrophin receptor mRNA expression in developing inner ear. Hear Res. 1994;73:92–100. doi: 10.1016/0378-5955(94)90286-0. [DOI] [PubMed] [Google Scholar]
- Sekiya T, Yagihashi A, Shimamura N, Asano K, Suzuki S, Matsubara A, Namba A, Shinkawa H. Apoptosis of auditory neurons following central process injury. Exp Neurol. 2003;184:648–658. doi: 10.1016/S0014-4886(03)00288-7. [DOI] [PubMed] [Google Scholar]
- Shroyer NF, Helmrath MA, Wang VY, Antalffy B, Henning SJ, Zoghbi HY. Intestine-specific ablation of mouse atonal homolog 1 (Math1) reveals a role in cellular homeostasis. Gastroenterology. 2007;132:2478–2488. doi: 10.1053/j.gastro.2007.03.047. [DOI] [PubMed] [Google Scholar]
- Silos-Santiago I, Fagan AM, Garber M, Fritzsch B, Barbacid M. Severe sensory deficits but normal CNS development in newborn mice lacking TrkB and TrkC tyrosine protein kinase receptors. Eur J Neurosci. 1997;9:2045–2056. doi: 10.1111/j.1460-9568.1997.tb01372.x. [DOI] [PubMed] [Google Scholar]
- Soriano P. Generalized lacZ expression with the ROSA26 Cre reporter strain. Nat Genet. 1999;21:70–71. doi: 10.1038/5007. [DOI] [PubMed] [Google Scholar]
- Spoendlin H. Degeneration behaviour of the cochlear nerve. Arch Klin Exp Ohren Nasen Kehlkopfheilkd. 1971;200:275–291. doi: 10.1007/BF00373310. [DOI] [PubMed] [Google Scholar]
- Trune DR. Influence of neonatal cochlear removal on the development of mouse cochlear nucleus. I. Number, size, and density of its neurons. J Comp Neurol. 1982;209:409–424. doi: 10.1002/cne.902090410. [DOI] [PubMed] [Google Scholar]
- Visel A, Thaller C, Eichele G. GenePaint.org: an atlas of gene expression patterns in the mouse embryo. Nucleic Acids Res. 2004;32:D552–D556. doi: 10.1093/nar/gkh029. [DOI] [PMC free article] [PubMed] [Google Scholar]
- Voiculescu O, Charnay P, Schneider-Maunoury S. Expression pattern of a Krox-20/Cre knock-in allele in the developing hindbrain, bones, and peripheral nervous system. Genesis. 2000;26:123–126. doi: 10.1002/(sici)1526-968x(200002)26:2<123::aid-gene7>3.0.co;2-o. [DOI] [PubMed] [Google Scholar]
- von Bartheld CS, Fritzsch B. Comparative analysis of neurotrophin receptors and ligands in vertebrate neurons: tools for evolutionary stability or changes in neural circuits? Brain Behav Evol. 2006;68:157–172. doi: 10.1159/000094085. [DOI] [PubMed] [Google Scholar]
- von Bartheld CS, Byers MR, Williams R, Bothwell M. Anterograde transport of neurotrophins and axodendritic transfer in the developing visual system. Nature. 1996;379:830–833. doi: 10.1038/379830a0. [DOI] [PubMed] [Google Scholar]
- Wang VY, Rose MF, Zoghbi HY. Math1 expression redefines the rhombic lip derivatives and reveals novel lineages within the brainstem and cerebellum. Neuron. 2005;48:31–43. doi: 10.1016/j.neuron.2005.08.024. [DOI] [PubMed] [Google Scholar]
- Wang X, Butowt R, Vasko MR, von Bartheld CS. Mechanisms of the release of anterogradely transported neurotrophin-3 from axon terminals. J Neurosci. 2002;22:931–945. doi: 10.1523/JNEUROSCI.22-03-00931.2002. [DOI] [PMC free article] [PubMed] [Google Scholar]
- Willott J, editor. Handbook of mouse auditory research: from behavior to molecular biology. Boca Raton, FL: CRC; 2001. [Google Scholar]
- Xia A, Visosky AM, Cho JH, Tsai MJ, Pereira FA, Oghalai JS. Altered traveling wave propagation and reduced endocochlear potential associated with cochlear dysplasia in the BETA2/NeuroD1 null mouse. J Assoc Res Otolaryngol. 2007;8:447–463. doi: 10.1007/s10162-007-0092-9. [DOI] [PMC free article] [PubMed] [Google Scholar]
- Yao W, Godfrey DA. Immunohistochemical evaluation of cholinergic neurons in the rat superior olivary complex. Microsc Res Tech. 1998;41:270–283. doi: 10.1002/(SICI)1097-0029(19980501)41:3<270::AID-JEMT10>3.0.CO;2-L. [DOI] [PubMed] [Google Scholar]
- Yaylaoglu MB, Titmus A, Visel A, Alvarez-Bolado G, Thaller C, Eichele G. Comprehensive expression atlas of fibroblast growth factors and their receptors generated by a novel robotic in situ hybridization platform. Dev Dyn. 2005;234:371–386. doi: 10.1002/dvdy.20441. [DOI] [PubMed] [Google Scholar]
- Ylikoski J, Pirvola U, Moshnyakov M, Palgi J, Arumäe U, Saarma M. Expression patterns of neurotrophin and their receptor mRNAs in the rat inner ear. Hear Res. 1993;65:69–78. doi: 10.1016/0378-5955(93)90202-c. [DOI] [PubMed] [Google Scholar]