

Abstract
Reticulon 3 (RTN3) was initially identified as a negative modulator of BACE1, an enzyme that cleaves amyloid precursor protein (APP) to release β-amyloid peptide. Interestingly, RTN3 can also form aggregates after accumulation, and increased RTN3 aggregation correlates with the formation of RTN3 immunoreactive dystrophic neurites (RIDNs) in brains of Alzheimer's cases. Transgenic mice expressing RTN3 alone develop RIDNs in their hippocampus but not in their cortex. To determine the in vivo effects of RTN3 and preformed RIDNs on amyloid deposition, we crossed bitransgenic mice expressing APP and presenilin 1 (PS1) mutations with mice overexpressing RTN3. We found that amyloid deposition in cortex, the hippocampal CA3 region, and dentate gyrus was significantly reduced in triple transgenic mice compared with bitransgenic controls. However, reduction of amyloid deposition in the hippocampal CA1 region, where RIDNs predominantly formed before amyloid deposition, was less significant. Hence, preformed RTN3 aggregates in RIDNs clearly offset the negative modulation of BACE1 activity by RTN3. Furthermore, our study indicates that the increased expression of RTN3 could result in an alteration of BACE1 intracellular trafficking by retaining more BACE1 in the endoplasmic reticulum compartment where cleavage of APP by BACE1 is less favored. Our results suggest that inhibition of RTN3 aggregation is likely to be beneficial by reducing both amyloid deposition and the formation RIDNs.
Introduction
Neuritic plaques, a hallmark of Alzheimer's disease (AD) pathology, refer to β-amyloid peptide (Aβ) deposits surrounded by activated microglia, reactive astrocytes, and dystrophic neurites (Tanzi and Bertram, 2005). Dystrophic neurites with the characteristic morphology of swollen dendrites and/or axons are recognizable by antibodies specific to various proteins including ubiquitin (Kowall and Kosik, 1987; Perry et al., 1987; Onorato et al., 1989), neurofilament (Dickson et al., 1999), and GAP-43 (Masliah et al., 1992). We have recently demonstrated that a distinct population of dystrophic neurites, marked by an antibody specific to reticulon 3 (RTN3), represents more abundant dystrophic neurites (Hu et al., 2007). At the current stage, the spatial and temporal relationship among dystrophic neurites that are immunoreactive to different antibodies remains unclear.
The formation of dystrophic neurites is often regarded as an event downstream to amyloid deposition, because transgenic mice expressing familial mutant amyloid precursor protein (APP) produce dystrophic neurites that surround amyloid plaques (Games et al., 1995; Holcomb et al., 1998). However, dystrophic neurites are not commonly found to surround Aβ deposits in a diffused form (Joachim et al., 1989), suggesting that Aβ alone may not be sufficient to trigger the formation of various dystrophic neurites in human. Whether dystrophic neurites will form before amyloid deposition and whether the occurrence of dystrophic neurites will affect the formation of amyloid deposition are important questions to be answered. In this study, we have addressed these questions by using an animal model overexpressing RTN3.
RTN3 is a member of the reticulon (RTN) family of proteins that have demonstrated neurological functions (Oertle and Schwab, 2003; Yan et al., 2006). We and others have shown that RTN proteins, particularly neuronal RTN3, interact with BACE1, and that this interaction negatively modulates BACE1 cleavage of APP (He et al., 2004, 2006; Murayama et al., 2006; Wojcik et al., 2007). While examining the in vivo role of RTN3 in AD pathogenesis, we also found that RTN3 is enriched in RTN3 immunoreactive dystrophic neurites (RIDNs) in AD brains. More importantly, transgenic mice overexpressing RTN3 (Tg-RTN3) develop RIDNs predominantly in their hippocampi (Hu et al., 2007), and this correlates with the formation of RTN3 aggregates in susceptible brain regions. Because of this unique feature present in this animal model, we asked two important questions in this study: (1) whether increased expression of RTN3 would reduce amyloid deposition via negative modulation of BACE1 activity; (2) whether preformed RIDNs in this model would affect amyloid deposition because of the presence of RTN3 aggregation. To address these questions, Tg-RTN3 mice were bred with transgenic mice expressing Swedish mutant APP and mutant presenilin 1 (PS1). The brain samples from the triplegenic mice were compared with the parental bigenic mice. Although RTN3 overexpression reduced amyloid deposition in most brain areas, the aggregated RTN3 in preformed RIDNs reduced the negative modulation of BACE1 activity by RTN3. The knowledge from this study has advanced our understanding of the in vivo role of RTN3 in AD pathogenesis and also of the impact of dystrophic neurites on amyloid deposition.
Materials and Methods
Mouse strains, cell lines, and biochemical reagents.
Tg-RTN3 mice were generated in the laboratory as described previously (Hu et al., 2007). Briefly, Tg-APPsw/PSEN1DE9 mice (Tg-PA) were purchased from Jackson Laboratory (stock #004462). Tg-RTN3;APPsw/PSEN1DE9 mice (Tg-R3PA) were generated by crossing of Tg-RTN3 mice with APPsw/PSEN1DE9 mice. All mice in the study were maintained and used according to the protocols approved by the Institutional Animal Care and Use Committee at the Cleveland Clinic. HR3M cells were the HEK-293-derived cells that stably expressed myc-tagged RTN3 (He et al., 2004). HM cells were the HEK-293-derived cells that stably expressed HA-tagged BACE1 (Qahwash et al., 2003). Antibodies against β-amyloid peptide (6E10), calnexin (C4731), myc tag, β-actin (A5441), and APP C terminus (A8717) were purchased from Sigma-Aldrich. Antibodies R454 and R458 recognized the N terminus and C terminus of RTN3, respectively, and were generated by the laboratory (He et al., 2004). The antibody against BACE1, B279 was made by the laboratory, and the 3d5 antibody was a generous gift from Dr. Robert Vassar (Northwestern University Feinberg School of Medicine, Chicago, IL). Alexa Fluor 488- and 568-labeled secondary antibodies were purchased from Invitrogen. DAB (3,3′ diaminobenzidine tetrahydrochloride, D5905) and thioflavine S were purchased from Sigma-Aldrich. Avidin biotin complex elite kit was purchased from Vector Laboratories. Complete protease inhibitor tablet was purchased from Roche Biosciences. Bis–Tris NuPage gels (4–12% and 12%) and Tris-glycine gels (16%) were purchased from Invitrogen. Super Signal West Pico kit and cell surface protein biotinylation kits were purchased from Pierce.
Immunohistochemistry, immuno-confocal microscopy, and quantification.
Immunohistochemical and confocal experiments were performed according to standard methods as described previously (He et al., 2007). Briefly, the right half of brains of Tg-R3PA and Tg-PA mice (180 d old) were sagittally sectioned at 16 μm thickness using a cryostat after 4% paraformaldehyde fixation and O.C.T. embedding. In immunohistochemical staining, the fixed brain sagittal sections were initially reacted with anti-Aβ monoclonal antibody 6E10, and subsequently detected by the complex of HRP-conjugated secondary antibody and DAB. Thioflavine S staining was performed as follows. After an initial wash in distilled water, prefixed frozen brain sections were incubated in 0.3% Triton X-100 in PBS (1×) for 30 min. After an additional wash in water, the sections were stained with 1% Thioflavine S in water. Then, the stained sections were incubated in 70% ethanol for 5 min, washed again, mounted with Vecta Shield mounting media, and examined using Leica fluorescence microscopy and software Magna FIRE. For the Aβ plaque examination, 16 brain sagittal sections (160 μm apart) per mouse were immunolabeled. Aβ deposition was detected with primary antibody 6E10 (1:1000 dilution) and secondary antibody anti-mouse IgG conjugated with Alexa Fluor 568 (1:2000 dilution). Both cellular RTN3 and RIDNs were detected with primary antibody R458 (1:1000 dilution) and secondary antibody anti-rabbit IgG conjugated with Alexa Fluor 488 (1:1000 dilution). The images were examined and captured with a Leica confocal microscope. Laser 581 nm was used for Alexa Fluor 568 and the fluorescence signals were displayed in the red channel, whereas laser 488 nm was used for Alexa Fluor 488, and results were visualized in green channel.
Quantification of β-amyloid plaques was conducted on the images captured from brain sagittal sections stained with antibody 6E10 by either immunohistochemical or immunoconfocal staining (Borchelt et al., 1997). Sections of each mouse brain were imaged and the areas and densities of the plaques were measured by the NIH ImageJ software. The total counts of neuritic Aβ plaques in 16 sections per mouse brain were determined in an unbiased manner (Dong et al., 2004). Group means of plaque numbers were calculated based on a sum of the counts from individual animals in each group. The β-amyloid plaque area (plaque load) was determined and the images captured with a Leica confocal microscope (20× objective) and quantified using the NIH ImageJ software as a percentage of either total cerebral cortical area or hippocampal area or subhippocampal area from eight sections in each animal. An intensity threshold level was established for discrimination between plaque immunoreactivity and background labeling. The threshold for detection was held constant throughout the image quantification. Vascular signals were excluded in the analysis.
Statistical analysis was performed using GraphPad Prism. One-tailed Student's t test was used to calculate statistical significance between two groups of data. One-way ANOVA was performed when statistical analysis involves three or more groups. F test is automatically conducted by the software.
Quantification of Aβ peptides using ELISA.
The insoluble Aβ1–40 and Aβ1–42 were extracted from the aggregated Aβ1–40 and Aβ1–42 in the brain tissues by the guanidine hydrochloride method (Wang et al., 2006). The levels of Aβ1–40 and Aβ1–42 in the left cerebral cortex and hippocampus were separately analyzed using sandwich ELISA according to laboratory standards as previously described (Yan et al., 1999).
Western blot analysis of brain proteins.
Frozen dissected tissues of mouse brains were used for Western blot analysis. Brain tissues were homogenized in 1% CHAPS dissolved in (1×) PBS solution, Roche complete protease inhibitors (1×) and 0.1 mm phosphatase inhibitor Na3VO4 on ice. Total proteins were extracted from the homogenates by rotating on a rotator for 30 min at 4°C. After centrifugation at 15,000 × g for 120 min, supernatants were collected. Total protein concentrations of the supernatants were determined with the BCA protein assay reagent (Pierce). Equal amounts of the supernatant (40 μg of total protein) were resolved on 4–12% Bis–Tris NuPage gels followed by standard Western blotting with indicated antibodies. Chemiluminescent signals for proteins on Western blots were scanned and their integrated density values were calculated with a chemiluminescent imaging system (Alpha Innotech).
Subcellular fractionation.
The HR3M and HEK293 cell lines were first grown in DMEM media for 24 h in 10 mm plates to ∼70% confluence, and then cells were transfected with BACE1-expressing plasmid DNA for 24 h using the Lipofectamine transfection reagent according to the manufacturer's guidelines. Transfected cells were subjected to subcellular fractionation on a sucrose gradient according to procedures described previously (Yan et al., 2001). The gradients were centrifuged at 22,000 rpm for 18 h at 4°C in a Beckman SW41Ti rotor. Fractions (12 × 1 ml) were collected from the top of the gradient and the distributions of BACE1, RTN3, and APP along the gradient were analyzed by Western blot. Antibodies B279, APP C-terminal, and R458 were used for detection of BACE1, APP, and RTN3, respectively. Antibodies against calnexin, β-COP, TGN38, and EEA1 were used to indicate the compartments of endoplasmic reticulum (ER), Golgi, and early endosomes, respectively. Alternatively, HM cells were transfected with either empty vector or RTN3, and subcellular compartments of transfected cells were fractionated on a iodixanol gradient according to published procedures (Xia et al., 1998).
Cell surface protein biotinylation.
Detection of RTN3 on the cell surface was performed in two different experimental conditions. First, BACE1 expression plasmid vector was transiently transfected in both HEK-293 cells and HR3M cells to enhance detection of BACE1 because of the existing low detection sensitivity of BACE1 antibody. After 24 h transfection, cell surface proteins were biotinylated by incubation of the live transfected cells with 0.25 mg/ml EZ-Link Sulfo-NHS-SS-Biotin at 22°C, as described previously (Yan et al., 2001). Briefly, after quenching and washing, biotinylated cells were lysed in lysis buffer (20 mm HEPES at pH 7.9, 10 mm KCl, 1 mm EDTA, 1 mm EGTA, 1% Nonidet NP-40, 10% glycerol and protease inhibitors) at 4°C for 30 min on rotator and centrifuged for 5 min at 15,000 × g. Supernatants were collected as total proteins. Portions of the total proteins were used in the neutravidin pull-down experiment to isolate biotinylated surface proteins. The total proteins and the surface proteins were then resolved on 12% Bis–Tris NuPage gels and analyzed by Western blotting. In the second experiment, BACE1-expressing HM cells were transfected with 10 μg of either empty vector DNA or RTN3-expressing vector DNA for 48 h. Biotinylation and pull-down experiments were performed according to the same above procedures. Western blot analysis was performed as outlined above.
Results
Altered APP processing in RTN3 transgenic mice
We have previously shown that overexpression of RTN3 increases its interaction with BACE1, thereby sequestering BACE1 to cleave its APP substrate (He et al., 2004). This finding led us to hypothesize that RTN3 plays a role in AD via suppressing Aβ production and reducing amyloid deposition in vivo. To test our hypothesis, we first generated transgenic mice overexpressing RTN3 driven by a mouse prion gene promoter. As described recently (Hu et al., 2007), among three lines of generated Tg-RTN3 mice, line 3 (L3) mice express the highest levels of the RTN3 transgene. Western blot analysis of protein lysates from this line of mice showed that the levels of RTN3 in Tg-RTN3 mice were ∼4-fold higher than that in wild-type mice (Fig. 1A). BACE1 levels were not noticeably affected by the increased expression of RTN3 in this line of mice (Fig. 1A). Similarly, the levels of high molecular weight APP species were also comparable in both genotypes of mice (Fig. 1A). However, the levels of CTF99, a C-terminal fragment of APP cleaved by BACE1, were slightly reduced (Fig. 1A). When the ratio of CTF99 over APP was calculated, there was a clear reduction of CTF99 levels in Tg-RTN3 mice (0.18 ± 0.02 vs 0.11 ± 0.01; n = 3, p < 0.001). When the ratio of CTF99 over CTF83, which contained CTF89, was calculated, this reduction of CTF99 was also obvious (0.14 ± 0.02 vs 0.07 ± 0.01; p < 0.001, n = 3). APP was also cleaved by BACE1 at the β' site to produce CTF89 (Huse et al., 2002; Tomasselli et al., 2003). However, under some electrophoresis conditions, CTF89 was often inseparable from CTF83, a C-terminal membrane bound product of APP after cleavage by α-secretase within the Aβ domain (compare Fig. 1 with supplemental Fig. 1, available at www.jneurosci.org as supplemental material). Together, these data indicate that higher in vivo RTN3 levels cause reduced cleavage of APP by BACE1. Interestingly, the reduction of CTF99 levels was only repeatedly seen in lysates prepared from the cerebral cortex of Tg-RTN3 mice, and was less obvious in lysates from the hippocampus (Fig. 1B) (CTF99/APP: 0.12 ± 0.02 in Tg-R3PA vs 0.09 ± 0.01 in Tg-PA; p < 0.05, n = 3). This phenomenon of regional disparity will be further discussed below.
Figure 1.

APP processing in RTN3 transgenic mice. A, Equal amounts of protein extracts from wild-type (WT) and transgenic mice expressing human RTN3 cDNA (Tg-RTN3) were analyzed by Western blotting. Antibody R458 recognizes the C terminus of RTN3, and higher levels of RTN3 were found in Tg-RTN3 samples. BACE1 is detected with antibody B279. Antibody A8717, specific to the APP C terminus, was used to detect full-length APP, its CTF99 and CTF83 fragments. Antibody recognizing calnexin was used to verify equal loading. The protein levels of full-length APP were normalized to calnexin level and the ratios of CTF99 to CTF83 or full-length APP were plotted to reflect the reduced levels of CTF99 in Tg-RTN3 cortex. These results were summarized from three independent experiments and demonstrated that in the Tg-RTN3 mice the ratio of CTF99 to CTF83 was reduced (p < 0.001), as was the ratio of CTF99 over APP (p < 0.001). However, there appeared to be very little difference in APP levels between WT and Tg-RTN3. B, The protein lysates from the hippocampus were analyzed in the same manner as in the cortex (A), but the reduction of CTF99 levels in the Tg-RTN3 hippocampal samples was less significant compared with the WT controls.
Expression of transgenic RTN3 had differential effects on Aβ deposition in cerebrum and hippocampus
Since amyloid deposition has never been formed in mice expressing only endogenous APP, we bred Tg-RTN3 L3 mice with the Tg-APPswe/PSEN1ΔE9 bitransgenic mice (abbreviated as Tg-PA mice) to generate Tg-RTN3/APPswe/PSEN1ΔE9 triple transgenic mice (abbreviated as Tg-R3PA) to determine whether increased expression of RTN3 would affect amyloid deposition. Tg-PA mice express both the familial mutant PS1 with a deletion of exon 9 and the Swedish mutant APP under the control of a prion promoter, and this line of mice is widely used as an AD model to replicate amyloid deposition in animals (Borchelt et al., 1997). Examination of triple transgenic mice (Tg-R3PA) allowed us to detect the effect of RTN3 on Aβ production and amyloid deposition compared with the Tg-PA mice, which normally develop amyloid plaques at 6 months of age. On reaching 6 months of age (exactly at 180 d), Tg-PA and Tg-R3PA mice were killed and their brains were collected for both biochemical and immunohistochemical examinations that included measuring Aβ levels by ELISA and quantification of Aβ plaque density. To minimize the potential gender effect on Aβ production and amyloid deposition, only female mice were recruited in our present biochemical and immunohistochemical studies. To obtain consistency, the left half of brains of both Tg-PA mice and Tg-R3PA mice were used for biochemical assays, and the right half was used for immunohistochemical analysis.
In immunohistochemical staining of fixed brain sagittal sections, Aβ deposits in the cerebral cortex of Tg-R3PA mice, detected by monoclonal antibody 6E10 that specifically reacts with human Aβ N-terminal region, were visibly fewer than those in the comparable cortical region of Tg-PA mice (Fig. 2A,B). However, the reduction in the number of condensed Aβ deposits in the entire hippocampus of Tg-R3PA mice was less significant (Fig. 2A,B).
Figure 2.

Reduced Aβ deposition in the brains of Tg-R3PA mice. A, B, Immunohistochemical analysis of condensed Aβ deposits in sagittal brain sections of 6-month-old Tg-PA (A) and Tg-R3PA mice (B) using antibody 6E10. Compared with Tg-PA mice, condensed Aβ deposits were significantly reduced in the cortex but the reduction was less obvious in the hippocampus of Tg-R3PA mice compared with Tg-PA mice. The foci of neuritic plaques were quantitatively analyzed based on manual counts of Aβ-immunoreactive deposits in sagittal sections of Tg-PA and Tg-R3PA brains under immunoconfocal microscopy. Sixteen sagittal sections (140 μm apart) from each Tg-PA mouse (n = 4) and Tg-R3PA mouse (n = 5) were examined. The average number of plaque counts for each mouse group is expressed as the number of neuritic plaques ± SEM (p < 0.01, unpaired t test). C, Reduced Aβ plaque load in Tg-R3PA mice. The Aβ plaque load was determined as a percentage of the area occupied by Aβ-immunoreactive condensed deposits in the total examined area. The imaging data for Aβ plaque load were collected form the same immunofluorescence-stained sections that were used for counting of plaque numbers (red channel), and analyzed with ImageJ software when only the red channel was turned on (p < 0.05, unpaired t test). D–G, Brain sagittal sections were also stained with the compound thioflavin S. Aggregated Aβ deposits in the cerebrum of the Tg-R3PA (E) were significantly reduced compared with the same area of Tg-PA mice (D). In contrast, the reduction was less significant in the hippocampal area of Tg-PA (F) and Tg-R3PA mice (G). ctx, Cerebral cortex; hipp, hippocampus. Scale bars: A, B, 0.5 mm; (in G) D-G, 0.2 mm.
Quantification of Aβ plaque numbers in the cerebral cortex and hippocampus of Tg-R3PA and Tg-PA mice revealed that the average number of cortical neuritic Aβ plaques was 661.2 ± 148.2 in 16 brain sagittal sections of Tg-R3PA mice (140 μm apart between two sections; n = 4), which is significantly lower than the corresponding plaque number of 1605 ± 177.4 in the comparable sections of Tg-PA mice (n = 5) (reduced by 55.5%; p < 0.01, unpaired t test). In addition, we also determined the area occupied by the compact Aβ plaques using ImageJ software to quantify Aβ plaque density or load. Our result showed that 0.342 ± 0.0743% of the examined frontal cerebral cortex of PA mice was occupied by condensed Aβ deposition, whereas only 0.124 ± 0.0567% of the examined area of R3PA mice was occupied by condensed Aβ deposition (Fig. 2C) (decreased by 63.8%; p < 0.05, unpaired t test).
To further confirm the above observation, we stained Aβ plaques by another commonly used method, thioflavin-S staining, and the results also showed fewer plaques in the cortical region of Tg-R3PA mice than in the corresponding region of Tg-PA mice (Fig. 2D–G). The difference in the hippocampal regions was smaller (Fig. 2F,G), consistent with the above immunohistochemical staining results.
Clearly, a differential effect of RTN3 on amyloid deposition exists, consistent with the altered CTF99 levels in Tg-RTN3 mice. To our knowledge, this regional differential effect on Aβ deposition appears unique considering the fact that expression of the RTN3 transgene in these two regions is similar. This differential effect suggests the presence of additional factors in either cerebrum or hippocampus that led to this disparity. Based on our observation that RIDNs were spontaneously produced mainly in the hippocampus but not in the cerebrum of Tg-RTN3 mice (Hu et al., 2007), we speculated that the preformation of RIDNs might have caused this regional disparity.
Effect of preformed RIDNs on Aβ deposition
To add further support to our above hypothesis, we performed confocal examination by double-labeling using monoclonal antibody 6E10 to detect amyloid plaques and RTN3-C terminus-specific antibody R458 to detect RIDNs. We found that large amounts of dispersed RIDNs were found only in the Tg-R3PA hippocampal CA1 area, spreading to CA3 with a few also identified in the dentate gyrus (Fig. 3D). RIDNs in these areas were first formed at the age of 3 months (Shi et al., 2009). Dispersed RIDNs were scarce in the cortex at this age (Fig. 3A,B), consistent with our previous report (Hu et al., 2007). Noticeably, increased expression of RTN3 actually promoted formation of RIDNs in surrounding amyloid deposits (Fig. 3B, arrow). Overall, the size of amyloid plaques was larger in Tg-PA mice than in Tg-R3PA mice, whereas RIDNs were more obvious in Tg-R3PA mice than in Tg-PA mice (Fig. 3).
Figure 3.
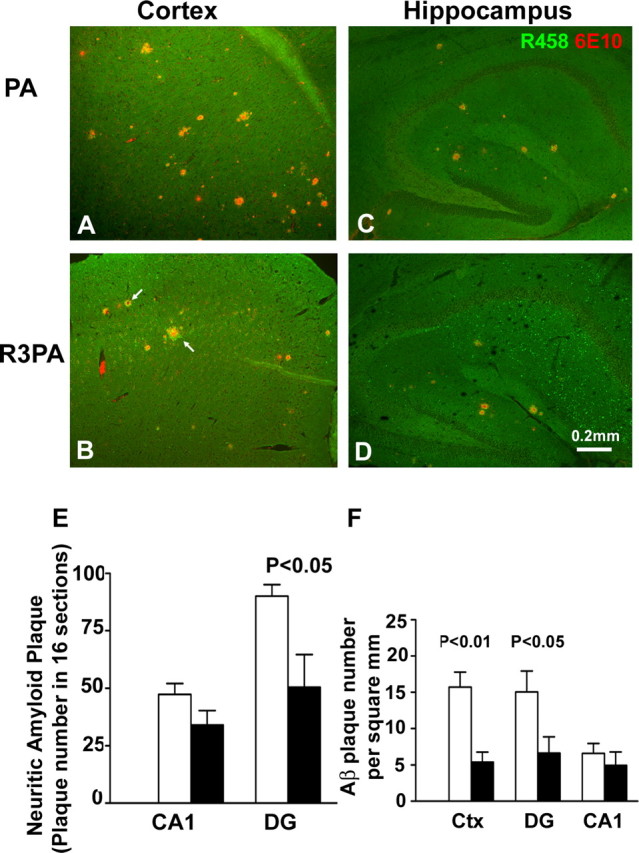
Reduced neuritic plaques in the cerebral cortex of Tg-R3PA mice. A–D, Immunoconfocal analysis of condensed Aβ deposition in the hippocampus of Tg-PA and Tg-R3PA mice 6 months of age using antibody 6E10 against Aβ (red) and antibody R458 against RTN3 C terminus (green). Compared with Tg-PA mice, Tg-R3PA mice had a significantly lower amount of Aβ neuritic plaques in the cerebral cortex (A, B), but this reduction was less significant in their hippocampi (C, D). Noticeably, Tg-R3PA mice developed RIDNs largely in the CA1 region with a small spread to the CA3 and dentate gyrus regions, whereas Tg-PA mice did not produce a similar type of dispersed RIDNs. Although no dispersed RIDNs were found in the cortical region of either Tg-R3PA or Tg-PA mice, amyloid plaques in Tg-R3PA samples were visibly surrounded with more RIDNs as specified by arrows. E, The similarly labeled foci of neuritic plaques were quantitatively analyzed based on the indicated hippocampal subregions of Tg-PA and Tg-R3PA brains (p < 0.05, unpaired t test). F, The plaque numbers occupied per square mm of examined sections were also plotted to show the consistent reduction of amyloid plaques in the Tg-R3PA cortex but not in the CA1 region. Open bar represents PA mice and closed bar represents R3PA mice. Scale bar: (in D) A–D, 0.2 mm.
As shown in Figure 2C, the Aβ plaque load in the entire hippocampus was not significantly different between Tg-R3PA and Tg-PA mice. Since RIDNs are formed mainly in the CA1 region and less in the CA3 and dentate gyrus regions, further quantification of these subregions was performed. We found that only the number of condensed Aβ plaques in the CA1 region of Tg-R3PA mice (enriched in RIDNs) was not significantly reduced compared with that of Tg-PA mice (34.0 ± 6.26 per 16 sections vs 47.3 ± 4.67 per 16 sections; p > 0.05, unpaired t test), whereas the plaque number was significantly reduced in the Tg-R3PA mouse CA3 (19.2 ± 5.54 vs 38.0 ± 3.46 per 16 sections; reduced by 49.5%, p < 0.05) and dentate gyrus regions (50.4 ± 14.2 vs 90.0 ± 5.03 per 16 sections; reduced by 44.0%; p < 0.05) (Fig. 3E). An alternative quantification that measures plaque number per square millimeter of examined samples also demonstrated the consistency of these results (Fig. 3F).
Collectively, we have shown here that the increased level of RTN3 significantly reduced the formation of Aβ plaques in R3PA cerebrum and most of the hippocampus. The offset inhibitory effect in the hippocampal CA1 region by increased expression of RTN3 is likely related to the preformed RTN3 aggregates in RIDNs. We have previously demonstrated that the occurrence of RIDNs in the Tg-RTN3 mouse hippocampus correlates with the formation and levels of RTN3 aggregates (Hu et al., 2007), and that BACE1 does not interact with RTN3 aggregates (He et al., 2006). Although BACE1 is also suggested to mark dystrophic neurites (Zhao et al., 2007), we found that RIDNs did not overlap with the dystrophic neurites marked by BACE1 antibody (data not shown), indicating that BACE1 and aggregated RTN3 are partially segregated into two different populations of neuritic regions. Since RIDNs formed earlier than amyloid plaques in our animal models, preformed RIDNs appeared to adversely affect the process of amyloid deposition in the CA1 region.
Reduced production of Aβ in Tg-R3PA mice
The levels of Aβ, especially Aβ1–42, govern the process of amyloid deposition in AD (Golde and Younkin, 2001; Sisodia and George-Hyslop, 2002; Tomita and Iwatsubo, 2004). As previously reported in AD mouse studies, Aβ1–42 is much easier to aggregate than Aβ1–40, and the aggregated Aβ1–42 and Aβ1–40 are dissolvable in guanidine hydrochloride (Jankowsky et al., 2004). To measure Aβ1–40 and Aβ1–42 levels by sandwich ELISA, total Aβ was extracted from the specified mouse brain samples by the guanidine hydrochloride method as described previously (Wang et al., 2006). The Aβ1–40 (29.9 ± 1.97 vs 39.6 ± 2.17 pmol/g; p < 0.05) and Aβ1–42 levels (377.4 ± 50.72 vs 596.9 ± 14.68 pmol/g; p < 0.01) were significantly lower in the cerebral cortex of Tg-R3PA mice than those in Tg-PA mice (Fig. 4A). Noticeably, the Aβ1–40/Aβ1–42 ratio was not altered (data not shown), consistent with our previous observation of the inhibitory effects of RTN3 on BACE1 in vitro (He et al., 2004). The hippocampal levels of insoluble Aβ1–40 (39.4 ± 4.58 vs 45.9 ± 6.44 pmol/g; p = 0.229) and Aβ1–42 (309.9 ± 42.60 vs 364.3 ± 62.22 pmol/g; p = 0.255) in Tg-R3PA mice were also lower than that in Tg-PA mice (Fig. 4B). Although there appears to be a smaller reduction in Aβ levels than in amyloid deposition, previous studies also showed similar phenomena in other animal models including BACE1 heterozygous mice (McConlogue et al., 2007). Overall, our ELISA results correlate with the immunohistochemical results that show reduced production and deposition of Aβ in the cerebral cortex of Tg-R3PA mice.
Figure 4.

Production of Aβ was reduced in Tg-RTN3 mice. A, B, The levels of insoluble Aβ1–40 and Aβ1–42 extracted from cortical (A) and entire hippocampal (B) tissues were measured by sandwich ELISA. The Aβ values are expressed as the mean Aβ concentration ± SEM in pmol/g. Whereas there is a significant reduction of both insoluble Aβ1–40 and Aβ1–42 in Tg-R3PA cortex, the difference in the values of hippocampal insoluble Aβ between Tg-PA and Tg-R3PA mice was more moderate (*p < 0.05, **p < 0.01, n = 3; t test).
Expression of RTN3 transgene reduces BACE1 cleavage products
We also performed Western blot analysis on total protein extracts from cerebral cortical homogenates of Tg-PA and Tg-R3PA mice (6 months old) to examine the levels of the BACE1-cleaved C-terminal product CTF99, which was assessed by an antibody recognizing either Aβ N terminus (6E10) or APP C terminus (A8717). It should be noted that the brain full-length APP and secreted N-terminal fragments were not separable on the Western blot. The total levels of these proteins appeared to not be significantly altered, reflecting that expression of APP in Tg-R3PA mice is comparable to that in Tg-PA mice. Whereas the level of RTN3 was validated to be ∼4-fold higher in Tg-R3PA cerebrum, the level of APP CTF99 was noticeably reduced, especially when 6E10 was used to detect human APP CTF99 (Fig. 5A). This slight reduction was clearly manifested by comparing the ratios of CTF99 over either CTF83 (1.97 ± 0.07 vs 1.64 ± 0.12; p < 0.05, n = 4) or total APP (0.96 ± 0.04 in Tg-R3PA vs 0.73 ± 0.07 in Tg-PA; p < 0.05, n = 4). In contrast, the total hippocampal CTF99 levels were not significantly reduced, consistent with the morphological and Aβ results (Fig. 5B) (CTF99/APP: 1.31 ± 0.07 in Tg-R3PA vs 1.26 ± 0.03 in Tg-PA; p < 0.05, n = 4). Thus, reduced amyloid deposition in R3PA mice is attributable to reduced BACE1 activity in R3PA mice and preformed RIDNs affecting negative modulation of RTN3 on APP processing.
Figure 5.
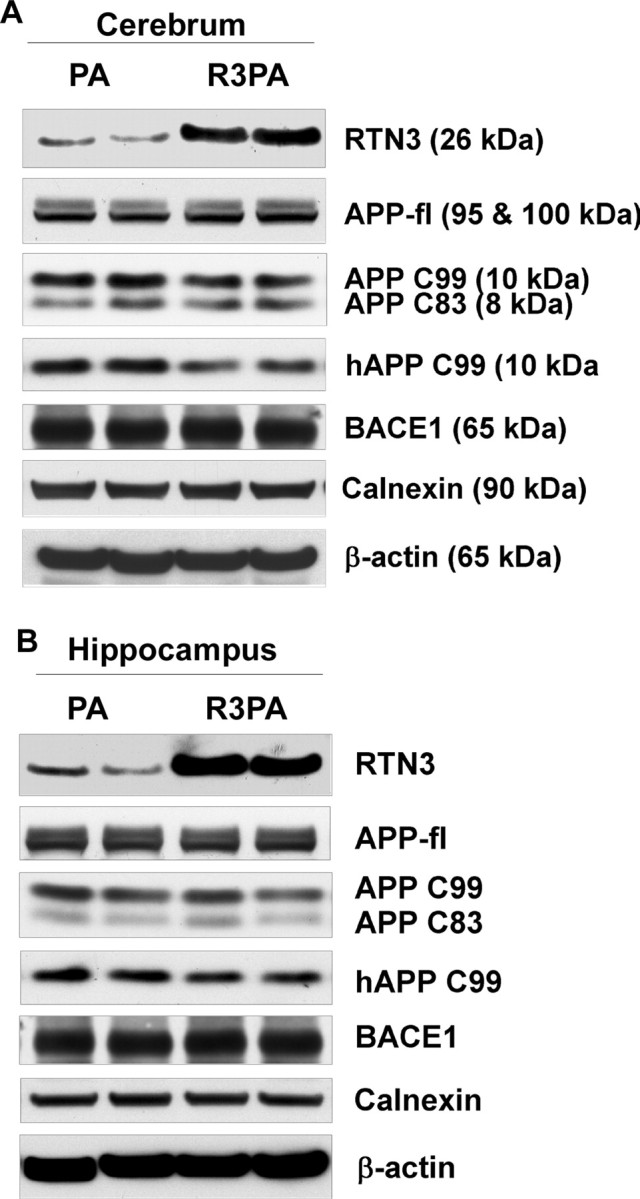
APP processing patterns in Tg-PA and Tg-R3PA mouse brains. A, B, Equal amounts of protein extracts from cerebral cortex (A) or hippocampus (B) of 180-d-old Tg-PA and Tg-R3PA mice were examined by Western blotting. Antibody 6E10 recognizes full-length APP and BACE1-cleaved human APP transgene product CTF99. BACE1 is detected with antibody B279. Antibody A8717, specific to the APP C terminus, was used to detect full-length APP, its CTF99 and CTF83 fragments. Antibodies recognizing β-actin and calnexin were used to verify equal loading.
Altered localization of BACE1 in subcellular compartments after overexpression of RTN3
Although both our in vitro and in vivo studies have demonstrated that increased expression of RTN3 will bind to and negatively affect BACE1 activity by preventing BACE1 access to its APP substrate, the physiological function of RTN3 during its interaction with BACE1 is still unclear. To further address this mechanistic question, we tested the potential role of RTN3 in cellular trafficking as discussed previously (Wakana et al., 2005). We reasoned that the cellular distribution of BACE1 would be affected if increased expression of RTN3 would alter BACE1 trafficking. To investigate the potential effect of RTN3 on the intracellular localization of BACE1, we first performed sucrose gradient centrifugation to fractionate the cellular compartments of the HEK-293 and HR3M cells. HR3M cells were established by stably expressing RTN3 in HEK-293 cells (He et al., 2007). Our result showed that in HR3M cells, the majority of BACE1 was localized in the ER fractions, leaving a small amount of BACE1 in the Golgi fractions (Fig. 6A). In contrast, a significant portion of BACE1 was localized in the Golgi of the HEK-293 cells (fractions 3 and 4), and a much smaller portion was localized in the early endosomes (fraction 2), consistent with previous reports (Creemers et al., 2001; Yan et al., 2001; Pastorino et al., 2002). We also found that endogenous levels of APP detected with antibody A8717 were mostly in the fractions containing ER and plasma membrane proteins in both cases, but appeared more obvious in HR3M cells. It should be noted that full-length APP levels were higher in HR3M cells than in HEK-293 cells, consistent with our previous reports that increased expression of RTN3 elevates the levels of full-length APP in cultured cells (He et al., 2004) and in sciatic nerves (Shi et al., 2009).
Figure 6.

Altered cellular distribution of BACE1 after overexpression of RTN3. A, After transfection with a BACE1-expressing plasmid DNA for 24 h, HEK-293 and HR3M cells were homogenized and a postnuclear supernatant was fractionated on an equilibrium sucrose gradient. Fractions (12 × 1 ml) were collected from the top of the gradient, 400 μl of each fraction was precipitated with ice-cold methanol, and proteins were then separated on 4–12% Bis–Tris NuPAGE gels followed by immunoblotting using antibodies against BACE1 (B279), APP (APP C-terminal), and RTN3 (R458), as indicated. Calnexin, β-COP, TGN38, and EEA1 served as protein markers for the ER, Golgi, trans-Golgi network (TGN), and early endosome (EE), respectively. Molecular weight markers are in kilodaltons and are indicated on the left of the panel. B, HM cells, which stably express BACE1, were transfected with RTN3 or empty vector for 48 h, and cells were subjected to subcellular fractionation via iodixanol gradient. Altered enrichment of BACE1 in the early endosomal compartments is the most prominent. Altered protein bands recognized by APP C-terminal antibody are also indicated with an arrow. This protein fragment was not apparent in the HEK-293 cells, which were used for generation of HM cells. The enrichment of EEA1 (early endosomal marker), β-COP (Golgi compartment marker), and calnexin (ER) was specified.
To further confirm this observation, we transfected either empty vector or RTN3 expression construct into HM cells that stably express BACE1. After transfection for 48 h, these cells were subjected to subcellular fractionation using the iodixanol gradient method according to procedures described previously (Xia et al., 1998). We found that BACE1 displayed bimodal distribution in the ER and Golgi fractions in the control-transfected cells, but significantly more BACE1 was enriched in the ER compartments when RTN3 was significantly overexpressed (Fig. 6B).
It has been previously shown that a small percentage of BACE1 is detectable on the cell surface (Huse et al., 2000; Yan et al., 2001; Kinoshita et al., 2003; Hu et al., 2006; Zou et al., 2007). Potentially, the increased retention of BACE1 in the ER compartment would reduce surface expression of BACE1. To test this possibility, we compared the cell surface localization of BACE1 in HEK-293 cells or HR3M cells by using biotin labeling of surface proteins. To confirm this, we transiently transfected these two cell lines with equal amounts of HA-tagged human BACE1 expression construct, and the transfection was allowed to proceed for 24 h. Cell surface proteins were then biotinylated as described previously (Yan et al., 2001), and biotinylated proteins were specifically pulled-down with neutravidin beads for Western blot analysis. Although the expression of HA-tagged BACE1 in HR3M cells was similar to that in HEK-293 cells, the ratio of surface BACE1 to total cellular BACE1 was significantly lower in HR3M cells compared with HEK-293 cells (Fig. 7A). Based on quantification from three independent sets of experiments, we found that 5.49 ± 0.679% of total cellular BACE1 in HEK-293 cells was detectable on the cell surface, but only 1.36 ± 0.0694% of total BACE1 in HR3M cells was detected on the cell surface, reflecting an ∼55% reduction of surface BACE1 after increased expression of RTN3 (Fig. 7B) (p < 0.01, n = 3). In an alternative experiment, BACE1 stably expressed HM cells were transiently transfected with either RTN3 plasmid DNA or empty vector for 48 h. The biotinylation and pull-down experiments were conducted in the same manner as above. Consistent with the data outlined above, we observed a significant reduction of surface BACE1 in cells after overexpression of RTN3 (Fig. 7D,E). The percentage of surface BACE1 in the total BACE1 was 7.67 ± 0.649% in the control, whereas it was decreased to 3.40 ± 0.486% when RTN3 was overexpressed.
Figure 7.

Reduced cell surface BACE1 after overexpression of RTN3. A, The human BACE1-expressing vector was transiently transfected into HEK-293 cells (293) and RTN3-overexpressing HEK-293 cells (HR3M), followed by biotinylation of surface proteins in living cells according to standard procedures. The biotinylated surface proteins were separated from the nonbiotinylated proteins by using neutravidin beads. The total proteins of cell lysates and biotinylated proteins were analyzed on the Western blot using specific antibodies. Three independent experiments were performed on each cell line and analyzed on the same blot. Calnexin served as a loading control. B, C, Total cellular and surface levels of BACE1 (B) and APP (C) were calculated as the integrated density value (IDV) and normalized to the IDV of calnexin. The percentage of the two proteins on the cell surface is presented correspondingly as bar graphs. The results were summarized from three sets of experiments (p < 0.01). D, BACE1-expressing HM cells were transiently transfected with RTN3 plasmid DNA or pcDNA3.1 vector (labeled as vector) for 48 h. The surface protein biotinylation and neutravidin pull-down were performed in the same method, as described above. It is worth noting that without biotinylation, surface proteins were not detectable in the eluates from the neutravidin column. E, F, Total cellular and surface levels of BACE1 (E) and APP (F) were also calculated as IDV and normalized to the IDV of calnexin. The percentage of the two proteins on the cell surface to their total proteins in lysates is correspondingly presented as bar graphs (E) and (F). (n = 6; p < 0.05).
Higher levels of RTN3 are expected to reduce BACE1 processing of APP. Consistent with this, total full-length APP was indeed significantly higher in HR3M cells than in HEK-293 cells (p < 0.01, n = 3, t test) (Fig. 7A,D). We also verified that mRNA levels of APP in these two cell lines were similar (data not shown), thereby confirming that this elevated level of full length of APP is caused by decreased processing of BACE1, as discussed previously (He et al., 2004; Murayama et al., 2006). Interestingly, the cellular trafficking of APP was also altered as evidenced by altered subcellular fractionation (Fig. 6A) and the percentage of APP on the cell surface (Fig. 7C,F) (p < 0.01, n = 3). This reduced surface level of APP in cells was in line with the observation of fractionation on the sucrose gradient.
Altogether, we demonstrated that increased expression of RTN3 indeed altered cellular trafficking of BACE1 and APP. An increased retention of BACE1 in the ER compartment is also not favorable for optimal processing of APP by BACE1, which requires an acidic pH environment. Unlike BACE1, membrane trafficking of APP might have been indirectly affected by increased expression of RTN3, because direct interaction between RTN3 and APP was not detected. Whether the altered interaction between BACE1 and APP after overexpression of RTN3 contributes to the altered cellular trafficking of APP remains to be investigated.
Discussion
RTN proteins are a group of integral membrane proteins predominantly associated with the ER (Oertle et al., 2003; Yan et al., 2006). Although their biological functions remain poorly understood, diverse biochemical and functional studies suggest various potential roles of these proteins, including the shaping of the tubular ER, regulated trafficking of vesicle proteins, neurite growth, and exocytosis (Chen et al., 2000; GrandPré et al., 2000; Steiner et al., 2004; Voeltz et al., 2006; Hu et al., 2007; Kiseleva et al., 2007). Altered expression levels of RTNs are found in a variety of disease states, including neurological disorders (Bandtlow et al., 2004; Fergani et al., 2005; Yan et al., 2006). We and others have demonstrated that RTNs interact with BACE1 and negatively modulate BACE1 protease activity (He et al., 2004, 2006; Murayama et al., 2006; Wojcik et al., 2007; Kume et al., 2009). In the present study, we further demonstrated that increased expression of RTN3 in our mouse models significantly reduced Aβ production, amyloid deposition, and plaque load. Specifically, the overexpression of RTN3 in Tg-R3PA mice significantly decreased the number of neuritic Aβ plaques by ∼55% in the cerebral cortex, 50% in the CA3 region, and 44% in the dentate gyrus region compared with the same regions in Tg-PA mice. However, our results are the first to suggest that preformed RIDNs primarily in the Tg-R3PA CA1 region adversely affect the negative modulation of BACE by RTNs, thereby affecting the process of amyloid deposition. There are many potential mechanisms that could cause the formation of dystrophic neurites in AD patients, and the formation of RIDNs correlates with the formation of RTN3 aggregates. Our results imply that inhibition of RTN3 aggregation will reduce the formation of RIDNs and amyloid deposition in AD.
RIDNs in Tg-RTN3 mice occur as early as 3 months of age (Shi et al., 2009), which is earlier than the onset of the Aβ plaque formation in Tg-PA mice (∼5–6 months of age). The hippocampal CA1 region is the predominant region of this formation. In our study, the expression levels of RTN3 in the hippocampus and cerebral cortex were comparable (Fig. 1), although most of the RIDNs developed in the hippocampal CA1 region and only a few RIDNs were scattered in the cerebral cortex. The observed biochemical difference between the hippocampus and the cerebral cortex was perhaps attributable to the existence of a large number of RTN3 aggregates in the hippocampus but not in the cerebral cortex of Tg-R3PA mice (Hu et al., 2007). It remains to be determined why the hippocampus is more susceptible to the formation of RTN3 aggregates. However, because of this difference, the overall beneficial effect of RTN3 overexpression was significantly diminished in the hippocampus of Tg-R3PA mice because the insoluble Aβ1–40 and Aβ1–42 levels as well as the amounts of dystrophic Aβ plaques were lowered to a lesser extent. We have recently demonstrated that aggregated RTN3 does not interact with BACE1, whereas the free-form of RTN3 binds to BACE1 and inhibits it (He et al., 2006), indicating that monomeric status is critical for RTN3 inhibitory function of BACE1. RTN3 adopts a ω-shape structure with two ends facing the cytosolic side (He et al., 2007), and its C-terminal QID (glutamine, isoleucine, aspartic acid) motif is required for the interaction with the BACE1 C-terminal membrane-proximal region (He et al., 2006). The interaction of RTN3 with BACE1 is essential for the inhibitory role of RTN3 in the attenuation of BACE1-mediated APP processing. As the major component of RIDNs is aggregated RTN3, the formation of RIDNs on a large scale reduces available RTN3 monomer intracellularly, which in turn liberates BACE1 from the RTN3-mediated inhibition.
If preformation of RIDNs in the mouse hippocampus is avoidable, inducing expression of RTN3 could be an alternative approach to achieve reduction of amyloid deposition. We found that overexpression of RTN3 in regions other than CA1 sufficiently caused a reduction in amyloid plaque formation, although it did not completely block Aβ production. Partial reduction of BACE1 activity has been shown to reduce amyloid deposition (Laird et al., 2005; Singer et al., 2005; McConlogue et al., 2007), and our results are in line with these observations. It should also be noted that the APP model used in the present study differs from the PDAPP or Tg-2576 mice used in the above publications, but inhibition of BACE1 is commonly believed to reduce amyloid deposition.
The mechanism by which increased expression of RTN3 reduces BACE1 processing of APP was investigated by testing the potential role of RTN3 in trafficking of membrane proteins. Genetic studies suggest that the RTN family of proteins may shape tubular structures (Voeltz et al., 2006; Tolley et al., 2008), but other studies show that RTN proteins can affect vesicle trafficking through interactions with vesicle transporter proteins (Iwahashi and Hamada, 2003; Steiner et al., 2004; Wakana et al., 2005; Liu et al., 2008). Our present study has revealed that increased expression of RTN3 causes retention of more BACE1 in the ER compartments and diminishes the trafficking of BACE1 to the cell surface. The potential explanation for this altered trafficking is that RTN3 is not a fast movable ER trafficking molecule, and interaction between RTN3 and BACE1 causes BACE1 to transit slowly from the ER to the late secretory compartments. In line with this observation, we found that the surface BACE1 was reduced significantly when RTN3 was overexpressed. Interestingly, cellular trafficking of APP was also affected during overexpression of RTN3 (Figs. 6, 7). Although RTN3 does not interact with APP directly based on our co-IP experiments (He et al., 2004), the increased retention of APP in the ER may be related to elevated levels of BACE1 in the ER in this circumstance, and an interaction between APP and BACE1 may indirectly retain more APP in the ER. Increased retention of APP in the ER would explain the slightly reduced levels of CTF83, a processing product of APP by α-secretase as shown in Figure 1.
Altered intracellular trafficking and localization of BACE1 are expected to affect APP metabolism and Aβ production. Normally, the majority of BACE1 is present in the trans-Golgi network and endosomes, whereas the rest exists on the cell surface and in the ER (Vassar et al., 1999; Lin et al., 2000; Creemers et al., 2001; Walter et al., 2001; Yan et al., 2001). Cleavage of APP at the β-site by BACE1 occurs in both early secretory compartments and endocytic pathways (Shi et al., 2001; Yan et al., 2001; Huse et al., 2002; Kinoshita et al., 2003; He et al., 2005). Consequently, more BACE1 is accumulated in the ER environment in which processing of APP by BACE1 is in a less favorable pH condition as suggested previously (Hussain et al., 1999; Sinha et al., 1999; Vassar et al., 1999; Yan et al., 1999; Lin et al., 2000). Increased retention of BACE1 in the ER is expected to enhance degradation of BACE1 as suggested recently (Tesco et al., 2007). Perhaps tight interaction of RTN3 with BACE1 prevents not only access of BACE1 to its APP substrate for proper processing but also its degradation. Whereas the elevated levels of RTN3 can retain BACE1 in the ER compartment, it is unclear whether the exit of BACE1 out of the ER compartment requires RTN3. The complete deficiency of RTN3 and its family members will be tested to address this question.
In summary, our findings have established the dual roles of RTN3 in vivo, and our results suggest that altered cellular trafficking of BACE1 in vitro and in vivo can also account for reduced production of Aβ and its deposition in the brain. Importantly, our results also indicate that the preformed RIDNs will adversely favor the production of Aβ, and higher levels of RIDNs than amyloid plaques have already been found in the hippocampal region of AD postmortem brains (Shi et al., 2009). Hence, the prevention of the formation of RIDNs will be a necessary step to enhance the effect of RTN3 on amyloid deposition.
Footnotes
This work was supported by a National Institutes of Health grant to R.Y. (AG025493) and awards from the Ralph Wilson Foundation and the Alzheimer's Association to R.Y. Q.S. is partially supported by a Young Investigator Award from the National Alliance for Research on Schizophrenia and Depression and M.P. is supported by an American Health Assistance Foundation postdoctoral fellowship. We thank Dr. Xiangdong Zhou for much help during the studies and Chris Nelson for critical reading of this manuscript. Dr. Robert Vassar (Northwestern University) provided us with the BACE1-specific monoclonal antibody that was used for confocal staining of BACE1 in brain samples.
References
- Bandtlow CE, Dlaska M, Pirker S, Czech T, Baumgartner C, Sperk G. Increased expression of Nogo-A in hippocampal neurons of patients with temporal lobe epilepsy. Eur J Neurosci. 2004;20:195–206. doi: 10.1111/j.1460-9568.2004.03470.x. [DOI] [PubMed] [Google Scholar]
- Borchelt DR, Ratovitski T, van Lare J, Lee MK, Gonzales V, Jenkins NA, Copeland NG, Price DL, Sisodia SS. Accelerated amyloid deposition in the brains of transgenic mice coexpressing mutant presenilin 1 and amyloid precursor proteins. Neuron. 1997;19:939–945. doi: 10.1016/s0896-6273(00)80974-5. [DOI] [PubMed] [Google Scholar]
- Chen MS, Huber AB, van der Haar ME, Frank M, Schnell L, Spillmann AA, Christ F, Schwab ME. Nogo-A is a myelin-associated neurite outgrowth inhibitor and an antigen for monoclonal antibody IN-1. Nature. 2000;403:434–439. doi: 10.1038/35000219. [DOI] [PubMed] [Google Scholar]
- Creemers JW, Ines Dominguez D, Plets E, Serneels L, Taylor NA, Multhaup G, Craessaerts K, Annaert W, De Strooper B. Processing of beta-secretase by furin and other members of the proprotein convertase family. J Biol Chem. 2001;276:4211–4217. doi: 10.1074/jbc.M006947200. [DOI] [PubMed] [Google Scholar]
- Dickson TC, King CE, McCormack GH, Vickers JC. Neurochemical diversity of dystrophic neurites in the early and late stages of Alzheimer's disease. Exp Neurol. 1999;156:100–110. doi: 10.1006/exnr.1998.7010. [DOI] [PubMed] [Google Scholar]
- Dong H, Goico B, Martin M, Csernansky CA, Bertchume A, Csernansky JG. Modulation of hippocampal cell proliferation, memory, and amyloid plaque deposition in APPsw (Tg2576) mutant mice by isolation stress. Neuroscience. 2004;127:601–609. doi: 10.1016/j.neuroscience.2004.05.040. [DOI] [PubMed] [Google Scholar]
- Fergani A, Dupuis L, Jokic N, Larmet Y, de Tapia M, Rene F, Loeffler JP, Gonzalez de Aguilar JL. Reticulons as markers of neurological diseases: focus on amyotrophic lateral sclerosis. Neurodegener Dis. 2005;2:185–194. doi: 10.1159/000089624. [DOI] [PubMed] [Google Scholar]
- Games D, Adams D, Alessandrini R, Barbour R, Berthelette P, Blackwell C, Carr T, Clemens J, Donaldson T, Gillespie F. Alzheimer-type neuropathology in transgenic mice overexpressing V717F beta-amyloid precursor protein. Nature. 1995;373:523–527. doi: 10.1038/373523a0. [DOI] [PubMed] [Google Scholar]
- Golde TE, Younkin SG. Presenilins as therapeutic targets for the treatment of Alzheimer's disease. Trends Mol Med. 2001;7:264–269. doi: 10.1016/s1471-4914(01)02064-0. [DOI] [PubMed] [Google Scholar]
- GrandPré T, Nakamura F, Vartanian T, Strittmatter SM. Identification of the Nogo inhibitor of axon regeneration as a Reticulon protein. Nature. 2000;403:439–444. doi: 10.1038/35000226. [DOI] [PubMed] [Google Scholar]
- He W, Lu Y, Qahwash I, Hu XY, Chang A, Yan R. Reticulon family members modulate BACE1 activity and amyloid-beta peptide generation. Nat Med. 2004;10:959–965. doi: 10.1038/nm1088. [DOI] [PubMed] [Google Scholar]
- He W, Hu X, Shi Q, Zhou X, Lu Y, Fisher C, Yan R. Mapping of interaction domains mediating binding between BACE1 and RTN/Nogo proteins. J Mol Biol. 2006;363:625–634. doi: 10.1016/j.jmb.2006.07.094. [DOI] [PubMed] [Google Scholar]
- He W, Shi Q, Hu X, Yan R. The membrane topology of RTN3 and its effect on binding of RTN3 to BACE1. J Biol Chem. 2007;282:29144–29151. doi: 10.1074/jbc.M704181200. [DOI] [PubMed] [Google Scholar]
- He X, Li F, Chang WP, Tang J. GGA proteins mediate the recycling pathway of memapsin 2 (BACE) J Biol Chem. 2005;280:11696–11703. doi: 10.1074/jbc.M411296200. [DOI] [PubMed] [Google Scholar]
- Holcomb L, Gordon MN, McGowan E, Yu X, Benkovic S, Jantzen P, Wright K, Saad I, Mueller R, Morgan D, Sanders S, Zehr C, O'Campo K, Hardy J, Prada CM, Eckman C, Younkin S, Hsiao K, Duff K. Accelerated Alzheimer-type phenotype in transgenic mice carrying both mutant amyloid precursor protein and presenilin 1 transgenes. Nat Med. 1998;4:97–100. doi: 10.1038/nm0198-097. [DOI] [PubMed] [Google Scholar]
- Hu X, Hicks CW, He W, Wong P, Macklin WB, Trapp BD, Yan R. Bace1 modulates myelination in the central and peripheral nervous system. Nat Neurosci. 2006;9:1520–1525. doi: 10.1038/nn1797. [DOI] [PubMed] [Google Scholar]
- Hu X, Shi Q, Zhou X, He W, Yi H, Yin X, Gearing M, Levey A, Yan R. Transgenic mice overexpressing reticulon 3 develop neuritic abnormalities. EMBO J. 2007;26:2755–2767. doi: 10.1038/sj.emboj.7601707. [DOI] [PMC free article] [PubMed] [Google Scholar]
- Huse JT, Pijak DS, Leslie GJ, Lee VM, Doms RW. Maturation and endosomal targeting of beta-site amyloid precursor protein-cleaving enzyme. The Alzheimer's disease beta-secretase. J Biol Chem. 2000;275:33729–33737. doi: 10.1074/jbc.M004175200. [DOI] [PubMed] [Google Scholar]
- Huse JT, Liu K, Pijak DS, Carlin D, Lee VM, Doms RW. Beta-secretase processing in the trans-Golgi network preferentially generates truncated amyloid species that accumulate in Alzheimer's disease brain. J Biol Chem. 2002;277:16278–16284. doi: 10.1074/jbc.M111141200. [DOI] [PubMed] [Google Scholar]
- Hussain I, Powell D, Howlett DR, Tew DG, Meek TD, Chapman C, Gloger IS, Murphy KE, Southan CD, Ryan DM, Smith TS, Simmons DL, Walsh FS, Dingwall C, Christie G. Identification of a novel aspartic protease (Asp 2) as beta-secretase. Mol Cell Neurosci. 1999;14:419–427. doi: 10.1006/mcne.1999.0811. [DOI] [PubMed] [Google Scholar]
- Iwahashi J, Hamada N. Human reticulon 1-A and 1-B interact with a medium chain of the AP-2 adaptor complex. Cell Mol Biol (Noisy-le-grand) 2003;49 Online Publ: OL467–OL471. [PubMed] [Google Scholar]
- Jankowsky JL, Fadale DJ, Anderson J, Xu GM, Gonzales V, Jenkins NA, Copeland NG, Lee MK, Younkin LH, Wagner SL, Younkin SG, Borchelt DR. Mutant presenilins specifically elevate the levels of the 42 residue beta-amyloid peptide in vivo: evidence for augmentation of a 42-specific gamma secretase. Hum Mol Genet. 2004;13:159–170. doi: 10.1093/hmg/ddh019. [DOI] [PubMed] [Google Scholar]
- Joachim CL, Morris JH, Selkoe DJ. Diffuse senile plaques occur commonly in the cerebellum in Alzheimer's disease. Am J Pathol. 1989;135:309–319. [PMC free article] [PubMed] [Google Scholar]
- Kinoshita A, Fukumoto H, Shah T, Whelan CM, Irizarry MC, Hyman BT. Demonstration by FRET of BACE interaction with the amyloid precursor protein at the cell surface and in early endosomes. J Cell Sci. 2003;116:3339–3346. doi: 10.1242/jcs.00643. [DOI] [PubMed] [Google Scholar]
- Kiseleva E, Morozova KN, Voeltz GK, Allen TD, Goldberg MW. Reticulon 4a/NogoA locates to regions of high membrane curvature and may have a role in nuclear envelope growth. J Struct Biol. 2007;160:224–235. doi: 10.1016/j.jsb.2007.08.005. [DOI] [PMC free article] [PubMed] [Google Scholar]
- Kowall NW, Kosik KS. Axonal disruption and aberrant localization of tau protein characterize the neuropil pathology of Alzheimer's disease. Ann Neurol. 1987;22:639–643. doi: 10.1002/ana.410220514. [DOI] [PubMed] [Google Scholar]
- Kume H, Murayama KS, Araki W. The two-hydrophobic domain tertiary structure of reticulon proteins is critical for modulation of beta-secretase BACE1. J Neurosci. 2009 doi: 10.1002/jnr.22112. [DOI] [PubMed] [Google Scholar]
- Laird FM, Cai H, Savonenko AV, Farah MH, He K, Melnikova T, Wen H, Chiang HC, Xu G, Koliatsos VE, Borchelt DR, Price DL, Lee HK, Wong PC. BACE1, a major determinant of selective vulnerability of the brain to amyloid-beta amyloidogenesis, is essential for cognitive, emotional, and synaptic functions. J Neurosci. 2005;25:11693–11709. doi: 10.1523/JNEUROSCI.2766-05.2005. [DOI] [PMC free article] [PubMed] [Google Scholar]
- Lin X, Koelsch G, Wu S, Downs D, Dashti A, Tang J. Human aspartic protease memapsin 2 cleaves the beta-secretase site of beta-amyloid precursor protein. Proc Natl Acad Sci U S A. 2000;97:1456–1460. doi: 10.1073/pnas.97.4.1456. [DOI] [PMC free article] [PubMed] [Google Scholar]
- Liu Y, Vidensky S, Ruggiero AM, Maier S, Sitte HH, Rothstein JD. Reticulon RTN2B regulates trafficking and function of neuronal glutamate transporter EAAC1. J Biol Chem. 2008;283:6561–6571. doi: 10.1074/jbc.M708096200. [DOI] [PMC free article] [PubMed] [Google Scholar]
- Masliah E, Mallory M, Hansen L, Alford M, DeTeresa R, Terry R, Baudier J, Saitoh T. Localization of amyloid precursor protein in GAP43-immunoreactive aberrant sprouting neurites in Alzheimer's disease. Brain Res. 1992;574:312–316. doi: 10.1016/0006-8993(92)90831-s. [DOI] [PubMed] [Google Scholar]
- McConlogue L, Buttini M, Anderson JP, Brigham EF, Chen KS, Freedman SB, Games D, Johnson-Wood K, Lee M, Zeller M, Liu W, Motter R, Sinha S. Partial reduction of BACE1 has dramatic effects on Alzheimer plaque and synaptic pathology in APP transgenic mice. J Biol Chem. 2007;282:26326–26334. doi: 10.1074/jbc.M611687200. [DOI] [PubMed] [Google Scholar]
- Murayama KS, Kametani F, Saito S, Kume H, Akiyama H, Araki W. Reticulons RTN3 and RTN4-B/C interact with BACE1 and inhibit its ability to produce amyloid beta-protein. Eur J Neurosci. 2006;24:1237–1244. doi: 10.1111/j.1460-9568.2006.05005.x. [DOI] [PubMed] [Google Scholar]
- Oertle T, Schwab ME. Nogo and its paRTNers. Trends Cell Biol. 2003;13:187–194. doi: 10.1016/s0962-8924(03)00035-7. [DOI] [PubMed] [Google Scholar]
- Oertle T, Klinger M, Stuermer CA, Schwab ME. A reticular rhapsody: phylogenic evolution and nomenclature of the RTN/Nogo gene family. FASEB J. 2003;17:1238–1247. doi: 10.1096/fj.02-1166hyp. [DOI] [PubMed] [Google Scholar]
- Onorato M, Mulvihill P, Connolly J, Galloway P, Whitehouse P, Perry G. Alteration of neuritic cytoarchitecture in Alzheimer disease. Prog Clin Biol Res. 1989;317:781–789. [PubMed] [Google Scholar]
- Pastorino L, Ikin AF, Nairn AC, Pursnani A, Buxbaum JD. The carboxyl-terminus of BACE contains a sorting signal that regulates BACE trafficking but not the formation of total A(beta) Mol Cell Neurosci. 2002;19:175–185. doi: 10.1006/mcne.2001.1065. [DOI] [PubMed] [Google Scholar]
- Perry G, Friedman R, Shaw G, Chau V. Ubiquitin is detected in neurofibrillary tangles and senile plaque neurites of Alzheimer disease brains. Proc Natl Acad Sci U S A. 1987;84:3033–3036. doi: 10.1073/pnas.84.9.3033. [DOI] [PMC free article] [PubMed] [Google Scholar]
- Qahwash I, Weiland KL, Lu Y, Sarver RW, Kletzien RF, Yan R. Identification of a mutant amyloid peptide that predominantly forms neurotoxic protofibrillar aggregates. J Biol Chem. 2003;278:23187–23195. doi: 10.1074/jbc.M213298200. [DOI] [PubMed] [Google Scholar]
- Shi Q, Hu X, Prior M, Yan R. The occurrence of aging-dependent reticulon 3 immunoreactive dystrophic neurites decreases cognitive function. J Neurosci. 2009;29:5108–5115. doi: 10.1523/JNEUROSCI.5887-08.2009. [DOI] [PMC free article] [PubMed] [Google Scholar]
- Shi XP, Chen E, Yin KC, Na S, Garsky VM, Lai MT, Li YM, Platchek M, Register RB, Sardana MK, Tang MJ, Thiebeau J, Wood T, Shafer JA, Gardell SJ. The pro domain of beta-secretase does not confer strict zymogen-like properties but does assist proper folding of the protease domain. J Biol Chem. 2001;276:10366–10373. doi: 10.1074/jbc.m009200200. [DOI] [PubMed] [Google Scholar]
- Singer O, Marr RA, Rockenstein E, Crews L, Coufal NG, Gage FH, Verma IM, Masliah E. Targeting BACE1 with siRNAs ameliorates Alzheimer disease neuropathology in a transgenic model. Nat Neurosci. 2005;8:1343–1349. doi: 10.1038/nn1531. [DOI] [PubMed] [Google Scholar]
- Sinha S, Anderson JP, Barbour R, Basi GS, Caccavello R, Davis D, Doan M, Dovey HF, Frigon N, Hong J, Jacobson-Croak K, Jewett N, Keim P, Knops J, Lieberburg I, Power M, Tan H, Tatsuno G, Tung J, Schenk D, et al. Purification and cloning of amyloid precursor protein beta-secretase from human brain. Nature. 1999;402:537–540. doi: 10.1038/990114. [DOI] [PubMed] [Google Scholar]
- Sisodia SS, St George-Hyslop PH. gamma-Secretase, Notch, Abeta and Alzheimer's disease: where do the presenilins fit in? Nat Rev Neurosci. 2002;3:281–290. doi: 10.1038/nrn785. [DOI] [PubMed] [Google Scholar]
- Steiner P, Kulangara K, Sarria JC, Glauser L, Regazzi R, Hirling H. Reticulon 1-C/neuroendocrine-specific protein-C interacts with SNARE proteins. J Neurochem. 2004;89:569–580. doi: 10.1111/j.1471-4159.2004.02345.x. [DOI] [PubMed] [Google Scholar]
- Tanzi RE, Bertram L. Twenty years of the Alzheimer's disease amyloid hypothesis: a genetic perspective. Cell. 2005;120:545–555. doi: 10.1016/j.cell.2005.02.008. [DOI] [PubMed] [Google Scholar]
- Tesco G, Koh YH, Kang EL, Cameron AN, Das S, Sena-Esteves M, Hiltunen M, Yang SH, Zhong Z, Shen Y, Simpkins JW, Tanzi RE. Depletion of GGA3 stabilizes BACE and enhances beta-secretase activity. Neuron. 2007;54:721–737. doi: 10.1016/j.neuron.2007.05.012. [DOI] [PMC free article] [PubMed] [Google Scholar]
- Tolley N, Sparkes IA, Hunter PR, Craddock CP, Nuttall J, Roberts LM, Hawes C, Pedrazzini E, Frigerio L. Overexpression of a plant reticulon remodels the lumen of the cortical endoplasmic reticulum but does not perturb protein transport. Traffic. 2008;9:94–102. doi: 10.1111/j.1600-0854.2007.00670.x. [DOI] [PubMed] [Google Scholar]
- Tomasselli AG, Qahwash I, Emmons TL, Lu Y, Leone JW, Lull JM, Fok KF, Bannow CA, Smith CW, Bienkowski MJ, Heinrikson RL, Yan R. Employing a superior BACE1 cleavage sequence to probe cellular APP processing. J Neurochem. 2003;84:1006–1017. doi: 10.1046/j.1471-4159.2003.01597.x. [DOI] [PubMed] [Google Scholar]
- Tomita T, Iwatsubo T. The inhibition of gamma-secretase as a therapeutic approach to Alzheimer's disease. Drug News Perspect. 2004;17:321–325. doi: 10.1358/dnp.2004.17.5.829036. [DOI] [PubMed] [Google Scholar]
- Vassar R, Bennett BD, Babu-Khan S, Kahn S, Mendiaz EA, Denis P, Teplow DB, Ross S, Amarante P, Loeloff R, Luo Y, Fisher S, Fuller J, Edenson S, Lile J, Jarosinski MA, Biere AL, Curran E, Burgess T, Louis JC, et al. Beta-secretase cleavage of Alzheimer's amyloid precursor protein by the transmembrane aspartic protease BACE. Science. 1999;286:735–741. doi: 10.1126/science.286.5440.735. [DOI] [PubMed] [Google Scholar]
- Voeltz GK, Prinz WA, Shibata Y, Rist JM, Rapoport TA. A class of membrane proteins shaping the tubular endoplasmic reticulum. Cell. 2006;124:573–586. doi: 10.1016/j.cell.2005.11.047. [DOI] [PubMed] [Google Scholar]
- Wakana Y, Koyama S, Nakajima K, Hatsuzawa K, Nagahama M, Tani K, Hauri HP, Melançon P, Tagaya M. Reticulon 3 is involved in membrane trafficking between the endoplasmic reticulum and Golgi. Biochem Biophys Res Commun. 2005;334:1198–1205. doi: 10.1016/j.bbrc.2005.07.012. [DOI] [PubMed] [Google Scholar]
- Walter J, Fluhrer R, Hartung B, Willem M, Kaether C, Capell A, Lammich S, Multhaup G, Haass C. Phosphorylation regulates intracellular trafficking of beta-secretase. J Biol Chem. 2001;276:14634–14641. doi: 10.1074/jbc.M011116200. [DOI] [PubMed] [Google Scholar]
- Wang R, Wang B, He W, Zheng H. Wild-type presenilin 1 protects against Alzheimer disease mutation-induced amyloid pathology. J Biol Chem. 2006;281:15330–15336. doi: 10.1074/jbc.M512574200. [DOI] [PubMed] [Google Scholar]
- Wojcik S, Engel WK, Yan R, McFerrin J, Askanas V. NOGO is increased and binds to BACE1 in sporadic inclusion-body myositis and in AbetaPP-overexpressing cultured human muscle fibers. Acta Neuropathol. 2007;114:517–526. doi: 10.1007/s00401-007-0281-y. [DOI] [PubMed] [Google Scholar]
- Xia W, Zhang J, Ostaszewski BL, Kimberly WT, Seubert P, Koo EH, Shen J, Selkoe DJ. Presenilin 1 regulates the processing of beta-amyloid precursor protein C-terminal fragments and the generation of amyloid beta-protein in endoplasmic reticulum and Golgi. Biochemistry. 1998;37:16465–16471. doi: 10.1021/bi9816195. [DOI] [PubMed] [Google Scholar]
- Yan R, Bienkowski MJ, Shuck ME, Miao H, Tory MC, Pauley AM, Brashier JR, Stratman NC, Mathews WR, Buhl AE, Carter DB, Tomasselli AG, Parodi LA, Heinrikson RL, Gurney ME. Membrane-anchored aspartyl protease with Alzheimer's disease beta-secretase activity. Nature. 1999;402:533–537. doi: 10.1038/990107. [DOI] [PubMed] [Google Scholar]
- Yan R, Han P, Miao H, Greengard P, Xu H. The transmembrane domain of the Alzheimer's beta-secretase (BACE1) determines its late Golgi localization and access to beta-amyloid precursor protein (APP) substrate. J Biol Chem. 2001;276:36788–36796. doi: 10.1074/jbc.M104350200. [DOI] [PubMed] [Google Scholar]
- Yan R, Shi Q, Hu X, Zhou X. Reticulon proteins: emerging players in neurodegenerative diseases. Cell Mol Life Sci. 2006;63:877–889. doi: 10.1007/s00018-005-5338-2. [DOI] [PMC free article] [PubMed] [Google Scholar]
- Zhao J, Fu Y, Yasvoina M, Shao P, Hitt B, O'Connor T, Logan S, Maus E, Citron M, Berry R, Binder L, Vassar R. Beta-site amyloid precursor protein cleaving enzyme 1 levels become elevated in neurons around amyloid plaques: implications for Alzheimer's disease pathogenesis. J Neurosci. 2007;27:3639–3649. doi: 10.1523/JNEUROSCI.4396-06.2007. [DOI] [PMC free article] [PubMed] [Google Scholar]
- Zou L, Wang Z, Shen L, Bao GB, Wang T, Kang JH, Pei G. Receptor tyrosine kinases positively regulate BACE activity and Amyloid-beta production through enhancing BACE internalization. Cell Res. 2007;17:389–401. doi: 10.1038/cr.2007.5. [DOI] [PubMed] [Google Scholar]