

Summary
The pathophysiology of multiple sclerosis (MS) is characterized by demyelination, which culminates in a reduction in axonal transmission. Axonal and neuronal degeneration seem to be concomitant features of MS and are probably the pathological processes responsible for permanent disability in this disease. The retina is unique within the CNS in that it contains axons and glia but no myelin, and it is, therefore, an ideal structure within which to visualize the processes of neurodegeneration, neuroprotection, and potentially even neurorestoration. In particular, the retina enables us to investigate a specific compartment of the CNS that is targeted by the disease process. Optical coherence tomography (OCT) can provide high-resolution reconstructions of retinal anatomy in a rapid and reproducible fashion and, we believe, is ideal for precisely modeling the disease process in MS. In this Review, we provide a broad overview of the physics of OCT, the unique properties of this method with respect to imaging retinal architecture, and the applications that are being developed for OCT to understand mechanisms of tissue injury within the brain.
Keywords: macular volume, multiple sclerosis, optical coherence tomography, pupillometry, retinal nerve fiber layer
Review Criteria
Data used in the development of this Review were derived from searches performed in MEDLINE and PubMed (without restriction to the year of publication). The search terms used were “Optical Coherence Tomography” combined with “retinal nerve fiber layer”, “multiple sclerosis”, “optic neuritis”, and “optic neuropathy”. The search was completed in January 2008 and revised and updated as necessary.
Introduction
Multiple sclerosis (MS) is being increasingly recognized as a complex neurodegenerative disorder of the brain and spinal cord that involves autoimmune mechanisms that target both white and gray matter elements. The disease is characterized by demyelination, gliosis, axonal dysfunction, and, ultimately, neuronal loss.1 The vast majority of individuals destined to have confirmed MS later in their lives will already exhibit disseminated plaque lesions, as revealed by conventional MRI techniques, at the time of their first inflammatory demyelinating event.2 New and revised diagnostic criteria have enabled us to expedite the confirmation of MS, with substantial implications for early intervention with disease-modifying treatment.2–4 However, the ability to accurately image both neurodegeneration and its prevention in MS would greatly facilitate the systematic evaluation of novel therapeutics and their efficacy over time.
In MS, a dissociation is widely acknowledged to exist between the lesional burden seen on MRI scans and the corresponding clinical deficits documented on formal neurological examination, a phenomenon referred to as the ‘clinico-radiological paradox’.5 Evidence has emerged that links early inflammation (e.g. clinical exacerbations and MRI lesions) with a likelihood of disease-related disability, and with the timescale of its evolution. For instance, we now recognize that patients with high MRI lesion burdens at presentation represent a high-risk group for early and substantial disability.6 While substantial ‘silent’ disease activity is a classic feature of MS, the gradual accumulation of lesions will ultimately lead to the disconnection of disparate and clinically relevant neural pathways.
The application to MS of nonconventional MRI techniques such as magnetization transfer imaging, magnetic resonance spectroscopy, and diffusion tensor imaging, has led to modest achievements in linking imaging data with clinical measures of disease severity.7 However, despite these improvements, until recently the progress in coupling specific clinical syndromes in MS with pathological changes within discrete tract systems was limited.8–10 This Review describes a number of advancements in the application of optical coherence tomography (OCT), a technology that enables objective analysis of the processes of neurodegeneration within a highly discrete and eloquent CNS structure—the retina. OCT enables investigators to rapidly and reproducibly evaluate the structural composition of the retina and to provide unique insights into this structure. While already validated for the longitudinal assessment of glaucoma11,12 and macular degeneration,13 OCT is currently being investigated for its utility in tracking the progress of neurodegeneration in MS. Ultimately, OCT could substantially increase our understanding of the mechanisms of tissue injury in MS, could be used to identify new therapeutic strategies focused on neuroprotection of central axonal and neuronal structures, and could even enable the detection and monitoring of the processes of neurorestoration, a treatment goal not yet within the capability of the neurologist (but certainly a central goal in modern neurobiology).
Benefits of Early Diagnosis and Treatment in MS
The benefits of early treatment in MS are now widely accepted. Three studies based on class I evidence have been published that have demonstrated clinical and radiographic benefits (at least in the short term) in individuals with MS who were treated at the time of the first exacerbation of their disease compared with those who were randomly allocated to receive placebo.14–16 Furthermore, extensions of these studies suggested that the individuals in whom treatment was delayed for 2 years because of allocation to placebo accrued more disease activity and, when later treated, seemed to derive much less benefit, than did those who were treated at presentation.17
During the transition from the inflammatory to the degenerative and progressive phases of MS, immunological mechanisms that underlie adaptive and innate immune dysregulation continue to operate, as they most probably do from the inception of the disease process. However, with an increasing burden of tissue injury over time, certain thresholds may be exceeded beyond which repair processes are ineffective.18 Microglia-mediated injury cascades, along with the amplification of excitatory amino acid mechanisms, seem to figure prominently in the emerging predominance of innate immune mechanisms (particularly when such mechanisms are no longer acting in response to foreign antigens such as viruses or bacteria but instead are directed against self-epitopes, as in autoimmune diseases).19 The ability to generate or harness neuroprotective mechanisms would usher in a new era of therapeutic neurobiology with implications for neurodegenerative disorders in general, and MS in particular.
The Eye as A Model of Neurodegeneration
The retina is a unique CNS structure in that it contains axons and glia in the absence of myelin. The macula (which is about 1,200 μm in diameter) is easily identified within the retina, where it produces its characteristic depression, with the center diameter of about 200 μm being occupied by the fovea and foveola. The foveal portion of the macula contains the highest density of cones, which contribute most to acuity-based and color visual processing. With the understanding that myelination in the visual pathway begins slightly behind the eye at the level of the lamina cribrosa, this unique structural specialization of the retina provides an opportunity to study the proximal effect on isolated axons of a disease process that most often occurs in the retrobulbar myelinated portion of the optic nerve.
Recent studies have demonstrated that optic neuritis seems to provide a useful clinical model with which to couple clinical measures of visual function with validated and objective structural and physiological correlates of MS.20 The anterior visual system is such a frequent target of the MS disease process that, on post-mortem analysis, almost all patients with MS are found to have characteristic MS changes in the retina and optic nerve, regardless of whether they have previously experienced acute optic neuritis (AON)21,22—although as many as 30–70% of patients with MS will, in fact, have inflammatory optic neuritis during the course of their disease.20,23 When an individual has no history of the disorders that produce such characteristic findings (e.g. glaucoma and macular degeneration), these findings are typically absent. These data suggest that the visual system has a very high predilection for developing disease-related disability both from acute episodes of AON and from the more-constitutive elements of the disease process that contribute to an MS-related chronic optic neuropathy, and that it could be used effectively to illustrate the histopathology of the disease process in MS.
In contrast with occult optic neuropathy in MS, which is a largely subclinical manifestation of disease in the anterior visual system, most cases of AON are associated with pain and with visual disturbances, including diminished vision, color desaturation, poor low-contrast acuity and sensitivity, and field abnormalities.20 AON can, therefore, be evaluated with clinical and neurophysiological techniques, such as patient-reported acuity (high and low contrast) and sensitivity, visual field analysis, and visual evoked responses.20,23 Furthermore, coronal, fat-suppressed, T1-weighted gadolinium-enhanced MRI will reveal enhancement in the optic nerve in over 90% of cases of optic neuritis, confirming a breach in the integrity of endothelial tight junctions at the blood–brain barrier.24 Studies with conventional MRI have shown that the optic nerve area declines subsequent to an event of AON in MS, when compared with the unaffected (or at least not acutely affected) eye.25 Retinal imaging techniques have added greatly to our knowledge of this area, revealing further changes in retinal architecture that reflect alterations in visual system physiology and function. For instance, the measurement of low-contrast letter acuity has been validated as a useful and reproducible measure of visual function in patients with MS who present with acute optic neuritis but do not have a known history of this condition.26,27 Visual function has been shown to directly relate to the integrity of retinal anatomy, with abnormalities in this complex structure following optic neuritis producing corresponding clinical deficits in patient performance on vision tests.28 However, since visual function is a measure of both anterior and posterior visual pathways, and patient-reported measures can be highly subjective and modified by a number of factors (e.g. fatigue, ambient and core body temperature, exercise, stress, and infection), novel imaging approaches that are specific to the retina and optic nerve may enable more-specific, more-reliable, and more-reproducible quantification of axon injury related to optic neuritis.29
A direct bedside visualization of the retina and optic nerve was first achieved in 1851 following the introduction of the hand-held ophthalmoscope by Helmholtz.30 Over a century later, in 1974, Frisén and Hoyt reported for the first time a subjective analysis of thinning of the retinal nerve fiber layer (RNFL; which is principally composed of axons from ganglion cell neurons) in patients with MS, as evaluated with hand-held ophthalmoscopy.31 This observation was corroborated in 1994 in a post-mortem study that demonstrated atrophy of the RNFL in 35 out of 49 eyes of patients with MS.32 Nevertheless, this study was not sufficiently quantitative to enable a full appreciation of the relationship between vision, RNFL thickness, and the integrity of the approximately 1.2 million axons that make up the optic nerve.
In recent years, we have observed the emergence of ‘quantitative ophthalmoscopes’ such as Heidelberg Retinal Tomography (HRT), laser polarimetry with variable corneal compensation (GDx-VCC), and OCT, all of which can be used to efficiently and objectively measure changes in structural architecture within the retina.28,33
The Physics of Optical Coherence Tomography
OCT was first reported by Huang et al. in 1991.34 In vivo retinal imaging was first demonstrated in 1993,35,36 and early studies in 1995 provided the first demonstration of OCT imaging of the normal retina37 and of macular pathology.13 OCT is the optical analog of ultrasound B-mode imaging (Box 1). With OCT, high-resolution cross-sectional or three-dimensional images of the internal retinal structure are generated by an optical beam being scanned across the retina and the magnitude and echo time delay of backscattered light being measured (Figure 1). In contrast to ultrasonography, direct detection of light echoes is not possible with OCT, because the speed of light is much faster than the speed of sound; therefore, correlation techniques must be used. Early OCT systems were based on low coherence interferometry, a technique initially demonstrated by Sir Isaac Newton. With this technique, measurements are performed by use of a Michelson-type interferometer with a low-coherence-length, superluminescent diode light source. One arm of the interferometer directs light onto the sample and collects the backscattered signal. A second reference arm has a reflecting mirror, which is mechanically controlled to vary the time delay and measure interference. The use of a low-coherence-length light source means that interference occurs only when the distance traveled by the light in the sample and reference arms of the interferometer match to within the coherence length. This characteristic enables measurement of the echo delays of the light from the tissue with extremely high temporal accuracy. The resulting data set is a two-dimensional or three-dimensional array, which represents the optical backscattering in a cross-section or volume of the tissue. These data can be processed and displayed as a two-dimensional or volumetric gray-scale or false-color image (Box 1).
Box 1. The characteristics of optical coherence tomography (OCT)
Physical properties
Optical analog of ultrasonography
Generates cross-sectional images by measuring back-reflected echoes of light
Interferometric methods are used to detect echoes, since the speed of light is too fast to be measured by direct detection
Current technology has 8–10 μm resolution; newly available technology has 5–7 μm resolution
Imaging metrics (current technology)
Average retinal nerve fiber layer (RNFL) thickness
Quadrant and clockface sector analyses
Total macular volumes
Quadrant assessment of parafoveal areas
Inferior and superior quadrants of the RNFL are thickest (double hump waveform on temporal-superior-nasal-inferior-temporal [TSNIT] analyses)
Imaging metrics (new technology)
Full RNFL mapping
Mapping of intraretinal layers in the macula
Three-dimensional OCT of optic nerve head topography and internal structure
Technology is new and metrics remain to be defined
Biomarker features and validation
Correlates with high-contrast and low-contrast visual acuity
Pathological distribution predicts visual field changes
OCT metrics predict brain atrophy
Subtypes of multiple sclerosis predict severity of RNFL thinning
Measures of laser polarimetry with variable corneal compensation (GDx-VCC) corroborate OCT evidence of axonal degeneration
Application features
Testing performance is quick and easy
Pupil dilation is typically not required
Low coefficient of variation for repeated measures
Low inter-individual and intra-individual variation
Low variability across different centers using the same device
Scan quality can be assured with disc centering and adequate signal strength
Figure 1.

High-resolution images of the internal retinal structure taken with optical coherence tomography (OCT), demonstrating the processes involved in using this technology. (A) Low-coherence infrared light is transmitted into the eye through use of an interoferometer. (B) The infrared light is transmitted through the pupil and then penetrates through the transparent nine layers of the retina. Subsequently, the light backscatters and returns through the pupil, where detectors can analyze the interference of light returning from the layers of the retina compared with light traveling a reference path (mirror #2). An algorithm mathematically uses this information to construct a gray-scale or false-color image representing the anatomy of the retina (shown in the upper right portion of the figure). (C) A fundus image from the OCT device, showing the optic disc appropriately centered and surrounded by the target image circumference marker for analysis of the retinal nerve fiber layer.
Since the inception of OCT, its performance has been improved by dramatic technological advances.38 The development of ‘Fourier domain’ (or ‘spectral domain’) detection, a technique first proposed in 1995, has in particular enhanced ophthalmic OCT technology. Spectral domain OCT detects light echoes by measuring the interference spectrum of the infrared light by use of an interferometer with a stationary reference arm. A spectrometer and high-speed line-scan camera record the interference spectrum, which is Fourier transformed to obtain the magnitude and echo time delay of the light (the axial scan). Spectral domain OCT detects all light echoes simultaneously, leading to a dramatic increase in sensitivity that enables high-speed imaging.39–41 Retinal imaging with spectral domain OCT became possible only with recent advances in camera technology. The first retinal images with this technique were reported in 2002,42 and high-speed, high-resolution retinal imaging was demonstrated in 2003.43,44 The technology became commercially available in 2006; most commercial instruments achieve axial image resolution of 5–7 μm with imaging speeds of 25,000 axial scans per second, approximately 50 times faster than the previous generations of OCT technology.39–45
Application of Optical Coherence Tomography in MS
The earliest application of OCT technology to the study of MS was reported by Parisi et al. in 1999.46 In this study, which used first-generation OCT technology, 14 patients with MS who had completely recovered from a previous event of optic neuritis were compared with 14 age-matched control individuals with respect to RNFL thickness measures. The thickness of the RNFL was shown to be reduced by an average of 46% in the affected eyes of the patients with MS versus the eyes of controls (P <0.01), and by an average of 28% when affected eyes were compared with the ‘unaffected’ eyes of the same patient (P <0.01). Even in the supposedly unaffected eyes of the patients, however, there was an average 26% reduction in RNFL thickness when compared with control eyes (P <0.01).
In 2005, Trip and colleagues reported their observations with early generation OCT technology in 11 patients with MS and 14 patients with clinically isolated syndrome, all of which individuals had a history of a single episode of optic neuritis.47 The study was a cross-sectional analysis with follow-up ranging from 1 to 9 years after the optic neuritis event. Corroborating the previous findings of Parisi et al., the investigators found an average 33% reduction in RNFL thickness in the affected eyes of patients when compared with the eyes of matched controls, and an average 27% reduction when the affected and unaffected eyes of the same patient were compared (P <0.001). Trip et al. extended the utility of OCT by also showing that the macular volume (a reflection of retinal ganglion cell neuronal integrity) was reduced by an average of 11% in the affected eyes of patients with a history of optic neuritis when compared with the eyes of control (P <0.001), and by 9% in the affected versus the unaffected eye of the same patient (P <0.001).
An important finding of these studies was that the apparently unaffected eyes of patients with MS were in fact significantly abnormal when compared with the eyes of control individuals but were less abnormal than the eye with a history of AON. This finding indicates that AON signifies accelerated and more-severe histopathological consequences on the retina, in contrast to a more insidious and less perceptible change in individuals without a history of an acute syndrome, in whom the disease process probably more closely resembles glaucoma.
As a validation of the fact that RNFL thinning, as measured by OCT, is attributable to axonal degeneration, Trip and colleagues showed that such measures correlated better with visual evoked potential P100 amplitudes (a measure of axonal integrity or function) than with P100 latency (typically a reflection of myelin integrity).47 It is now generally accepted that disruption of myelin has a direct impact on the function and preservation of axons.1 During the pathological process, however, these two structural elements can become temporarily uncoupled. The axon cylinder might be intact—albeit vulnerable—for a short period during inflammation and myelin disruption. A demyelinated but intact axon can undergo a number of different processes. The axon can be remyelinated if viable adult oligodendrocytes in the vicinity can provide new concentric lamellar internodes, or recovery can also be provided through oligodendrocyte progenitors terminally differentiating into adult process-bearing myelinating cells. Even partial remyelination might be protective and thereby serve to guard against axonal degeneration. Effective repair mechanisms would be expected to ultimately result in greater preservation of RNFL thickness as measured by OCT.
In 2006, Costello and colleagues reported that about 75% of patients with MS who have AON will sustain 10–40 μm of RNFL loss within a period of only about 3–6 months following the initial inflammatory event.48 This finding is striking given that the RNFL is only about 110–120 μm thick by the age of 15 years, and that most individuals (without a history of glaucoma or macular degeneration) will lose only about 0.017% per year in retinal thickness, which equates to approximately 10–20 μm over 60 years.49 Costello et al. also provided compelling evidence to identify an injury threshold within the RNFL of about 75 μm; thinning of the RNFL below this level led to a corresponding decay in visual function, as measured by automated perimetry. This finding suggests that visual function seems to be preserved until a certain level of retinal axonal loss has been reached.
The development of validated measures of visual functioning has greatly facilitated the exploration for a structural biomarker for neurodegeneration in MS. Balcer's group has used performance on low-contrast letter acuity charts to compare retinal structure imaged with early (third) generation OCT technology (OCT 3 with 4.0 software) with visual function in patients with MS who have MS pathology in the anterior visual system.50 In this study, patients with MS and a history of optic neuritis were shown to have lower thickness measures of the RNFL than patients with MS but no history of optic neuritis, as well as lower thickness measures than individuals without a history of either condition. The fact that severity of visual loss (as confirmed by performance on automated perimetry or low-contrast letter acuity) is a predictor of abnormal retinal architecture is further evidence that OCT could be used as a noninvasive approach to monitor the course of disease in patients with MS and that the technique could be used to detect and monitor the efficacy of new therapies targeting mechanisms that might promote neuroprotective effects on retinal axons and ganglion cell neurons (Figures 2–5; Box 1).
Figure 2.
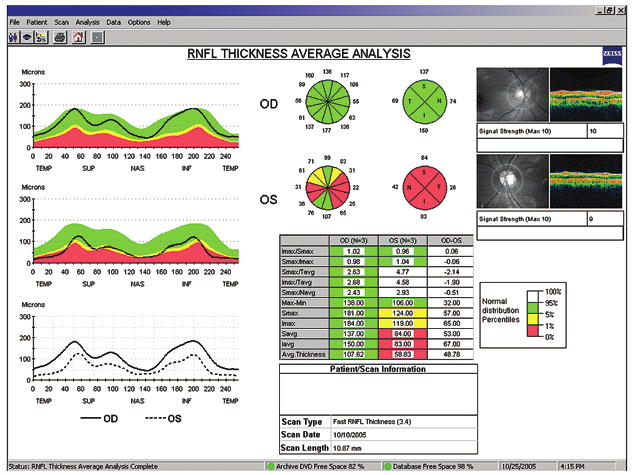
A typical optical coherence tomography (OCT) report from a patient with multiple sclerosis (MS), generated by Zeiss Stratus OCT3™ with software 4.0 (Carl Zeiss Meditec, Inc). On the upper left, retinal nerve fiber layer (RNFL) thickness is plotted (Y axis) with respect to a circumferential retinal map on the X axis (temporal-superior-nasal-inferior-temporal [TSNIT] quadrants of the RNFL). Note the normal ‘double-hump’ appearance of the topographic map of the right eye (OD), signifying the thicker RNFL measures derived from the superior and inferior retina compared with the nasal and temporal regions. Also note the quadrant and clockface sector measures of RNFL thickness (upper middle illustration). The table (lower middle) compiles the quantitative data, including the average RNFL thickness (bottom row). This patient experienced an episode of left optic neuritis 6 months before this study. Note the marked reduction in RNFL thickness across all quadrants (red region denoting values below 1% of what would be expected when compared with a reference population), multiple sectors, and with respect to the average RNFL thickness (bottom row of table). Abbreviations: OD, right eye; OS, left eye.
Figure 5.

Fundus (left), nerve fiber layer maps (middle), and deviation maps (right; compared with normal individuals) derived from laser polarimetry (GDx) imaging of the same patient as is shown in Figure 4. Note the reduction in retinal nerve fiber layer thickness in the inferior neural retinal rim in (A) the right eye compared with (B) the normal left eye, as shown in both the thickness map (less red) and deviation maps (increased colored pixels; arrow).
Axonal and neuronal degeneration might be readily expected to be present in eyes with a known history of AON. In the Balcer investigation that used OCT, RNFL thickness was examined in heterogeneous MS cohorts, and the researchers assessed whether scores for low-contrast letter acuity might also reflect RNFL thinning in the eyes of patients with MS who do not have a history of AON.50 Among 90 patients with MS (180 eyes) and 36 control individuals without MS (72 eyes), the average RNFL thickness was significantly reduced in the former group (including patients with and those without a history of AON). As expected, eyes of patients with MS who had a known history of one or more attacks of AON had significantly lower RNFL thickness (mean 85 ± 17 μm) than did the eyes of patients with MS who did not have an AON history (mean 96 ± 14 μm; P <0.001). RNFL thickness was also reduced in the eyes of patients with MS without an AON history compared with the eyes of control individuals (mean 105 μm; P = 0.03). By use of normative data included in the 4.0 software for the Stratus OCT3™ (Carl Zeiss Meditec, Inc), only 40 (22%) of 180 eyes from patients with MS were determined to have ‘abnormal’ average RNFL thickness.50 In view of the fact that the OCT 4.0 normative database (which is based on a large normal population cohort characterized for age and sex by the manufacturer) considers the fifth percentile for age to be the cutoff for abnormal values, however, abnormalities in RNFL thickness are likely to be of substantially greater prevalence in the eyes of patients with MS and optic neuritis.
Results from the Balcer study also suggest that the ‘unaffected’ eyes of patients with MS who have a history of AON are at a similar risk for axonal loss to the eyes of patients with MS in general; both MS groups have more axonal loss than do age-matched control individuals. The investigators also found that low-contrast letter acuity scores were significantly correlated with overall average RNFL thickness in the eyes of patients with MS (P <0.001 by use of generalized estimating equation models accounting for age and adjusting for within-patient, inter-eye correlations); for every one-line change in low-contrast letter acuity score, an average RNFL thickness difference of 4 μm was noted. Average overall RNFL thickness also declined with increasing degrees of overall neurological impairment and disability in the MS cohort, and the thickness was significantly associated with Expanded Disability Status Scale (EDSS) score and disease duration (P = 0.02 for linear trend across EDSS tertiles 0.0–1.5, 2.0–2.5, and 3.0–7.0).
The severity of RNFL thinning as measured by OCT has now been shown to be predicted through the segregation of MS into its various subtypes (Box 1).51,52 In particular, patients with a more progressive disease course are found to have more-substantial retinal pathology, as measured by RNFL loss. With increasing brain atrophy, as measured by validated metrics (such as the brain parenchymal fraction), there is a corresponding reduction in RNFL thickness.53,54 Thus, the eye would seem to be capable of accurately modeling the mechanisms of neurodegeneration and could even be used to monitor neuroprotection in MS. Specifically, with OCT we can measure the integrity of both neurons and their axonal projections within the retina; the severity of retinal damage directly correlates with clinical visual dysfunction, and with both the severity of MS-related brain pathology (i.e. atrophy) and MS clinical subtype designations (as stratified by disease progression status; Box 1).
The Future of Retinal Imaging in MS
The hypothesis that measures of the RNFL are causally related to visual performance has been corroborated in recent experiments by our group with another type of quantitative ophthalmoscope, GDx-VCC (Box 1). GDx-VCC is based on the projection of polarized light into a tissue (such as the retina) and the measurement of polarization retardation when the light is propagating through a birefringent medium (such as the RNFL). Water is not a birefringent medium and thereby produces no light retardation; as such, edema does not affect GDx measurements. GDx-VCC can be used to generate thickness measures of the RNFL that are analogous and related to measures derived from OCT. The principal structure within the RNFL that serves to retard light is the axonal microtubules; this technology's method is, therefore, distinctly different from that of OCT, which measures RNFL thickness taking into account axons, glia, and tissue water. One of the strengths of GDx is that it would seem to denote the quantitative distribution of the nerve fiber regardless of thickness due to edema.55
Notwithstanding the differences between imaging technologies, we have confirmed that OCT and GDx metrics yield very similar findings with respect to visual loss in patients with MS who have optic neuritis (Figures 4,5).56 Like OCT, GDx-VCC produces measures that correlate with performance on low-contrast letter acuity charts and with changes in visual field; however, GDx can additionally detect abnormalities even when they are highly restricted to a particular distribution (Figures 4,5).
Figure 4.

Data are presented from a patient with multiple sclerosis with a remote episode of right optic neuritis resulting in superior visual field loss. (A) A Humphrey automated perimetry visual field analysis is shown, demonstrating a superior altitudinal field cut, best confirmed on the pattern deviation plot (bottom right). (B) The corresponding optical coherence tomography (OCT) report from the same patient. The OCT report reveals only a 6.58 μm difference in average retinal nerve fiber layer thickness between the two eyes. However, more-prominent discrepancy is demonstrated on quadrant and sector analysis in an inferior distribution. Abbreviations: OD, right eye; OS, left eye.
OCT is also, however, undergoing improvements. The high image-acquisition speeds afforded by the spectral domain instruments enable the generation of high-definition OCT images with increased numbers of transverse pixels and improved coverage of the retina, as well as the acquisition of three-dimensional OCT (3D-OCT) data sets. 3D-OCT imaging is especially promising, because projection image data can be summed to provide a virtual fundus image, which enables precise and reproducible registration of individual OCT images to fundus features.57,58 Together, these features promise to improve the reproducibility of RNFL thickness measurements and other morphometric measurements. Furthermore, 3D-OCT data can be processed to generate virtual circumpapillary scans, which can be co-registered to retinal features during post processing (Figure 6). Volumetric 3D-OCT data also provide comprehensive information about the optic disc. RNFL-thickness maps (analogous to retardance maps from the GDx), or topographic maps (similar to those from HRT), can be generated for greater retinal depth (three-dimensional) analysis.58
Figure 6.

High-definition, ultra-high-resolution optical coherence tomography (OCT) scans. The high data acquisition speeds available with spectral domain detection enable the acquisition of high-definition images with large numbers of transverse pixels. (A) A 10,000 axial scans per second image of the papillomacular axis acquired in 0.6 s. The axial image resolution is approximately 3 μm. The image may be zoomed in the (B) foveal or (C) optic disc regions to visualize details of internal retinal morphology. OCT has been termed “optical biopsy”, and ultra-high-resolution OCT imaging can provide excellent visualization of retinal architecture. Abbreviations: ELM, external limiting membrane; IS/OS, junction between inner and outer photoreceptor segments; NFL, nerve fiber layer; ONL, outer nuclear layer; OPL, outer plexiform layer; RPE, retinal pigment epithelium.
Some important issues remain to be addressed. Different OCT instruments have different measurement protocols as well as different data analysis methods, so careful quantitative studies must be performed to compare morphometry results and to establish consistent normative baselines. In addition, questions remain about which protocols or visualization methods are best suited for a given application, depending upon the disease process and the resultant impact upon axons, neurons, or both. The new OCT devices offer automated disc centering, longitudinal co-registration to minimize scan-to-scan variability, and correction for eye movements that have previously resulted in retinal slip and image quality degradation. These advantages substantially improve the accuracy attained by the examining technician in comparison with earlier OCT technologies for which manual methods of scan alignment is required (a source of scan-to-scan variability). The improved visualization and performance of new OCT technology suggests that this technique will have an increasingly important role in the assessment of processes of axonal and neuronal degeneration in neurological disease in general, and MS in particular.
Conclusions
A major advance in modern neurobiology has been the development of the ability to couple highly stereotyped clinical syndromes with predictable histopathological signatures in discrete neuroanatomical tract systems. We believe that retinal imaging is vital to link these processes in MS. While a clinical outcome of vision testing would at first glance seem to be sufficient to couple pathological mechanisms of MS with relevant outcome measures in clinical trials that test new treatment strategies, our ultimate objective is to determine whether what we observe in the eye is translatable to what we would see in the brain and spinal cord in general (Box 2). The relationship between these anatomical compartments is complex in that the structural composition of the disease process may be similar in both locations, and the potential clinical metrics to be validated for confirming protective or even restorative effects are manifold. As such, we require a structure–function paradigm when designing novel trials, to which the integration of OCT or similar technology is essential. An additional advantage of using these new technologies for the corroboration of neuroprotective effects is that they give serial structural measures over time that are highly reliable, not affected by physiological factors (e.g. temperature, infection, stress or exercise) and have a very low intertest variability.59 By contrast, serial measures of any clinical outcome can be highly variable across time, particularly in a disorder such as MS in which a high degree of reversible conduction slowing (or even block) is well recognized (the so-called ‘Uhthoff phenomenon’).
Box 2. Why model neurodegeneration in multiple sclerosis with optical coherence tomography (OCT) in optic neuritis?
Optic neuritis is among the most common syndromes in multiple sclerosis
Occult optic neuropathy occurs in most patients with multiple sclerosis
Patients predictably seek medical attention early
Visual, physiological, and structural measures can provide a signature for the syndrome
Low-contrast letter acuity measures are valid patient performance outcomes that causally relate to structural changes in the retina
The retinal nerve fiber layer (RNFL) has no myelin and can thereby be considered to be a highly enriched axonal tissue
Changes in the RNFL and macula probably reflect mechanisms of inflammation, demyelination (retrobulbar), axonal degeneration, and neuronal degeneration
The timing of the changes in RNFL that follow acute optic neuritis has been characterized
The rapid changes in RNFL after acute optic neuritis make this syndrome ideal for testing neuroprotective strategies over a short time frame with precise and reproducible measures
Initially employed as a secondary outcome measure in clinical trials of MS, but now with sufficient prospective validation, OCT represents a new primary outcome measure as it directly correlates with a clinically meaningful outcome—contrast letter acuity—for patients. The modeling of processes such as neurodegeneration and neuroprotection in MS will, however, require enormous precision and reproducibility if we are to confirm our assumptions about how the pathology evolves and whether therapeutic intervention to change these processes is feasible. Prospective studies will be required to demonstrate predictive validity of these techniques and the disease specificity of models such as optic neuritis. Specifically, does this window on the brain work only for MS, or are there similar changes in other neurological diseases? A recent report, for example, showed that the RNFL is abnormal in Alzheimer disease,60 and this point requires further investigation to ensure that the RNFL findings in MS are being correctly interpreted.
Ultimately, retinal imaging technologies such as OCT could be used to rapidly evaluate the integrity of the RNFL and the macula for the purpose of tracking disease progression in MS, and could also potentially be used to visualize neuroprotection. Importantly, studies have demonstrated that thinning of the RNFL (through average RNFL, quadrant, and clockface sector analyses) and volume reductions in the macula are associated with stereotypic declines in visual functioning, particularly as measured by low-contrast letter acuity and visual field analyses (Box 1).46–48,50,51,53 Using the eye as a model for the brain would facilitate an efficient, cost-effective strategy by which we could longitudinally follow changes in structure along with their clinical concomitants, and thereby refine our characterization of the disease process in MS and develop the capability to monitor therapeutic effects to alter disease progression.
Key Points
Multiple sclerosis (MS) is characterized by axonal and neuronal degeneration in both the white and the gray matter pathways of the CNS
The retina is devoid of myelin but contains ganglion cell neurons and their associated axons, and it thereby represents an ideal nervous tissue with which to model processes of axonal and neuronal degeneration in MS
Optical coherence tomography (OCT) is a noninvasive retinal imaging technology that can sensitively and rapidly measure changes in structural architecture that are a consequence of the disease process in MS
OCT metrics (retinal nerve fiber layer thickness and macular volumes) have been shown to correlate with clinical measures of vision loss (e.g. low-contrast letter acuity and visual field analyses)
OCT, and perhaps other retinal imaging technologies, may facilitate visualization of the disease process in MS and may be useful in detecting and monitoring the process of neuroprotection in response to therapeutic agents
More-advanced retinal imaging techniques are now available with the advantages of high definition, high speed, automatic optic disc centering, co-registration capability, and eye movement correction analysis, and they will ultimately bring us closer to more directly interrogating CNS tissues to understand the mechanisms of tissue damage and what can be done to prevent it
Figure 3.

An optical coherence tomography (OCT) report for the macular region of the retina from the same patient with multiple sclerosis as is shown in Figure 2. Note the volume reductions in the foveola (central macula) and the parafoveal quadrants on the left of the report. Whereas the reductions in retinal nerve fiber layer thickness implicate loss of ganglion cell axons, macular changes implicate losses of the ganglion cell neurons themselves. While the patient has had no history of optic neuritis in the right eye, there are some subtle macular changes on that side, suggesting occult involvement of this eye as well. Abbreviations: OD, right eye; OS, left eye.
Acknowledgments
This project was supported by the Once Upon A Time Foundation, the Cain/Denius Comprehensive Center for Mobility Research, the Irene Wadel and Robert Atha fund, the Kenney Marie Dixon Pickens fund, and the Jean Ann and Steve Brock Fund for Medical Sciences (EM Frohman). We acknowledge support from the National Institutes of Health R01-EY11289-21, and from the Air Force Office of Scientific Research, Medical Free Electron Laser Program contract FA9550-07-1-0101 (J Fujimoto). The article is supported by National Multiple Sclerosis Society Grants PP115, RG 3208-A-1, RG 3428-A/2 (LJ Balcer), National Multiple Sclerosis Society Translational Research Partnership TR 3760-A-3 (PA Calabresi and LJ Balcer), and National Eye Institute/NIH grant K24 EY 018136 (LJ Balcer).
Footnotes
Competing interests: JG Fujimoto has declared associations with the following companies: Carl Zeiss Meditec, LightLab Imaging and Optovue. G Cutter has declared associations with the following companies and organizations: Accentia Biopharmaceuticals, Alexion Pharmaceuticals, Antisense Therapeutics, BaroFold, Bayhill Therapeutics, Biogen Idec, BioMS Medical, CIBA VISION, Consortium of Multiple Sclerosis Centers, Enzo, Genentech, Genmab, GlaxoSmithKline, Klein Buendel, MediciNova, the Multiple Sclerosis Association of America, MS-CORE, the NHLBI, NINDS, the National Multiple Sclerosis Society, Novartis, PTC Therapeutics, sanofi-aventis, Somnus Therapeutics, Teva, and Vivus. See the article online for full details of the relationships. The other authors declared no competing interests.
References
- 1.Frohman EM, et al. Multiple sclerosis—the plaque and its pathogenesis. N Engl J Med. 2006;354:942–955. doi: 10.1056/NEJMra052130. [DOI] [PubMed] [Google Scholar]
- 2.Frohman EM, et al. The utility of MRI in suspected MS: report of the Therapeutics and Technology Assessment Subcommittee of the American Academy of Neurology. Neurology. 2003;61:602–611. doi: 10.1212/01.wnl.0000082654.99838.ef. [DOI] [PubMed] [Google Scholar]
- 3.McDonald WI, et al. Recommended diagnostic criteria for multiple sclerosis: guidelines from the International Panel on the Diagnosis of Multiple Sclerosis. Ann Neurol. 2001;50:121–127. doi: 10.1002/ana.1032. [DOI] [PubMed] [Google Scholar]
- 4.Polman CH, et al. Diagnostic criteria for multiple sclerosis: 2005 revisions to the “McDonald Criteria”. Ann Neurol. 2005;58:840–846. doi: 10.1002/ana.20703. [DOI] [PubMed] [Google Scholar]
- 5.Leigh RJ, Wolinsky JS. Keeping an eye on MS. Neurology. 2001;57:751–752. doi: 10.1212/wnl.57.5.751. [DOI] [PubMed] [Google Scholar]
- 6.Fisniku LK, et al. Disability and T2 MRI lesions: a 20-year follow-up of patients with relapse onset of multiple sclerosis. Brain. 2008;131:808–817. doi: 10.1093/brain/awm329. [DOI] [PubMed] [Google Scholar]
- 7.Traboulsee A, et al. Disability in multiple sclerosis is related to normal appearing brain tissue MTR histogram abnormalities. Mult Scler. 2003;9:566–573. doi: 10.1191/1352458503ms958oa. [DOI] [PubMed] [Google Scholar]
- 8.Frohman EM, et al. MRI characteristics of the MLF in MS patients with chronic internuclear ophthalmoparesis. Neurology. 2001;57:762–768. doi: 10.1212/wnl.57.5.762. [DOI] [PubMed] [Google Scholar]
- 9.Frohman EM, et al. Quantitative oculographic characterization of internuclear ophthalmoparesis in multiple sclerosis: the versional dysconjugacy index Z score. J Neurol Neurosurg Psychiatry. 2002;73:51–55. doi: 10.1136/jnnp.73.1.51. [DOI] [PMC free article] [PubMed] [Google Scholar]
- 10.Fox RJ, et al. A preliminary validation study of diffusion tensor imaging as a measure of functional brain injury. Arch Neurol. 2008;65:1179–1184. doi: 10.1001/archneur.65.9.1179. [DOI] [PubMed] [Google Scholar]
- 11.Schuman JS, et al. Optical coherence tomography: a new tool for glaucoma diagnosis. Curr Opin Ophthalmol. 1995;6:89–95. doi: 10.1097/00055735-199504000-00014. [DOI] [PubMed] [Google Scholar]
- 12.Schuman JS, et al. Quantification of nerve fiber layer thickness in normal and glaucomatous eyes using optical coherence tomography. Arch Ophthalmol. 1995;113:586–596. doi: 10.1001/archopht.1995.01100050054031. [DOI] [PubMed] [Google Scholar]
- 13.Puliafito CA, et al. Imaging of macular diseases with optical coherence tomography. Ophthalmology. 1995;102:217–229. doi: 10.1016/s0161-6420(95)31032-9. [DOI] [PubMed] [Google Scholar]
- 14.Comi G, et al. Effect of early interferon treatment on conversion to definite multiple sclerosis: a randomised study. Lancet. 2001;357:1576–1582. doi: 10.1016/s0140-6736(00)04725-5. [DOI] [PubMed] [Google Scholar]
- 15.Jacobs LD, et al. Intramuscular interferon beta-1a therapy initiated during a first demyelinating event in multiple sclerosis. CHAMPS Study Group. N Engl J Med. 2000;343:898–904. doi: 10.1056/NEJM200009283431301. [DOI] [PubMed] [Google Scholar]
- 16.Kappos L, et al. Treatment with interferon beta-1b delays conversion to clinically definite and McDonald MS in patients with clinically isolated syndromes. Neurology. 2006;67:1242–1249. doi: 10.1212/01.wnl.0000237641.33768.8d. [DOI] [PubMed] [Google Scholar]
- 17.Kinkel RP, et al. IM interferon beta-1a delays definite multiple sclerosis 5 years after a first demyelinating event. Neurology. 2006;66:678–684. doi: 10.1212/01.wnl.0000200778.65597.ae. [DOI] [PubMed] [Google Scholar]
- 18.Frohman EM, et al. Characterizing the mechanisms of progression in multiple sclerosis: evidence and new hypotheses for future directions. Arch Neurol. 2005;62:1345–1356. doi: 10.1001/archneur.62.9.1345. [DOI] [PubMed] [Google Scholar]
- 19.Weiner HL. A shift from adaptive to innate immunity: a potential mechanism of disease progression in multiple sclerosis. J Neurol. 2008;255(suppl 1):S3–S11. doi: 10.1007/s00415-008-1002-8. [DOI] [PubMed] [Google Scholar]
- 20.Balcer LJ. Clinical practice: optic neuritis. N Engl J Med. 2006;354:1273–1280. doi: 10.1056/NEJMcp053247. [DOI] [PubMed] [Google Scholar]
- 21.Ikuta F, Zimmerman HM. Distribution of plaques in seventy autopsy cases of multiple sclerosis in the United States. Neurology. 1976;26:26–28. doi: 10.1212/wnl.26.6_part_2.26. [DOI] [PubMed] [Google Scholar]
- 22.Toussaint D, et al. Clinicopathological study of the visual pathways, eyes, and cerebral hemispheres in 32 cases of disseminated sclerosis. J Clin Neuroophthalmol. 1983;3:211–220. [PubMed] [Google Scholar]
- 23.Frohman EM, et al. The neuro-ophthalmology of multiple sclerosis. Lancet Neurol. 2005;4:111–121. doi: 10.1016/S1474-4422(05)00992-0. [DOI] [PubMed] [Google Scholar]
- 24.Kupersmith MJ, et al. Contrast-enhanced MRI in acute optic neuritis: relationship to visual performance. Brain. 2002;125:812–822. doi: 10.1093/brain/awf087. [DOI] [PubMed] [Google Scholar]
- 25.Hickman SJ, et al. A serial MRI study following optic nerve mean area in acute optic neuritis. Brain. 2004;127:2498–2505. doi: 10.1093/brain/awh284. [DOI] [PubMed] [Google Scholar]
- 26.Balcer LJ, et al. Contrast letter acuity as a visual component for the Multiple Sclerosis Functional Composite. Neurology. 2003;61:1367–1373. doi: 10.1212/01.wnl.0000094315.19931.90. [DOI] [PubMed] [Google Scholar]
- 27.Baier ML, et al. Low-contrast letter acuity testing captures visual dysfunction in patients with multiple sclerosis. Neurology. 2005;64:992–995. doi: 10.1212/01.WNL.0000154521.40686.63. [DOI] [PubMed] [Google Scholar]
- 28.Frohman EM, et al. Optical coherence tomography in multiple sclerosis. Lancet Neurol. 2006;5:853–863. doi: 10.1016/S1474-4422(06)70573-7. [DOI] [PubMed] [Google Scholar]
- 29.Wu GF, et al. Relation of vision to global and regional brain MRI in multiple sclerosis. Neurology. 2007;69:2128–2135. doi: 10.1212/01.wnl.0000278387.15090.5a. [DOI] [PubMed] [Google Scholar]
- 30.Keeler CR. The ophthalmoscope in the lifetime of Hermann von Helmholtz. Arch Ophthalmol. 2002;120:194–201. doi: 10.1001/archopht.120.2.194. [DOI] [PubMed] [Google Scholar]
- 31.Frisén L, Hoyt WF. Insidious atrophy of retinal nerve fibers in multiple sclerosis: funduscopic identification in patients with and without visual complaints. Arch Ophthalmol. 1974;92:91–97. doi: 10.1001/archopht.1974.01010010097001. [DOI] [PubMed] [Google Scholar]
- 32.Kerrison JB, et al. Retinal pathologic changes in multiple sclerosis. Retina. 1994;14:445–451. doi: 10.1097/00006982-199414050-00010. [DOI] [PubMed] [Google Scholar]
- 33.Frohman EM, et al. Modeling axonal degeneration within the anterior visual system: implications for demonstrating neuroprotection in multiple sclerosis. Arch Neurol. 2008;65:26–35. doi: 10.1001/archneurol.2007.10. [DOI] [PubMed] [Google Scholar]
- 34.Huang D, et al. Optical coherence tomography. Science. 1991;254:1178–1181. doi: 10.1126/science.1957169. [DOI] [PMC free article] [PubMed] [Google Scholar]
- 35.Swanson EA, et al. In vivo retinal imaging by optical coherence tomography. Opt Lett. 1993;18:1864–1866. doi: 10.1364/ol.18.001864. [DOI] [PubMed] [Google Scholar]
- 36.Fercher AF, et al. In vivo optical coherence tomography. Am J Ophthalmol. 1993;116:113–114. doi: 10.1016/s0002-9394(14)71762-3. [DOI] [PubMed] [Google Scholar]
- 37.Hee MR, et al. Optical coherence tomography of the human retina. Arch Ophthalmol. 1995;113:325–332. doi: 10.1001/archopht.1995.01100030081025. [DOI] [PubMed] [Google Scholar]
- 38.Drexler W, Fujimoto JG. State-of-the-art retinal optical coherence tomography. Prog Retin Eye Res. 2008;27:45–88. doi: 10.1016/j.preteyeres.2007.07.005. [DOI] [PubMed] [Google Scholar]
- 39.de Boer JF, et al. Improved signal-to-noise ratio in spectral-domain compared with time-domain optical coherence tomography. Opt Lett. 2003;28:2067–2069. doi: 10.1364/ol.28.002067. [DOI] [PubMed] [Google Scholar]
- 40.Choma MA, et al. Sensitivity advantage of swept source and Fourier domain optical coherence tomography. Opt Express. 2003;11:2183–2189. doi: 10.1364/oe.11.002183. [DOI] [PubMed] [Google Scholar]
- 41.Leitgeb R, et al. Performance of Fourier domain vs. time domain optical coherence tomography. Opt Express. 2003;11:889–894. doi: 10.1364/oe.11.000889. [DOI] [PubMed] [Google Scholar]
- 42.Wojtkowski M, et al. In vivo human retinal imaging by Fourier domain optical coherence tomography. J Biomed Opt. 2002;7:457–463. doi: 10.1117/1.1482379. [DOI] [PubMed] [Google Scholar]
- 43.Nassif N, et al. In vivo human retinal imaging by ultrahigh-speed spectral domain optical coherence tomography. Opt Lett. 2004;29:480–482. doi: 10.1364/ol.29.000480. [DOI] [PubMed] [Google Scholar]
- 44.Wojtkowski M, et al. Ultrahigh-resolution, high-speed, Fourier domain optical coherence tomography and methods for dispersion compensation. Opt Express. 2004;12:2404–2422. doi: 10.1364/opex.12.002404. [DOI] [PubMed] [Google Scholar]
- 45.Fercher AF, et al. Measurement of intraocular distances by backscattering spectral interferometry. Opt Commun. 1995;117:43–48. [Google Scholar]
- 46.Parisi V, et al. Correlation between morphological and functional retinal impairment in multiple sclerosis patients. Invest Ophthalmol Vis Sci. 1999;40:2520–2527. [PubMed] [Google Scholar]
- 47.Trip SA, et al. Retinal nerve fiber layer axonal loss and visual dysfunction in optic neuritis. Ann Neurol. 2005;58:383–391. doi: 10.1002/ana.20575. [DOI] [PubMed] [Google Scholar]
- 48.Costello F, et al. Quantifying axonal loss after optic neuritis with optical coherence tomography. Ann Neurol. 2006;59:963–969. doi: 10.1002/ana.20851. [DOI] [PubMed] [Google Scholar]
- 49.Kanamori A, et al. Evaluation of the effect of aging on retinal nerve fiber layer thickness measured by optical coherence tomography [German] Opthalmologica. 2003;217:273–278. doi: 10.1159/000070634. [DOI] [PubMed] [Google Scholar]
- 50.Fisher JB, et al. Relation of visual function to retinal nerve fiber layer thickness in multiple sclerosis. Ophthalmology. 2006;113:324–332. doi: 10.1016/j.ophtha.2005.10.040. [DOI] [PubMed] [Google Scholar]
- 51.Pulicken M, et al. Optical coherence tomography and disease subtype in multiple sclerosis. Neurology. 2007;69:2085–2092. doi: 10.1212/01.wnl.0000294876.49861.dc. [DOI] [PubMed] [Google Scholar]
- 52.Henderson AP, et al. An investigation of the retinal nerve fibre layer in progressive multiple sclerosis using optical coherence tomography. Brain. 2008;131:277–287. doi: 10.1093/brain/awm285. [DOI] [PubMed] [Google Scholar]
- 53.Gordon-Lipkin E, et al. Retinal nerve fiber layer is associated with brain atrophy in multiple sclerosis. Neurology. 2007;69:1603–1609. doi: 10.1212/01.wnl.0000295995.46586.ae. [DOI] [PubMed] [Google Scholar]
- 54.Grazioli E, et al. Retinal nerve fiber layer thickness is associated with brain MRI outcomes in multiple sclerosis. J Neurol Sci. 2008;268:12–17. doi: 10.1016/j.jns.2007.10.020. [DOI] [PubMed] [Google Scholar]
- 55.Banks MC, et al. Scanning laser polarimetry of edematous and atrophic optic nerve heads. Arch Ophthalmol. 2003;121:484–490. doi: 10.1001/archopht.121.4.484. [DOI] [PubMed] [Google Scholar]
- 56.Zaveri MS, et al. Retinal imaging by laser polarimetry and optical coherence tomography evidence of axonal degeneration in multiple sclerosis. Arch Neurol. 2008;65:924–928. doi: 10.1001/archneur.65.7.924. [DOI] [PubMed] [Google Scholar]
- 57.Jiao S, et al. Simultaneous acquisition of sectional and fundus ophthalmic images with spectral-domain optical coherence tomography. Opt Express. 2005;13:444–452. doi: 10.1364/opex.13.000444. [DOI] [PubMed] [Google Scholar]
- 58.Wojtkowski M, et al. Three-dimensional retinal imaging with high-speed ultrahigh-resolution optical coherence tomography. Ophthalmology. 2005;112:1734–1746. doi: 10.1016/j.ophtha.2005.05.023. [DOI] [PMC free article] [PubMed] [Google Scholar]
- 59.Cettomai D, et al. Reproducibility of optical coherence tomography in multiple sclerosis. Arch Neurol. 2008;65:1218–1222. doi: 10.1001/archneur.65.9.1218. [DOI] [PubMed] [Google Scholar]
- 60.Paquet C, et al. Abnormal retinal thickness in patients with mild cognitive impairment and Alzheimer's disease. Neurosci Lett. 2007;420:97–99. doi: 10.1016/j.neulet.2007.02.090. [DOI] [PubMed] [Google Scholar]