

Abstract
Objective
To determine the correspondence between optic disc margins evaluated using disc photography (DP) and optical coherence tomography (OCT).
Methods
From May 1, 2005, through November 10, 2005, 17 healthy volunteers (17 eyes) had raster scans (180 frames, 501 samplings per frame) centered on the optic disc taken with stereo-optic DP and high-speed ultrahigh-resolution OCT (hsUHR-OCT). Two image outputs were derived from the hsUHR-OCT data set: an en face hsUHR-OCT fundus image and a set of 180 frames of cross-sectional images. Three ophthalmologists independently and in a masked, randomized fashion marked the disc margin on the DP, hsUHR-OCT fundus, and cross-sectional images using custom software. Disc size (area and horizontal and vertical diameters) and location of the geometric disc center were compared among the 3 types of images.
Results
The hsUHR-OCT fundus image definition showed a significantly smaller disc size than the DP definition (P<.001, mixed-effects analysis). The hsUHR-OCT cross-sectional image definition showed a significantly larger disc size than the DP definition (P<.001). The geometric disc center location was similar among the 3 types of images except for the y-coordinate, which was significantly smaller in the hsUHR-OCT fundus images than in the DP images.
Conclusion
The optic disc margin as defined by hsUHR-OCT was significantly different than the margin defined by DP.
Optic disc assessment is an important structural measure in the detection and management of glaucoma. Accurate recognition of the disc margin is necessary for various disc assessment methods, including clinical examination, planimetry with optic disc photography (DP), Heidelberg retina tomography (HRT), and optical coherence tomography (OCT).1-5 Unfortunately, no standardized method is available across all technologies for defining the disc margin because each imaging modality provides a unique view of the optic disc. Both DP and HRT provide a conventional en face view of the optic disc region, but each uses a different light source or scanning method; DP uses either white light or red-free light illumination, whereas the HRT reflection image is a false-color representation of reflectance measured using confocal scanning with a 670-nm diode laser.
The current iteration of the commercial OCT (Stratus OCT, software version 4.0; Carl Zeiss Meditec, Dublin, California) defines the disc margin as the end points of the retinal pigment epithelium (RPE) in cross-sectional retinal images.6 The machine acquires 6 radial linear cross-sectional OCT images, and the software defines a disc margin by interpolating among 12 detected points around the optic disc (2 points for each cross section). Stratus OCT disc parameters that are calculated based on this disc margin have been reported as sensitive parameters in glaucoma discrimination.7 However, whether the location of the disc margin identified by RPE termination correlates with the location subjectively identified on a DP image remains unknown. Barkana et al8 reported that vertical disc diameters measured using DP, HRT, and OCT showed a large range of differences, suggesting limited interchangeability of these measures.
A new high-speed ultrahigh-resolution OCT (hsUHR-OCT) device acquires scans with an axial resolution of 3.4 μm and a 24 000-Hz sampling rate, which is more than twice the resolution and 60 times faster than the Stratus OCT.9 This high-speed scanning makes it possible to acquire a series of cross-sectional images (raster scanning) that can then be displayed as an en face OCT fundus image, similar to conventional DP (Figure 1). In addition, hsUHR-OCT creates a series of conventional OCT cross-sectional images. The OCT fundus images can be used to check eye motion during scanning, since any eye motion is visualized as distortion and discontinuity within OCT fundus images. The OCT fundus images also provide a pixel-by-pixel correspondence between the cross-sectional and DP images. This approach eliminates the registration error (eg, scanning path deviated from the planned path) inherent to the Stratus OCT. This approach also provides a unique opportunity to investigate the relationship between the RPE and the planimetrically defined disc margin on the same image.
Figure 1.
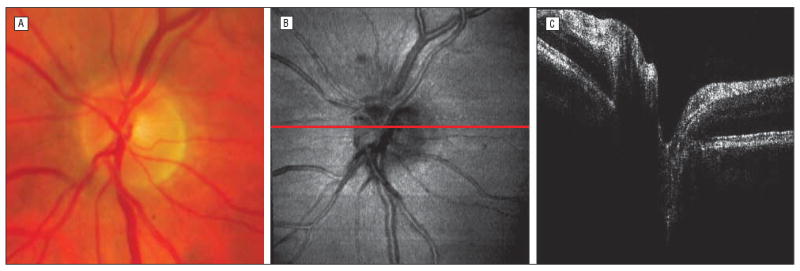
Three types of optic disc images from a single study participant. Although the color disc photograpy image (A) and the optical coherence tomography (OCT) fundus image (B) were not of the same size and orientation, vessel patterns and overall appearance were similar. The cross-sectional OCT image at the red line on the OCT fundus image in B is also shown in C.
On a more fundamental level, disc margins defined by DP and hsUHR-OCT could be different from each other. In other words, the color or gray scale gradient, which we rely on for disc boundary definition, could represent different optical properties because the image acquisition principles of these 2 techniques are different (eg, light source wavelengths and photosensors). Before applying hsUHR-OCT optic disc analysis to clinical data, it is important to know its characteristics compared with conventional DP. The purpose of this study was to determine the correspondence between disc margins as defined by DP and OCT (en face OCT fundus and OCT cross-sectional images) in terms of disc size (disc area and horizontal and vertical diameters) and location (geometric center).
Methods
Study Participants
From May 1, 2005, through November 10, 2005, 17 healthy volunteers were enrolled at the UPMC Eye Center, Department of Ophthalmology, University of Pittsburgh Medical Center. The institutional review board ethics committee approved the study, and all participants gave their approval to participate in the study. This study followed the principles of the Declaration of Helsinki and was conducted in accordance with the Health Insurance Portability and Protection Act.
All study participants underwent a comprehensive ocular examination, stereo DP, and good-quality hsUHR-OCT scanning of the optic disc region in a single visit and reliable Swedish Interactive Thresholding Algorithm standard 24-2 Humphrey automated perimetry (Carl Zeiss Meditec) within a 6-month period. All had best-corrected visual acuity of 20/40 or better, refractive error between −6.00 and +3.00 diopters, a normal ocular examination result, and a visual field glaucoma hemifield test result within normal limits. One eye was randomly selected from each participant if both eyes were eligible.
Imaging
The optic disc region of each eye was imaged by conventional digital simultaneous stereo disc photography (Nidek 3-Dx stereo disc camera; Nidek Inc, Fremont, California) and hsUHR-OCT. Depending on a subjective determination of the best-quality photograph (A.M.), either the right or left side of the stereo disc photograph for each eye was selected and resampled to 501 × 501 pixels. This pixel density matches the horizontal pixel density of the hsUHR-OCT fundus images (Figure 1). Although this undersampled the DP images, none of the observers conceived differences between the undersampled version and the original because usually undersampling sharpens the edges present in the images.
Raster scans obtained with hsUHR-OCT had 180 consecutive frames covering a 6 × 6-mm area around the optic disc and took 3.84 seconds to complete. Each frame had 501 A-scan lines, and each A-scan line contained 1024 points, sampling reflectance in 1.4 mm. An hsUHR-OCT fundus image was created for each raster scan. All pixel intensity values along 1 A-scan line were summed to determine the intensity of each en face pixel (Figure 1). The hsUHR-OCT fundus images were used to check the integrity of the scan during the scanning session by looking for black bands (resulting from blinking during scanning) and/or an abrupt shift of retinal vessels (resulting from eye motion). If such artifacts were observed, scanning was performed repeatedly until no artifacts were discernible.
Disc Margin Assessment
Disc margin assessment was performed in 3 phases using software of our own design: phase 1, disc margins were manually traced on the DP and hsUHR-OCT fundus images; phase 2, RPE edges on hsUHR-OCT cross-sectional images were defined via manual user input; and phase 3, the DP image was aligned with the hsUHR-OCT fundus image by shifting, scaling, and rotating. Phases 1 and 2 were performed independently by 3 glaucoma specialists (A.M., H.I., and G.W.), whereas phase 3 was performed by 1 observer (H.I.). In all phases, images were shown to the observers in a randomized fashion.
In phase 1, each observer defined disc margins by placing multiple anchor points along the disc margin (Figure 2). There was no limit to the number of anchor points that could be placed. The software then used closed curve spline interpolation to draw a line, smoothly connecting the points, to follow the disc margin. The observers adjusted the circle for a complete fit to the disc margin location. This method was similar to that used by HRT. Typically, 6 to 8 anchor points were placed to draw satisfactory disc margins. In phase 2, each observer placed 2 anchor points on the left and right sides of the optic disc at the ends of the RPE on images on which they could identify part of the optic disc and RPE edges (Figure 3). The x-coordinates of each RPE termination were recorded for the analysis. In cases in which no RPE edges were visualized (frames outside the optic disc), the frame was flagged as being outside the optic disc. All observers went through all 180 frames for each hsUHR-OCT raster image. In phase 3, a 50% transparent DP image was superimposed on the corresponding OCT en face fundus image. The observer (H.I.) shifted, scaled, and rotated the DP image to best fit the OCT fundus image independently without seeing any of the disc margin markings (Figure 4).
Figure 2.
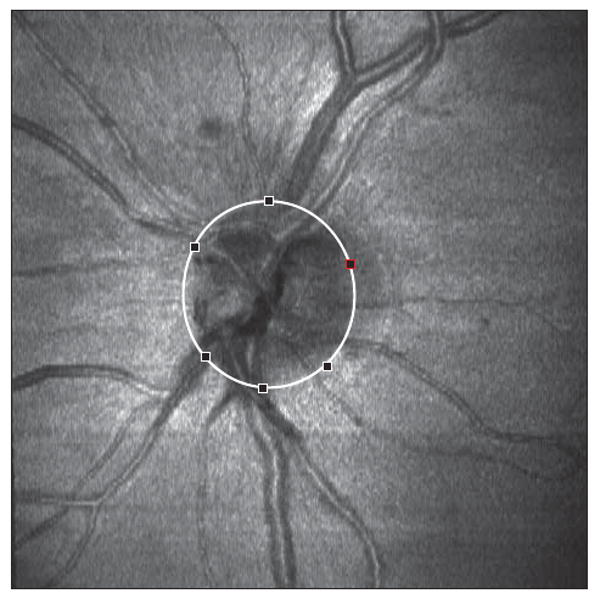
Marking of the optic disc margin on the optical coherence tomography fundus image. The disc margin was marked in a way similar to that used with the Heidelberg retina tomograph. An expert observer added multiple points along the disc margin, and the software automatically drew a smooth continuous line passing through all the points specified. Red and white outlined squares define the disc margin.
Figure 3.
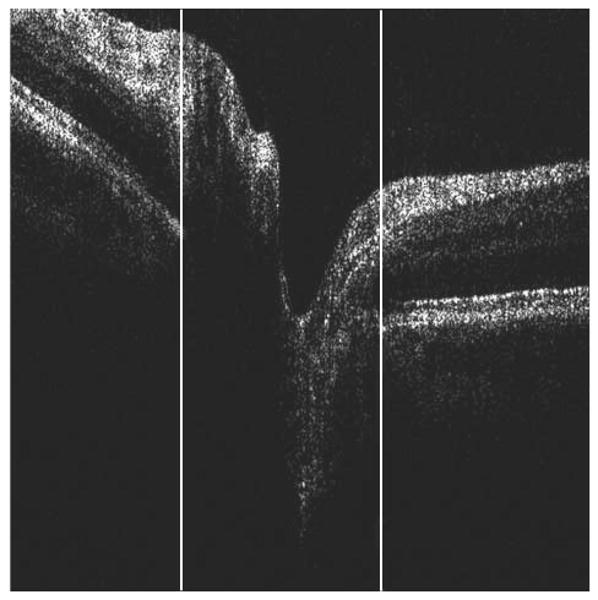
Marking of retinal pigment epithelium (RPE) edges on the cross-sectional optical coherence tomography image. An observer specified the left and right sides of the RPE edges by dragging white lines, as shown. Only the x-coordinate was recorded because the projection of the disc margin location on the en face image was independent of the depth of the RPE termination. In cases in which no RPE edges were observed, the observer flagged the frame as “no edges.”
Figure 4.
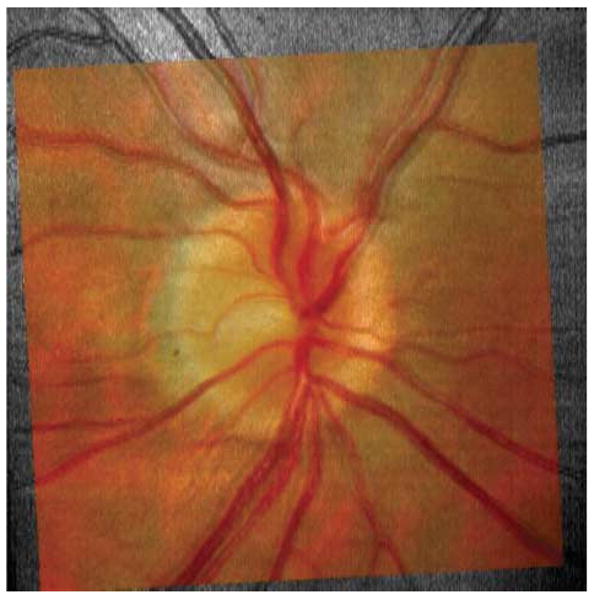
Matching of disc photography and optical coherence tomography fundus images by scaling, shifting, and rotating the images.
Statistical Analysis
Disc size (disc area and horizontal and vertical diameters) and location (x- and y-coordinates of the geometric center of optic disc) for each of the 3 image types were calculated using software of our own design. All calculations were performed after aligning DP images with the corresponding OCT fundus images so that outcome measurements could be directly compared. Horizontal and vertical disc diameters were measured as maximum horizontal and vertical diameters of a given disc margin. Pixel size of 12 μm was used to convert distance measurements in screen coordinates to millimeters. The x- and y-coordinates were measured as screen coordinates of the regular computer pixel bitmap system (501 × 501 pixels).
Mixed-effects models were fitted to the observed values for each parameter (disc area, horizontal diameter, vertical diameter, x-coordinate, and y-coordinate) to account for the correlation among repeated measurements made on each study participant. Observers and methods (disc margin defined on DP, OCT fundus, and cross-sectional images) were treated as crossed-fixed effects. An α = .05 or less was considered statistically significant. The R language and environment (version 2.3.1) was used for statistical graphics and computations.10
Results
Optic disc photographs and hsUHR-OCTs of 17 eyes of 17 healthy volunteers (mean [SD] age, 39.4 [8.2] years; range, 29-63 years) were successfully acquired and assessed. The demographics of the study participants are summarized in Table 1. Although all hsUHR-OCT images had good signal level and did not show any observable blinking or eye motion artifact, alignment of DP images with corresponding hsUHR-OCT fundus images was not perfect in most cases because of subtle distortion caused by minor eye motion during scanning. The mean (SD) disc area as measured by DP was 3.85 (0.76) mm2 (range, 2.35-4.95 mm2), the horizontal diameter was 2.13 (0.23) mm (range, 1.65-2.51 mm), and the vertical diameter was 2.29(0.25) mm (range, 1.84-2.78 mm).
Table 1. Demographic Characteristics of the Study Participants.
| Characteristic | Finding |
|---|---|
| Total No. (%) of eyes | |
| Right | 10 (59) |
| Left | 7 (41) |
| Mean (SD) age [range], y | 39.4 (8.2) [29 to 63] |
| Race, No. (%) | |
| White | 10 (59) |
| African American | 2 (12) |
| Asian | 5 (29) |
| Sex, No. (%) | |
| Male | 10 (59) |
| Female | 7 (41) |
| Mean (SD) spherical equivalent | −1.0 (1.5) [−4.8 to 0] |
| [range], D |
Statistically significant differences were noted among the 3 observers for disc area, horizontal and vertical diameters, and y-coordinate of the optic disc geometric center (Figure 5). The difference between observers for the x-coordinate of the optic disc geometric center was not statistically significant. Table 2 summarizes the difference between mean measurements among the 3 observers with the 3 types of images. The hsUHR-OCT fundus image definition shows a significantly smaller disc area, horizontal and vertical diameters, and y-coordinate of the disc center than the DP definition (P<.001, mixed-effects analysis). The hsUHR-OCT cross-sectional image definition showed a significantly larger disc area and horizontal diameter than the DP definition (P<.001). The x-coordinate of the optic disc geometric center location was similar among the 3 types of images. An example of typical disc margins as defined by the 3 types of images investigated is shown in Figure 6.
Figure 5.

Mean response as a function of observer (A.M., G.W., and H.I.) and method for each measured parameter. A, The x-coordinate. B, The y-coordinate. C, Horizontal diameter. D, Vertical diameter. E, Area. OCT indicates optical coherence tomography.
Table 2. Optic Disc Area, Diameters, and Coordinates of Geometric Center for 3 Types of Imagesa.
| Parameter | DP Mean | OCT Fundus–DP | Cross Section–DP | Cross Section–OCT Fundus | SE for Difference |
|---|---|---|---|---|---|
| Disc area, mm2 | 3.85 | −0.61 (<.001) | 0.41 (<.001) | 1.02 (<.001) | 0.09 |
| Disc diameter, mm | |||||
| Horizontal | 2.13 | −0.16 (<.001) | 0.24 (<.001) | 0.39 (<.001) | 0.03 |
| Vertical | 2.28 | −0.20 (<.001) | 0.05 (.11) | 0.25 (<.001) | 0.03 |
| Disc geometric center | |||||
| x-Coordinate | 229.7 | 1.0 (.50) | −1.6 (.28) | −2.6 (.08) | 1.5 |
| y-Coordinate | 246.4 | −4.8 (.003) | −3.4 (.04) | 1.4 (.38) | 1.6 |
Abbreviations: DP, disc photography; OCT, optical coherence tomography.
Mean differences in bold type are statistically significant (P<.05). P values for mean differences are shown in parentheses.
Figure 6.
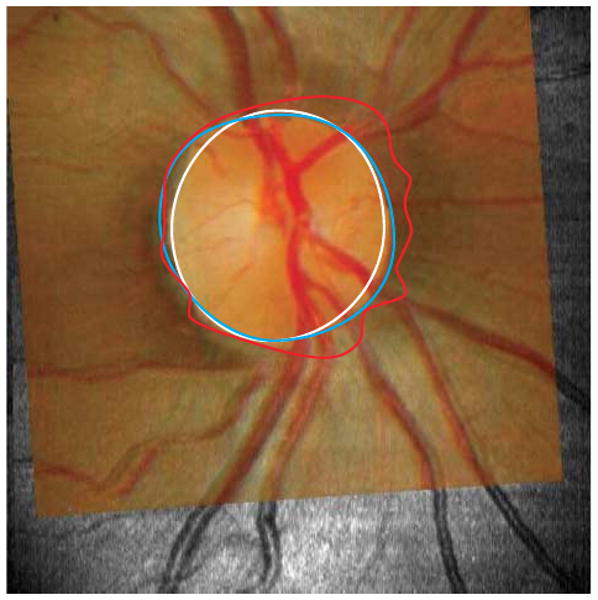
Typical optic disc margins drawn on 3 different types of images. Disc margins defined on disc photography (DP) image (blue outline), optical coherence tomography (OCT) fundus image (white outline), and cross-sectional OCT image (red outline) were shown on the corresponding DP image superimposed onto the matching OCT fundus image. The largest disc area was obtained when the margin was located using the cross-sectional OCT image retinal pigment epithelium termination technique. Location of the margin on the DP image yielded the second largest disc areas, and disc margin location using the OCT en face fundus image yielded the smallest disc areas. The irregularity of the margin of the cross-sectional OCT image was likely due to peripapillary atrophy and vessel shadows.
Overestimates of the disc area and horizontal diameter with the cross-sectional image definition appeared to be associated with peripapillary atrophy and/or shadows cast by large vessels, as could be clearly seen from a qualitative evaluation of the OCT cross-sectional disc margin definition compared with the OCT fundus image disc margin definition. Obstruction of tissue visualization due to shadows cast by large blood vessels is a well-known limitation of OCT (Figure 7). Eleven of 17 eyes had peripapillary atrophy on clinical DPs; 2 eyes had atrophy that was larger than a quarter of the horizontal disc diameter. However, we did not find any statistically significant effect of the existence of atrophy on the measured parameters.
Figure 7.
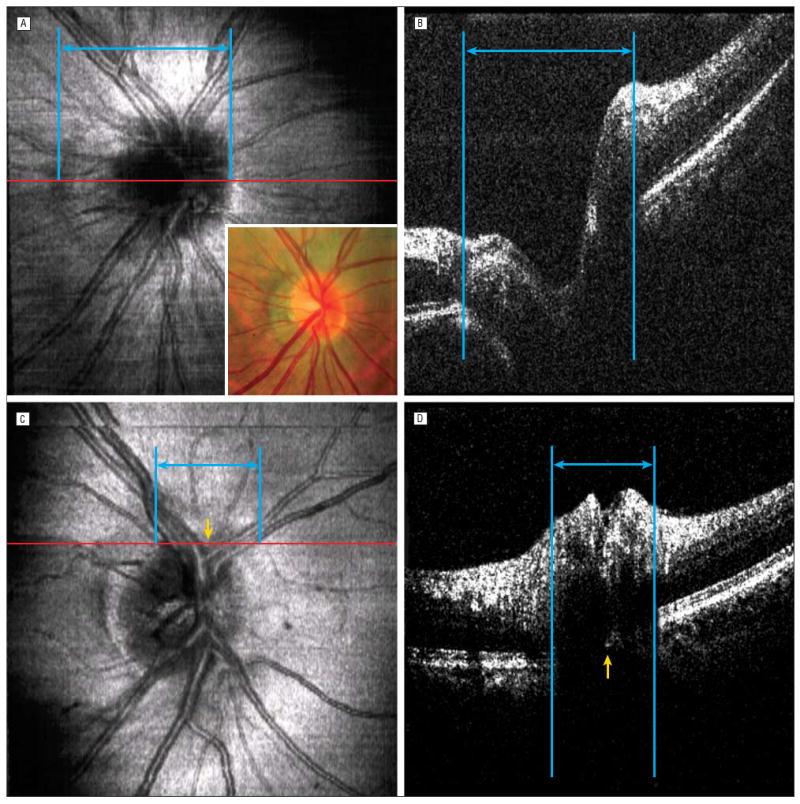
Effects of peripapillary atrophy and vessel shadowing. A and B, Detecting retinal pigment epithelium (RPE) edges on cross-sectional images (B, the frame corresponding to the red line on the optical coherence tomography [OCT] fundus image, A) can be difficult with peripapillary atrophy and major vessel shadowing. B, Because of a weak signal and the sharp kink in the layer representing the RPE-choriocapillaris complex, where the peripapillary atrophy was observed, the left RPE edge was defined erroneously at the margin of the peripapillary atrophy. Because of multiple large vessels at the region (blue lines and arrows), the disc margin identified on the OCT fundus image (C, yellow arrow) was obscured by the shadowing artifact on the cross-sectional image (D, yellow arrow) (the frame corresponding to the red line on the OCT fundus image, C). Corresponding blue lines and arrows indicate where OCT experts defined the RPE edges.
Comment
The Stratus OCT optic disc parameters, which are based on locating the termination of the RPE, have been reported as sensitive parameters in discriminating between glaucomatous and healthy eyes.9 This study showed that the disc area and horizontal diameter were significantly larger on OCT cross-sectional images than on DP planimetry (Table 2 and Figure 5). Specifically, measurement differences in the x- and y-coordinates were 0.7% to 1.9%, respectively, and differences in the disc area and horizontal diameter were 15.8% and 11.1%, respectively. Therefore, disc size was affected by the measurement technique, but the geometric location was not. This finding implies that disc size was overestimated by OCT simply by extending the disc margin boundary so that rim area and cup-disc ratio, which were sensitive parameters in the previous report,9 were modified in a consistent way without altering the critical components of these parameters. This may be the reason that Stratus OCT optic disc parameters performed well.
The overestimation by OCT cross-sectional imaging of disc size with peripapillary atrophy and/or vessel shadows is not surprising. Normal retinal structures are absent at the location where peripapillary atrophy exists, thus creating an illusion that the RPE ends at the outside edge of the peripapillary atrophy (Figure 7). In this study, most of the eyes with peripapillary atrophy showed more extensive atrophy in the horizontal direction than in the vertical. This finding may explain why the disc margin derived from cross-sectional images showed a significant difference in disc area and horizontal diameter, but not in vertical diameter, when compared with the DP method. However, since we did not find any statistically significant effect of the existence of atrophy on the measured parameters, further investigation is required to clarify this matter.
Vessel shadowing was another major factor that affected the disc margin derived from cross-sectional images. Unlike peripapillary atrophy, it created complete obstruction of retinal structures, so observers were forced to mark the edges of the shadows, not the RPE edges (Figure 7). Because of vessel orientation, it also tended to have a larger impact on horizontal diameter than on vertical (Figure 7).
Although hsUHR-OCT fundus images appear to be similar to DP images, these images underestimated the disc size compared with traditional DP planimetry. Contrast at the disc margin on hsUHR-OCT fundus images is not as clear as on DP images. Actually, the gray scale transition over the margin was much smoother than the hue or saturation change on color DP images in our observations. The exact cause of this difference is unknown; however, altering the current method of total pixel reflectance conversion to gray scale (currently linear conversion) may improve the correspondence between DP images and hsUHR-OCT fundus images.
One limitation of this study was the long image acquisition time (3.84 seconds) for hsUHR-OCT raster scanning. Aligning DP images with hsUHR-OCT fundus images was challenging in most cases because there was subtle but noticeable distortion in the hsUHR-OCT images (eg, the distance between 2 major vessel branches was wider or narrower in the hsUHR-OCT fundus image than in the corresponding DP image). The most likely reason for this was small eye movements that occurred during OCT raster scanning. To minimize distortion, shorter image acquisition time is necessary (higher sampling rate and/or fewer sampling points). Another limitation was that we matched DP and OCT fundus images manually, which contributed some variability.
Another limitation of this study was that only disc margin was investigated. Because cup-disc ratio is the most commonly used clinically useful parameter and rim area and volume are among the most useful parameters in OCT and HRT measurements, assessing the cup margin in a similar fashion would also be an interesting and important study. However, we decided not to include the cup margin intentionally because of the following reasons: (1) fully or semiautomated quantitative disc assessment using ocular imaging devices usually starts with detecting the disc margin first, meaning it is the most fundamental parameter; (2) cup margin detection is performed secondarily based on an assumption that cupping occurs only within the disc area, so the accuracy of disc margin detection is essential to reliable cup margin detection; and (3) to our knowledge, this is the first study that has investigated the difference in appearance characteristics that affects human perception of disc margin between DP and OCT fundus images, so we wanted to simplify our question to fully understand the fundamentals of the issue.
Defining the disc margin by detecting the RPE edges on cross-sectional images is well suited for artificial intelligence applications, as demonstrated by Stratus OCT software. However, this technique requires further investigation and refinement because it may be affected by peripapillary atrophy and vessel shadows.
In conclusion, the disc margin defined using hsUHR-OCT was significantly different from the one defined using DP planimetry. Disc size was overestimated with the hsUHR-OCT cross-sectional definition, most likely because of the influence of peripapillary atrophy and vessel shadows.
Acknowledgments
Funding/Support: This study was supported in part by National Institutes of Health contracts RO1-EY11289-20, R01-EY13178-06, P30-EY08098, and P30-EY13078, National Science Foundation contracts ECS-0119452 and BES-0522845, Air Force Office of Scientific Research contract FA9550-040-1-0011, Medical Free Electron Laser Program contract FA9550-040-1-0046, The Eye and Ear Foundation, and an unrestricted grant from Research to Prevent Blindness, Inc.
Footnotes
Financial Disclosure: Drs Fujimoto and Schuman receive royalties from intellectual property licensed by the Massachusetts Institute of Technology to Carl Zeiss Meditec. Dr Schuman receives research support from Carl Zeiss Meditec.
Previous Presentation: This study was presented in part at the Association of Research in Vision and Ophthalmology annual meeting; May 3, 2006; Fort Lauderdale, Florida.
References
- 1.Wollstein G, Garway-Heath DF, Hitchings RA. Identification of early glaucoma cases with the scanning laser ophthalmoscope. Ophthalmology. 1998;105(8):1557–1563. doi: 10.1016/S0161-6420(98)98047-2. [DOI] [PubMed] [Google Scholar]
- 2.Garway-Heath DF, Poinoosawmy D, Wollstein G, et al. Inter- and intraobserver variation in the analysis of optic disc images: comparison of the Heidelberg retina tomograph and computer assisted planimetry. Br J Ophthalmol. 1999;83(6):664–669. doi: 10.1136/bjo.83.6.664. [DOI] [PMC free article] [PubMed] [Google Scholar]
- 3.Park KH, Caprioli J. Development of a novel reference plane for the Heidelberg retina tomograph with optical coherence tomography measurements. J Glaucoma. 2002;11(5):385–391. doi: 10.1097/00061198-200210000-00003. [DOI] [PubMed] [Google Scholar]
- 4.Miyake K, Uchida H, Sugiyama K, et al. Quantification of retinal nerve fiber defects in glaucoma: three-dimensional analysis by Heidelberg retina tomograph. Jpn J Ophthalmol. 2003;47(4):347–350. doi: 10.1016/s0021-5155(03)00076-5. [DOI] [PubMed] [Google Scholar]
- 5.Schuman JS, Wollstein G, Farra T, et al. Comparison of optic nerve head measurements obtained by optical coherence tomography and confocal scanning laser ophthalmoscopy. Am J Ophthalmol. 2003;135(4):504–512. doi: 10.1016/s0002-9394(02)02093-7. [DOI] [PubMed] [Google Scholar]
- 6.Lai E, Wollstein G, Price LL, et al. Optical coherence tomography disc assessment in optic nerves with peripapillary atrophy. Ophthalmic Surg Lasers Imaging. 2003;34(6):498–504. [PMC free article] [PubMed] [Google Scholar]
- 7.Wollstein G, Ishikawa H, Wang J, et al. Comparison of three optical coherence tomography scanning areas for detection of glaucomatous damage. Am J Ophthalmol. 2005;139(1):39–43. doi: 10.1016/j.ajo.2004.08.036. [DOI] [PubMed] [Google Scholar]
- 8.Barkana Y, Harizman N, Gerber Y, et al. Measurements of optic disk size with HRT II, Stratus OCT, and funduscopy are not interchangeable. Am J Ophthalmol. 2006;142(3):375–380. doi: 10.1016/j.ajo.2006.03.065. [DOI] [PubMed] [Google Scholar]
- 9.Wojtkowski M, Bajraszewski T, Gorczynska I, et al. Ophthalmic imaging by spectral optical coherence tomography. Am J Ophthalmol. 2004;138(3):412–419. doi: 10.1016/j.ajo.2004.04.049. [DOI] [PubMed] [Google Scholar]
- 10.R Development Core Team. The R Manuals. [October 19, 2007]; http://www.R-project.org.