

Abstract
We demonstrate and compare two image processing methods for visualization and analysis of three-dimensional optical coherence tomography (OCT) data acquired in eyes with different retinal pathologies. A method of retinal layer segmentation based on a multiple intensity thresholding algorithm was implemented in order to generate simultaneously outer retinal topography maps and reflectivity maps. We compare the applicability of the two methods to the diagnosis of retinal diseases and their progression. The data presented in this contribution were acquired with a high speed (25,000 A-scans/s), high resolution (4.5 μm) spectral OCT prototype instrument operating in the ophthalmology clinic.
1. Introduction
Optical coherence tomography (OCT) is an optical imaging technology, which at present has its most widespread application in the field of clinical ophthalmology. OCT, along with scanning laser ophthalmoscopy, scanning laser polarimetry, and other novel imaging methods, provides clinical information that previously was sought only with standard fundus photography and fluorescein angiography. Instruments based on OCT technology provide a wide range of imaging protocols and different tools for quantitative analysis of the retina, including mapping of the retinal thickness, measurement of nerve fiber layer (NFL) thickness, and optic nerve head (ONH) parameters.
OCT is based on an interferometric technique known as white light interferometry [1]. In most OCT systems the measurements are performed using a Michelson interferometer with a light source of low coherence length. The light beam is split into two arms of the interferometer: one arm is terminated by a reference mirror and the second one by the object analyzed. There are two ways of detecting OCT interferometric signals: in time and in optical frequency domains. Time domain OCT (TdOCT) instruments use the reference arm delay line comprising a mechanical scanner. Interference between the light from the sample and the reference mirror occurs only when the distance travelled by light in both interferometer arms matches to within the coherence length. In classic OCT systems there are tradeoffs between detection sensitivity and imaging speed or axial image resolution. The Fourier domain detection method overcomes this limitation. In Fourier domain optical coherence tomography information about the internal structure of an object is retrieved from the interferometric signal detected as a function of optical frequencies [2]. This kind of interference pattern is called spectral fringe signal. Fourier domain OCT detection can be performed in two ways: spectral OCT (SOCT) also called spectral domain OCT and swept source OCT. SOCT uses a spectrometer with a high speed, multichannel photodetector and swept source OCT utilizes a rapidly tunable laser source and a single photodiode for the detection of the fringe pattern. Application of Fourier domain detection to OCT improves imaging speed and resolution, and yields significant improvement of OCT images [3]. This enables development of new methods for quantitative analysis and visualization of retinal structure and pathology [4-6].
Spectral optical coherence tomography allows high resolution and high speed imaging of human retina in vivo [3, 4, 7, 8]. New commercially available instruments based on spectral OCT technology can acquire 512 A-scans in 25 milliseconds. Therefore, dense raster scanning protocols can be implemented in these instruments, enabling acquisition of three-dimensional (3-D) data. The associated improvement in the coverage of the retina increases the probability of revealing focal pathological changes [5]. Once collected, the 3-D data can serve as a reference for tracking disease progression or the healing process. This raises the question how to determine universal markers to allow fast and repeatable comparison of retinal images in long term studies. One of the most promising methods is quantitative analysis of outer retinal layers usually well reconstructed by OCT techniques.
Many macular diseases involve outer retinal layers, including retinal pigment epithelium (RPE) and photoreceptor cells bodies. Previous work in the field of ultrahigh resolution OCT shows that the structural changes present in the posterior retina correlate well with disease progression [4, 9-15]. Therefore, we assume that fine analysis of this region should indicate potential markers for monitoring the disease progression. However, the interpretation of OCT cross-sections is still equivocal [16, 17], especially in the region of the outer retina. A new hypothesis, concerning the correspondence of the brightly scattering outer part of the retina visible in OCT cross-sectional images with histological features, founded on observations with ultrahigh resolution OCT, has been recently developed [18]. According to this hypothesis, the outermost bright contour of the highly scattering outer retina corresponds to the area where the basal membrane of RPE converges with the Bruch's membrane and choriocapillaries. The somewhat anteriorly positioned line of similar brightness corresponds to the junction between the inner and outer photoreceptor segments (IS/OS) [17]. However, the high resolution OCT studies show that the relatively thick layer corresponding to RPE and that corresponding to IS/OS, both merge due to small separation between them. Therefore, in some normal (non-pathological) cases, one bright band with a quasi-homogenous distribution of intensity of back-reflected light is apparently visible. This may indicate that the bright signal, which is present between IS/OS and outer part of RPE, probably corresponds to irregularities of the photoreceptor outer segments emerging from the RPE cells. In such case, analysis of the region between these two strongly scattering layers may provide information about the condition of the photoreceptor outer segments. Also, from the technical point of view, it is relatively easy to segment the bright posterior part of the retina, which is resolvable in OCT images, owing to its high resolution [19].
In ophthalmology, a standard method of assessing retinal pathology consists in analyzing coronal plane oriented images. Therefore, the most desirable representation of 3-D OCT data are en face views of the retina. Such representation of OCT images was exploited by Podoleanu et al. and Hitzenberger et al. in their en-face OCT systems [20-22]. In these instruments images are collected by employing transversal priority scanning [23, 24]. This technology also allows simultaneous measurements of en face OCT images and corresponding confocal ophthalmoscopic images along with cross-sectional OCT at specifiable locations on the confocal image [25]. Unfortunately, such manner of direct en face imaging creates many problems with correct interpretation of measured data. The plane of the retina at the fundus is not flat and this complicates considerably the interpretation of the sections of tissue in the images. This effect is even more severe in high resolution instruments, where the OCT en face slices are very thin (3 μm).
To overcome these problems and continue exploiting en face retinal views for diagnosis and monitoring disease progression, one can use high speed Fourier domain OCT, three dimensional retinal imaging. The curvature of the fundus can be thereby corrected numerically in post processing and en face images can be extracted from 3-D data. Here en face views can be reconstructed using two methods: qualitative mapping of the reflectivity changes in selected retinal layers and quantitative mapping of changes in retinal topography. Reflectivity maps are generated by axial summation of the 3-D OCT data. Summation over the entire depth of the dataset generates OCT fundus views [5, 6, 26]. Unfortunately, information about subtle reflectivity changes in selected retinal layers is usually lost during such procedure. To retrieve this information, the summation should be performed in selected depth ranges corresponding to layers most prone to disease development. The anterior and posterior boundaries of a reflectivity map are selected relatively to a reference surface. Such a surface is defined by segmentation of one of the retinal anatomical layers (usually the RPE) and approximation of its normal shape by a smooth curve. Axial summation of the intensity within selected depth ranges rejects the signal from unwanted layers, thereby enhancing sensitivity to pathology localized in specific retinal layers [26, 27].
In our previous work we proposed a numerical data processing method, which enables delineation of posterior retina, including the retinal pigment epithelium and the junction between photoreceptor inner and outer segments [19, 28]. The method generates three types of contour thickness maps after calculation of a reference surface. The reference contour approximates the shape of the retina at the Bruch's membrane level. The first thickness map displays the distance from the reference surface to RPE and thereby visualizes elevations of RPE. We later refer to this map as “RPE topography.” The second thickness map, called later “IS/OS topography,” presents the distance from the reference surface to IS/OS representing the topography of the retina at the depth of the IS/OS junction. The third map corresponds to the thickness of the outer retinal complex: OCT bright band including RPE and outer segments of photoreceptors. We have already shown that different pathologies yield distinct signatures in these maps allowing for differentiation between various retinal diseases and their quantitative characterization [28].
In this paper, we present an OCT data processing method which enables to obtain simultaneously reflectivity maps and retinal topography maps. Both methods are compared by analyzing three-dimensional OCT data acquired in eyes with retinal pathologies. To this end, five cases of different retinal diseases were selected out of 600 measured eyes. Three patients were followed up in time (up to 30 months). The presented results allow comparing of the two methods of analyzing retinal pathologies. We also show how both methods can be applied to the process of tracking the disease over time.
2. Materials and methods
2.1 OCT instrument and scanning protocols
All data presented in this contribution were obtained with the prototype high-resolution, high speed spectral OCT system constructed at the Institute of Physics of Nicolaus Copernicus University. The instrument has been used on an every-day basis in the ophthalmology clinic of the Collegium Medicum of Nicolaus Copernicus University in Bydgoszcz, Poland since October 2005. A schematic drawing of the spectral OCT system is shown in Fig. 1. In order to achieve the high axial imaging resolution of 4.5 μm we used a Broadlighter D830 light source (Superlum, Moscow) emitting partially coherent light from two coupled superluminescent diodes giving a total wavelength span of 70nm at full-width-half-maximum (L in Fig. 1b.). To ensure high portability and flexibility of the system, the SOCT instrument is based on optical fiber technology with fiber based Michelson interferometer. The detector (D, Fig. 1b.) is a custom made spectrometer comprising a line-scan camera and a volume holographic diffraction grating (1200 lines/mm, Wasatch Photonics). In order to collect three-dimensional data in clinical practice, the total acquisition time cannot exceed a few seconds.
Fig. 1.

a. Schematic diagram of the spectral optical coherence tomography instrument. b. Photograph of the prototype SOCT instrument operating in the ophthalmology clinic.
This was achieved by using a high speed CCD line scan camera (AViiVA M2, Atmel), which enables acquisition of 25,000 axial lines (A-scans) per second preserving a high imaging sensitivity of 95dB. The entire interferometer (I, Fig. 1b.), and the scanning system, is mounted on an adjustable ophthalmic stand (S, Fig. 1b.). The acquisition process and scanning protocols are controlled by a custom designed electronic driving unit (E, Fig. 1b.). To reduce motion artifacts and to facilitate the examination process, either internal or external fixation light can be used. The optical power incident on the eye was 750 μW, consistent with Polish Norms and ANSI safety standards.
The imaging of patients was performed using four different scanning protocols for each measured eye. In order to gain general information about structural changes due to retinal disease, we collected 35 cross-sectional images, each consisting of 3,000 A-scans acquired in less than 4 seconds and covering an area of X = 6 mm by Y = 3 mm. Measurement of a 3 mm range in the superior-inferior direction was dictated by the requirement of a high quality OCT fundus image. This OCT fundus image, and all 35 cross-sections, can be brought into registration with fundus photographs and fluorescein angiographs by post-processing. To maximally enhance the image quality and sensitivity of OCT measurements we used another scan protocol, in which five cross-sectional images, 6,000 A-scans each, are acquired in the 9mm by 1mm area of the retina. The acquisition time is one second. This scan pattern is especially useful in patients with media opacities which may severely suppress the OCT signal. Use of 6,000 A-scans to construct an OCT cross-sectional image, can significantly improve the OCT image and more detailed retinal structure can be revealed. Additionally, the high definition images can be used as representative examples of the examined pathology. They are useful for illustrative purposes. The two remaining scanning protocols implemented in our instrument provide three-dimensional data for quantitative analysis. Both measure the same number (200) of cross-sectional images, 400 A-scans each, within 3 seconds. One covers a 6mm by 6mm and the other 4mm × 4mm area of the retina resulting in lateral resolution of 15μm by 30 μm in the first case and 10μm by 20 μm in the second protocol. The scanning is performed in a raster pattern enabling easy generation of the fundus image. The data are stored in a raw digital form and analyzed after the measurement session. However, a simplified processing is performed immediately after each measurement and the OCT fundus image and selected cross-sectional images are displayed. This enables the operator to estimate whether or not the measurement is free of motion artifacts, and whether the quality of images obtained is sufficient for further processing. The preview of the acquired data can be also used for quick preliminary clinical analysis. If the data contain artifacts impeding or precluding further data processing and/or diagnosis, the measurement is repeated, and the unwanted data overwritten to save disc space. The average disk space required for one imaging session using all four protocols in a single eye is approximately 1.2 GB.
2.2 Data analysis
Optical coherence tomography provides information on retinal structure from data on the intensity distribution of light back-reflected in the eye. Visual estimation of the positions of retinal layers in the tomograms is based on the perceived distribution of backscattered or back-reflected light intensity displayed in the OCT images. The intensity information has to be used to delineate the contour of a specific layer. Almost all segmentation methods applied to OCT data search for interfaces between the imaged retinal layers, but not for the layers themselves. We implemented a method of retinal layers segmentation based on a multiple intensity thresholding algorithm, which delineates areas characterized by similar distribution of back-scattered light intensity [19, 29, 30].
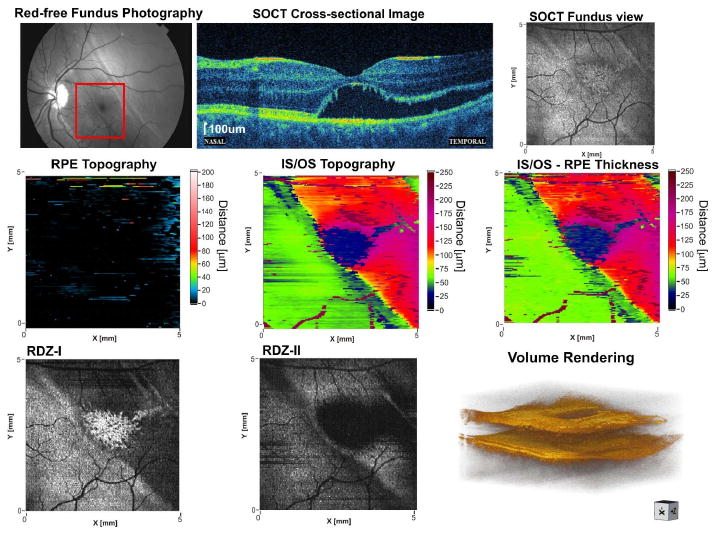
We believe that this approach makes the method less susceptible to failure in case the layer is not smooth or exhibits discontinuities or detachments. A detailed description of the segmentation algorithm is published elsewhere [19]. Here we briefly describe a numerical procedure which is optimized for analysis of the outer retina (in our case, the merged layers of RPE and outer segments of the photoreceptors). This method also enables to obtain reflectivity maps. Figure 2 illustrates the data processing procedures. In the first step, the operator selects one image from the set of 200 OCT cross-sections and defines a rectangular Region of Interest (ROI) indicating the retinal layer of interest (Fig. 2a.). A contour delineating the retinal layer is calculated on the ground of the intensity distribution in ROI and displayed in the OCT image. Any new definition of ROI results in recalculation of the contour and the refreshed outline is superimposed on the cross-sectional image. This interactive procedure assists the operator in making the best ROI choice. A skilled operator can find the optimal ROI in one or two trials. Once the ROI is selected, the entire set of three-dimensional data is processed automatically. During this processing, a coarse delineation of the layer of interest is performed for all 200 images in the 3-D dataset. The posterior part of the delineated contour is used to fit a polynomial function, here referred to as the Outer Retinal Contour (ORC). This curve is calculated automatically for all images from the three-dimensional dataset and creates a reference surface for further steps in the analysis. The shape of the outer retina is reconstructed from the cross-sectional images and depends on the location of the patient's eye with respect to the penetrating beam. It can vary slightly from one measurement to another. Therefore, the order of polynomial function has to be chosen by the operator for each patient individually. Usually it is a parabolic or fourth order approximation. In the next step, each OCT scan is transformed to flatten the Outer Retinal Contour. This operation converts the Outer Retinal Contour surface to the reference plane. At this point, data cropping is performed to remove unwanted brightly scattering retinal layers such as the Nerve Fiber Layer or blood vessels. This helps to increase the stability the further analysis. The flattening and cropping procedures are followed by a detailed analysis of the outer retina. A new ROI is chosen manually for more detailed segmentation. Also the segmentation parameters are changed to ensure high accuracy of the segmentation procedure. The contours outlining the layers are calculated again and appear on the flattened cross-sectional image. They adhere closely to the segmented layers now and the shape of the IS/OS and RPE layers is shown in greater detail. In the next step, our software automatically performs detailed segmentation on each of the two-dimensional images (B-scans) in the 3-D dataset. Simultaneously, it splits the posterior and anterior parts of the contour into lines representing the basal part of the RPE and the IS/OS junction, respectively. The entire processing procedure generates 200 sets of three contours: the RPE, the IS/OS and the ORC, which can be analyzed with respect to each other. The results are displayed as contour maps in a false color scale (Fig. 2b.).
Fig. 2.

a. Image processing procedures applied to OCT data acquired in normal retina: I. definition of the first region of interest (ROI); II. automatic generation of a smooth curve corresponding to the shape of the outer retinal contour (ORC); the order of the polynomial fit is adjusted manually; III. flattening and cropping the cross-sectional images with respect to the ORC and definition of the second ROI; IV. automatic segmentation of the entire set of three-dimensional data and identification of lines representing the basal part of the RPE and the IS/OS junction. b. Contour maps representing the distance between the RPE and the outer retinal contour (RPE topography), ORC and IS/OS (IS/OS topography), and the RPE to IS/OS thickness. c. Generation of reflectivity maps: outer retina is divided into two regions (RDZ-I and RDZ-II) indicated by yellow lines. Axial summation of the RDZ-I and RDZ-II generates corresponding reflectivity maps.
Once the cross-sectional image is flattened, it is also possible to generate reflectivity maps. Such maps display the intensity distribution of light back-reflected from selected retinal layers located at specific depth ranges. The depth ranges are chosen relatively to the reference plane—the flat ORC [26, 27]. Each point of the reflectivity map is generated by summation of intensity of image pixels in the selected section of the corresponding A-scan. A fundus view is a special case of reflectivity map, in which the axial summation is performed over the entire depth of the 3-D dataset. Therefore, the fundus view displays the total intensity of the signal returning from the imaged retina. The reflectivity maps resemble confocal scanning laser ophthalmoscope (cSLO) images. However, in contrast to cSLO, OCT enables precise selection of the locations and thicknesses of the layers. In our analysis we concentrate on the outer part of the retina including photoreceptors and RPE (Fig. 2c.). We divide the outer retina into two separate depths. We refer to these depths as “retinal depth zones” (RDZ). The first retinal depth zone (RDZ-I) contains part of the outer photoreceptor segments, retinal pigment epithelium and a small part of the choroid. The second retinal depth zone (RDZ-II) contains also partially photoreceptor outer segments, photoreceptor inner segments, outer nuclear layer (Fig. 2c.). It is clear that the boundaries of retinal layers are never perfectly parallel to each other especially in eyes with pathology. However, we have selected RDZs in such way that each zone contains one highly scattering layer which dominates in the reflectivity map. In the RDZ-I, the strongest back reflection is in the RPE. In the RDZ-II the dominating signal originates from the IS/OS junction. Reflectivity maps were obtained by manual selection of the retinal depth zones. Visual estimation of chosen depths is based on one of the flattened cross-sectional image.
In this paper we also present the three-dimensional data as sets of jpeg images. Visualization is done by the OSA ISP project. Each 3-D dataset was cropped in the z-axis to minimize the volume of attached files. The data are presented in the logarithmic scale with the aspect ratio of 1:1:3 in horizontal, vertical and depth directions, respectively.
2.3 Patients and examination
Five cases presented in this paper were selected from the set of more than 700 eyes of patients diagnosed with various retinal diseases, including age-related macular degeneration (AMD), central serous choriorethinopathy (CSCR), epiretinal membranes (ERM), macular holes, photoreceptor atrophies, white dot syndrome and others. The age of the patients ranged from 18 to 81 years. Retinal OCT imaging was performed along with complete ophthalmologic examination, including color fundus photography and fluorescein angiography (FA) (TRC-50 EX, Topcon, Japan). All eyes imaged for this publication were free of other ocular pathologies, in particular advanced cataract, corneal opacities, and narrow pupil, which can make retinal examination difficult. Patients with advanced retinal abnormalities, such as geographic atrophy, large CNV with significant edema, or fibrovascular scars, were excluded. All eyes had refractive error between −3.0 and +3.0 D. The imaging was conducted in accordance with the tenets of the Declaration of Helsinki. Written informed consent was obtained from all subjects prior to OCT imaging and after explanation of all possible consequences of the examination. The study protocol was approved by the ethics committee of the Collegium Medicum of Nicolaus Copernicus University, Bydgoszcz, Poland.
SOCT imaging was performed using measurement protocols described above. Patients were asked to look straight at the internal fixation light. An appropriate scan position was achieved by the evaluation of real-time SOCT images visible in the preview mode on the monitor screen. The SOCT prototype employs alternating horizontal and vertical scans in the preview mode. This allows the operator to precisely locate the center of the macula and perform the measurement of three-dimensional data centered at the fovea.
3. Results
3.1 Normal retina
Figure 3 shows two sets of three-dimensional data acquired from a normal retina visualized in the OSA ISP project. To demonstrate the proposed processing methods we created contour maps and reflectivity maps. The images and datasets can serve as a reference indicating the quality of three-dimensional OCT imaging in a healthy eye. The RPE and the IS/OS junction are parallel everywhere except in the foveal region. Therefore, the contour maps of RPE-IS/OS thickness have the form of uniformly green areas, indicating an average distance between RPE and IS/OS junction of about 50 μm (Fig. 2b.). A significant increase of the photoreceptor outer segments length in the foveal region is visible in these maps as a small, irregular yellow area. A slight decrease in the reflectivity of the IS/OS junction in the foveal center gives rise to a small depression visible in the central part of the contour maps. The IS/OS topography has appearance very similar to RPE-IS/OS thickness map. The ORC corresponds to the basal interface of the RPE, therefore slightly larger separations can be observed and the map has a more yellow hue (Fig 2b). In the normal eye the RC and RPE run very close to each other. The black color on the RPE topography indicates close to zero separation in the entire macular area (Fig. 2b.). Small regular elevations often visible in the periphery of these maps are artifacts related to image processing. Similarly, the presence of black stripes visible in the IS/OS topography is caused by imperfections in calculating the Outer Retinal Contour. We assumed that the retinal shape can be approximated by a smooth curve, which can be fitted by a polynomial function.
Fig. 3.

Three-dimensional data acquired in a healthy eye. Left panel: macula (View 1), right panel: optic disk (View 2).
However, in some cases the fit is not perfect causing small distance variation in topographic maps. There is also noticeable presence of black dots on the RPE-IS/OS thickness map caused by irregularities of the RPE/choriocapillaris junction. These effects should be taken into consideration in further analysis. As it is expected, the reflectivity maps show almost homogenous intensity distribution in both RDZs (Fig. 2c.). In this case small variation of reflectivity can be caused by limited depth of focus of the OCT system.
3.2 Case 1. Soft drusen
Soft drusen are localized detachments of the RPE caused by accumulation of proteinaceous material within the Bruch's membrane (basal linear deposits) or between the plasma membrane and basement membrane of the RPE (basal laminar deposits). Figure 4 shows an example of OCT imaging and analysis of soft drusen in the left eye of a 76 year-old patient. The visual acuity was 20/20. The patient was clinically diagnosed with a dry form of age-related macular degeneration (AMD). Fluorescence angiography revealed numerous soft drusen localized in the macular region. The patient had been followed up for 30 months with no changes in visual acuity. Fluorescence angiography taken 10 and 30 months after the baseline examination does not show any significant changes in the size of drusen. OCT imaging was performed five times during the 30 months period.
Fig. 4.

Comparison of retinal topography mapping with reflectivity mapping in non-exudative age related macular degeneration. Soft drusen in 76 year-old patient are visualized in the cross-sectional image and five SOCT maps. Full three-dimensional dataset is accessible via OSA ISP (View 3).
In order to test the ability of tracking subtle changes in the drusen progression we demonstrate two sets of 3-D data collected in December 2005 and July 2008. These data were acquired with identical raster scanning protocol consisting of 400 horizontal and 200 vertical scans, covering 6×6mm area of the macula (Fig. 4). The measurement shown in Fig. 5 was taken 30 months after the one presented in Fig. 4. In both cases SOCT images show regular elevations of RPE with no fluid accumulation beneath the sensory retina. The RPE topography displays zones of increased distance between ORC and RPE due to sub-RPE deposits. Areas where the ORC and RPE overlay each other are coded in black. The RPE-IS/OS thickness map reveals elevations of the IS/OS junction present in close proximity to drusen. These areas have concave contours and are most likely caused by drusen elevating the neurosensory retina in their neighborhood. The IS/OS topography is a combination of the two previous maps. This contour map helps to localize the RPE elevations with respect to areas of increased distance between RPE and IS/OS. Patterns visible in RPE topography and IS/OS topography show small changes in the shape of drusen and their height indicating slow progression of the drusen build up after 30 months. Similar observation can be performed by examining the reflectivity maps corresponding to the RPE layer (RDZ-I in Fig. 5). Drusen are visible here as dark fields. In contrast, the RDZ-II reflectivity map shows drusen as a bright pattern of regularly shaped patches. Such appearance can be easily explained. The material accumulated inside the drusen causes elevation of the highly reflective RPE, which translocates from RDZ-I to RDZ-II.
Fig. 5.

Results of a follow up (30 months) imaging of the 76 year-old patient with soft drusen. Drusen growth can be assessed by comparison of OCT maps with the corresponding maps in Fig. 4. Full three-dimensional dataset is accessible via OSA ISP (View 4).
This generates bright spots in RDZ-II and corresponding dark patches in RDZ-I. The pattern of dark areas in the RDZ-I matches exactly the pattern of bright regions in the RDZ-II. This indicates that no atrophy is present in the elevated RPE.
The thickness maps as well as the reflectivity maps show progression in drusen growth. The former can measure the progress quantitatively, while the later can give only qualitative information. However, the reflectivity maps provide information about the condition of RPE in the sense that they can visualize pigmentary changes in this layer.
3.3 Case 2. Confluent drusen
Figure 6 shows three-dimensional data and their analysis in the case of soft confluent drusen in AMD. 61-years-old patient with choroidal neovascularization in the right eye complained of decrease in contrast sensitivity with 20/20 visual acuity in the left eye. Fluorescence angiography revealed soft confluent drusen clustering around the fovea. SOCT showed regular elevations of RPE without fluid under the sensory retina. The RPE topography shows regular, oval elevations corresponding to confluent drusen surrounding the fovea. The contours of drusen are also clearly visible in the reflectivity maps.
Fig. 6.

Comparison of retinal topography mapping with reflectivity mapping: confluent drusen, 61 year-old patient. Full three-dimensional dataset is accessible via OSA ISP (View 5).
One year later, visual acuity remained unchanged but fluorescence angiography demonstrated an increase in drusen size. SOCT confirmed the diagnosis of soft drusen with no sign of choroidal neovascularization (Fig 7). The process of drusen growth is clearly visible in both RPE topography and IS/OS topography, as well as in both reflectivity maps. In addition, the reflectivity maps do not indicate any pigmentary changes in the RPE. The drusen grew approximately 30μm in axial dimension and could be measured in both RPE topography and IS/OS topography. High contrast in both the RPE topography and in the RDZ-I reflectivity map enables to compare accuracies of lesion reconstructions. In both maps the shapes of drusen edges are very similar. This indicates that both methods should have approximately the same accuracy in delineation of soft drusen.
Fig. 7.

Results of a follow up (12 months) imaging of the 61 year-old patient with confluent drusen. Full three-dimensional dataset is accessible via OSA ISP (View 6).
3.4 Case 3. Choroidal neovascularization (CNV)
An otherwise healthy 66-year-old woman was diagnosed with choroidal neovascularization associated with age-related macular degeneration in the right eye. Two weeks later, the patient complained of metamorphopsia and decreased visual acuity to 20/30. Fluorescence angiography revealed stippled hyperfluorescence at 1 minute with persistence of staining in the lower part of the macula indicating the presence of occult CNV. Fluorescence angiography also demonstrated soft drusen located in close proximity to the fovea. SOCT imaging demonstrated irregular elevation of RPE with accompanying fluid underneath the sensory retina (Fig. 8). The RPE elevations, visible in the RPE topography, localized inferiorly to the fovea, spread in all directions. High oval elevations visible in the same map correspond to soft drusen. The RPE-IS/OS thickness map shows areas of significant distance increase between the RPE and the IS/OS junction due to fluid accumulation under the sensory retina. An apparent thinning (arrows in Fig. 8) in the area located inferiorly to the fovea, visible in the RPE-IS/OS thickness map, is an artifact related to decreased reflectivity of the IS/OS junction above the RPE elevation. This observation is confirmed in the RDZ-II reflectivity map, where reflective structures elevated above the IS/OS junction are visible in the central part of the map.
Fig. 8.

Comparison of retinal topography mapping with reflectivity mapping: choroidal neovascularisation in age related macular degeneration, 66 year-old patient. Full three-dimensional dataset is accessible via OSA ISP (View 7).
The patient underwent photodynamic therapy 7 times over the next 22 months and her symptoms remained stable. Her best corrected visual acuity improved to 20/25. However, fluorescence angiography showed slight leakage and SOCT imaging revealed a small amount of fluid under the sensory retina. Additionally, a large hyperreflective irregular lesion consisting of RPE detached from the Bruch's membrane is visible. The significant RPE atrophy is indicated by increased penetration of light into the choroid. (Fig. 9). The RPE topography and RDZ-I reflectivity map, both indicate the area of elevated RPE. Regular oval shapes, present in the previous examination in reflectivity and contour maps, are no longer visible. The IS/OS topography and RPE topography again indicate the region of elevated neurosensory retina. The RPE - IS/OS thickness map shows strong irregularities in the thickened central area of the lesion representing the residual amount of fluid beneath the sensory retina. The reflectivity maps also show the presence of elevated lesion in the outer retina; however they do not fully reflect the aggravation of the disease. Late stages of retinal diseases involve severe changes in many retinal layers. These are changes in topography as well as in optical properties of ocular tissues. Significant disturbances in the layered structure of the retina and complicated alterations in the reflectivity of retinal layers provide very challenging problems for image processing methods. In this case reflectivity maps did not provide essential information about the disease progression. However, the contour maps enabled assessment of the abnormal tissue development.
Fig. 9.

Results of a follow up (22 months) imaging of the 66 year-old patient with choroidal neovascularisation in age related macular degeneration. Full three-dimensional dataset is accessible via OSA ISP (View 8).
3.5 Case 4. Elevations of neurosensory retina in chronic central serous chorioretinopathy (CSC)
A case of the neurosensory retinal detachment in central serous chorioretinopathy (CSCR) is demonstrated in Fig. 10. A 43-year-old man was presented with CSCR with decreased visual acuity in the left eye sustaining over 3 years. Fundus autofluorescence image demonstrated a large area of RPE damage due to chronic subretinal fluid accumulation. SOCT imaging revealed shallow elevation of RPE, as well as secondary degenerative changes in RPE.
Fig. 10.

Comparison of retinal topography mapping with reflectivity mapping: elevations of neurosensory retina in the chronic central serous chorioretinopathy, 43 year-old patient. Full three-dimensional dataset is accessible via OSA ISP (View 9).
Contour maps revealed a small deposit in RPE, which creates a small oval hill on the RPE topography. The same structure is also well visible in IS/OS topography and RDZ-II reflectivity map. Dramatic loss of reflectivity in the IS/OS junction within elevated areas of the retina generates an artificial depression in RPE - IS/OS thickness map and IS/OS topography. In such circumstances, the segmentation algorithm selects the brightest layer above the posterior boundary of RPE, which in this case is the anterior boundary of RPE. As a result, the blue area corresponds to the RPE layer thickness. This area visible in the RPE-IS/OS thickness map indicates indirectly the region of the retinal elevation. This case demonstrates that under specific conditions, quantification loss of the method presented, in the meaning of thickness or topography analysis, is quite possible. However, these unwanted effects can be used to estimate the lateral spread of elevated retina. RDZ-I reflectivity map shows almost homogenous distribution of back-reflected light. Only small black dots indicate the presence of pathological changes in RPE. The biggest irregular one corresponds to the deposit whereas multiple small dots correspond to very focal hyperreflective spots in RDZ-II and may indicate the presence of small highly reflective or non-transparent deposits or pigment clumping. These findings are not revealed in the contour maps. The RDZ-II reflectivity map visualizes only partially the region of detachment.
The black field corresponds only to that part of the detached tissue, which was elevated higher than the outer plexiform layer level. Therefore, it does not allow to determinate exactly the region of detached retina. In contrast, the RPE-IS/OS thickness map and IS/OS topography both provide information about the border of the detached retina, which correlates well with the autofluorescence image.
3.6 Case 5. Rhegmatogenous retinal detachment
A 17-year-old patient complained of veil obstructing naso-inferior portion of the visual field in the left eye. Her visual acuity was 20/200. The patient was diagnosed with retinal detachment. A red free fundus photograph and direct ophthalmoscopic fundus examination showed an elevation of peripheral retina, which also involved the temporal part of the fovea. SOCT cross-sectional images of the macula enabled precise assessment of the magnitude of detachment (Fig. 11). The imaging revealed small cystic changes in inner retina and disorganization of photoreceptors. It is not clear whether the brighter part of RPE in the central fovea corresponds to secondary degenerative changes or is only caused by decreased scattering. The same effect is visible in the RDZ-I reflectivity map as an irregular bright patch in the central part of the map. This effect is also visible in contour maps as the artificial depression (blue region) indicating strong decrease of the reflectivity of detached IS/OS in the foveal region.
Fig. 11.
Comparison of retinal topography mapping with reflectivity mapping: elevations of neurosensory retina in retinal detachment, 17 year-old patient. Full three-dimensional dataset is accessible via OSA ISP (View 10).
Both IS/OS topography and RPE-IS/OS thickness map clearly pinpoint the region of detachment and allow to determine magnitude and area.
4. Conclusions
We have evaluated applicability of two image processing methods for 3-D OCT data visualization and analysis. We have also compared the quantitative retinal topography mapping with the reflectivity mapping applied to several retinal diseases including age related macular degeneration and neurosensory retina detachment tracked in long term studies. OCT images have been demonstrated and described in correlation with results of standard ophthalmic diagnostics: fundus photographs, fluorescein angiographs and autofluorescence images.
We have observed that different types of RPE elevations and neurosensory retina detachments produce specific patterns visible in the retinal topography and reflectivity maps. Comparison of our data with standard diagnostics shows that the ORC-RPE map provides adequate information about the distribution of the RPE detachments over the entire measured region. RPE-IS/OS thickness maps demonstrate the distance between RPE and IS/OS junction and can indicate even small deviations from the normal shape of those layers. These maps reveal elevation of the IS/OS junction caused by a small amount of both subretinal fluid and drusen. All elevations of the IS/OS junction with the reference to ORC can be observed in IS/OS topography. This map enables evaluation of RPE elevations with respect to areas of the neurosensory retina detachment and therefore serves as a consistency test between the RPE topography and IS/OS-RPE thickness map.
The topography and thickness maps can measure the sizes and volumes of outer retinal elevations and quantitatively assess their changes between consecutive examinations. However, the material under the elevation is not always visible in these maps. Therefore, additional information is needed to unequivocally estimate the origin of the elevations. This information can be obtained either form cross-sectional images or from reflectivity maps. The RPE detachments due to drusen are visible as dark areas in the RDZ-I with corresponding bright regions in the RDZ-II. The neurosensory retina detachments, resulting from accumulation of highly transparent fluid, are projected in the RDZ-I as areas of slightly decreased brightness. However, the strong signal from intact RPE still dominates in this depth zone. RDZ-II visualizes this type of detachment as a hyporeflective region. The advantage of the reflectivity maps is also in their capability of visualizing changes in light scattering within selected retinal layers. For example, they can reveal pigmentary changes in the RPE and therefore may provide information important in estimating the development of pathologies such as AMD.
The main advantage of thickness and topography maps is the possibility of quantitative analysis of the pathology and its development. However, the quantitative retinal mapping has also some limitations. Contour maps ca be generated only if the OCT signal is strong enough to segment out the RPE and IS/OS junction. The analysis of early pathological changes can be influenced by an inappropriate delineation of retinal layers precluding correct interpretation of thickness maps. One of the sources of these artifacts is the decrease of the IS/OS reflectivity within elevated retina in the areas of the neurosensory retinal detachment. As a result, the line erroneously recognized by the algorithm as IS/OS junction is located at the level of RPE. We observe artifacts of this type in eyes with central serous chorioretinopathy (CSCR). In such cases the IS/OS-RPE and IS/OS topography show the localization and shape of the sensory retina detachment. However, due to the incorrect detection of IS/OS junction, the elevated region of the detachment is visible as a depression. We believe artifacts of this type can be used as a useful tool for detection of pathological changes caused by CSCR or other retinal detachments. Other types of artifacts can be related to misalignment between ORC and RPE visible in the form of small, regular elevations in the RPE topography and also affecting the IS/OS topography.
More advanced signal analysis or more sophisticated SOCT techniques, like polarization sensitive detection [31-35] or flow measurements [36], would probably help to differentiate morphological components in a more detailed way. Potentially, this could lead to definition of more specific markers of the disease progression. Unfortunately, these methods are much more time consuming and more challenging to implement than the time-effective segmentation procedure demonstrated in this paper.
In the presented results we show that reflectivity maps and topography maps can provide unique and complementary information about the condition of retina. Combined information revealed by both data processing methods may be helpful in correct assessment of the disease. Moreover, both ways of displaying the three-dimensional data can serve as a convenient and time-effective method of reading large OCT datasets and evaluating disease progression or results of treatment in clinical practice. The topography maps can measure this progress quantitatively, while reflectivity maps give qualitative information about light scattering changes within specific retinal layers. Analysis of both types of maps, in correlation with OCT cross-sectional images and results of standard ophthalmic testing, provides additional knowledge which may be used in comprehensive assessment of retinal pathologies, their development and pathogenesis.
Three-dimensional OCT datasets presented in this study can be used in the future for further development of OCT processing tools. Particularly, multiple measurements of the same disease in long term can be helpful in evaluation of new algorithms and data visualization methods.
Acknowledgments
This work was supported by EURYI grant/award funded by the European Heads of Research Councils (EuroHORCs) and the European Science Foundation (ESF) and Polish Ministry of Science and Higher Education, grants for 2006 to 2008. Maciej Wojtkowski acknowledges additional support from the Foundation for Polish Science (Homing project and EURYI) and Rector of NCU for the scientific grant 504-F. Maciej Szkulmowski acknowledges support from the Polish Ministry of Science, grants for 2005 to 2008. J.G. Fujimoto receives royalties from intellectual property licensed from M.I.T. to Carl Zeiss Meditec.
Footnotes
OCIS codes: (170.4500) Optical coherence tomography; (170.1650) Coherence imaging; (170.4470) Ophthalmology; (170.1610) Clinical applications; (100.2000) Digital image processing
Datasets associated with this manuscript are available athttp://hdl.handle.net/10376/1219.
References and links
- 1.Huang D, Swanson EA, Lin CP, Schuman JS, Stinson WG, Chang W, Hee MR, Flotte T, Gregory K, Puliafito CA, Fujimoto JG. Optical coherence tomography. Science. 1991;254:1178–1181. doi: 10.1126/science.1957169. [DOI] [PMC free article] [PubMed] [Google Scholar]
- 2.Wojtkowski M, Leitgeb R, Kowalczyk A, Bajraszewski T, Fercher AF. In vivo human retinal imaging by Fourier domain optical coherence tomography. J Biomed Opt. 2002;7:457–463. doi: 10.1117/1.1482379. [DOI] [PubMed] [Google Scholar]
- 3.Wojtkowski M, Srinivasan VJ, Ko TH, Fujimoto JG, Kowalczyk A, Duker JS. Ultrahigh-resolution high-speed Fourier domain optical coherence tomography and methods for dispersion compensation. Opt Express. 2004;12:2404–2422. doi: 10.1364/opex.12.002404. [DOI] [PubMed] [Google Scholar]
- 4.Srinivasan VJ, Wojtkowski M, Witkin AJ, Duker JS, Ko TH, Carvalho M, Schuman JS, Kowalczyk A, Fujimoto JG. High-definition and 3-dimensional imaging of macular pathologies with high-speed ultrahigh-resolution optical coherence tomography. Ophthalmology. 2006;113:2054–2065. doi: 10.1016/j.ophtha.2006.05.046. [DOI] [PMC free article] [PubMed] [Google Scholar]
- 5.Wojtkowski M, Srinivasan V, Fujimoto JG, Ko T, Schuman JS, Kowalczyk A, Duker JS. Three-dimensional retinal imaging with high-speed ultrahigh-resolution optical coherence tomography. Ophthalmology. 2005;112:1734–1746. doi: 10.1016/j.ophtha.2005.05.023. [DOI] [PMC free article] [PubMed] [Google Scholar]
- 6.Jiao SL, Knighton R, Huang XR, Gregori G, Puliafito CA. Simultaneous acquisition of sectional and fundus ophthalmic images with spectral-domain optical coherence tomography. Opt Express. 2005;13:444–452. doi: 10.1364/opex.13.000444. [DOI] [PubMed] [Google Scholar]
- 7.Leitgeb RA, Drexler W, Unterhuber A, Hermann B, Bajraszewski T, Le T, Stingl A, Fercher AF. Ultrahigh resolution Fourier domain optical coherence tomography. Opt Express. 2004;12:2156–2165. doi: 10.1364/opex.12.002156. [DOI] [PubMed] [Google Scholar]
- 8.Cense B, Nassif NA, Chen TC, Pierce MC, Yun SH, Park BH, Bouma BE, Tearney GJ, de Boer JF. Ultrahigh-resolution high-speed retinal imaging using spectral-domain optical coherence tomography. Opt Express. 2004;12:2435–2447. doi: 10.1364/opex.12.002435. [DOI] [PubMed] [Google Scholar]
- 9.Ko TH, Fujimoto JG, Schuman JS, Paunescu LA, Kowalevicz AM, Hartl I, Drexler W, Wollstein G, Ishikawa H, Duker JS. Comparison of ultrahigh- and standard-resolution optical coherence tomography for imaging macular pathology. Ophthalmology. 2005;112:1922. doi: 10.1016/j.ophtha.2005.05.027. [DOI] [PMC free article] [PubMed] [Google Scholar]
- 10.Chan A, Duker JS, Schuman JS, Fujimoto JG. Stage 0 macular holes—Observations by optical coherence tomography. Ophthalmology. 2004;111:2027–2032. doi: 10.1016/j.ophtha.2004.05.034. [DOI] [PMC free article] [PubMed] [Google Scholar]
- 11.Ko TH, Fujimoto JG, Duker JS, Paunescu LA, Drexler W, Baumal CR, Puliafito CA, Reichel E, Rogers AH, Schuman JS. Comparison of ultrahigh- and standard-resolution optical coherence tomography for imaging macular hole pathology and repair. Ophthalmology. 2004;111:2033–2043. doi: 10.1016/j.ophtha.2004.05.021. [DOI] [PMC free article] [PubMed] [Google Scholar]
- 12.Wirtitsch MG, Ergun E, Hermann B, Unterhuber A, Stur M, Scholda C, Sattmann H, Ko TH, Fujimoto JG, Drexler W. Ultrahigh resolution optical coherence tomography in macular dystrophy. Am J Ophthalmol. 2005;140:976–983. doi: 10.1016/j.ajo.2005.06.029. [DOI] [PubMed] [Google Scholar]
- 13.Schmidt-Erfurth UM, Pruente C. Management of neovascular age-related macular degeneration. Prog Retin Eye Res. 2007;26:437–451. doi: 10.1016/j.preteyeres.2007.03.002. [DOI] [PubMed] [Google Scholar]
- 14.Ahlers C, Geitzenauer W, Simader C, Stock G, Golbaz I, Polak K, Georgopoulo M, Schmidt-Erfurth U. New perspectives in diagnostics. High-resolution optical coherence tomography for age-related macular degeneration. Ophthalmologe. 2008;105:248–254. doi: 10.1007/s00347-007-1597-7. [DOI] [PubMed] [Google Scholar]
- 15.Scholda C, Wirtitsch M, Hermann B, Unterhuber A, Ergun E, Sattmann H, Ko TH, Fujimoto JG, Fercher AF, Stur M, Schmidt-Erfurth U, Drexler W. Ultrahigh resolution optical coherence tomography of macular holes. Retina. 2006;26:1034–1041. doi: 10.1097/01.iae.0000254898.80552.e7. [DOI] [PubMed] [Google Scholar]
- 16.Anger EM, Unterhuber A, Hermann B, Sattmann H, Schubert C, Morgan JE, Cowey A, Ahnelt PK, Drexler W. Ultrahigh resolution optical coherence tomography of the monkey fovea. Identification of retinal sublayers by correlation with semithin histology sections. Exp Eye Res. 2004;78:1117–1125. doi: 10.1016/j.exer.2004.01.011. [DOI] [PubMed] [Google Scholar]
- 17.Drexler W, Sattmann H, Hermann B, Ko TH, Stur M, Unterhuber A, Scholda C, Findl O, Wirtitsch M, Fujimoto JG, Fercher AF. Enhanced visualization of macular pathology with the use of ultrahigh-resolution optical coherence tomography. Arch Ophthalmol. 2003;121:695–706. doi: 10.1001/archopht.121.5.695. [DOI] [PubMed] [Google Scholar]
- 18.Srinivasan VJ, Monson BK, Wojtkowski M, Bilonick RA, Gorczynska I, Chen R, Duker JS, Schuman JS, Fujimoto JG. Characterization of outer retinal morphology with high-speed, ultrahigh-resolution optical coherence tomography. Invest Ophthalmol Vis Sci. 2008;49:1571–1579. doi: 10.1167/iovs.07-0838. [DOI] [PMC free article] [PubMed] [Google Scholar]
- 19.Szkulmowski M, Wojtkowski M, Sikorski B, Bajraszewski T, Srinivasan VJ, Szkulmowska A, Kaluzny JJ, Fujimoto JG, Kowalczyk A. Analysis of posterior retinal layers in spectral optical coherence tomography images of the normal retina and retinal pathologies. J Biomed Opt. 2007;12:041207. doi: 10.1117/1.2771569. [DOI] [PubMed] [Google Scholar]
- 20.Podoleanu AG, Seeger M, Dobre GM, Webb DJ, Jackson DA, Fitzke FW. Transversal and longitudinal images from the retina of the living eye using low coherence reflectometry. J Biomed Opt. 1998;3:12–20. doi: 10.1117/1.429859. [DOI] [PubMed] [Google Scholar]
- 21.Podoleanu AG, Rogers JA, Jackson DA, Dunne S. Three dimensional OCT images from retina and skin. Opt Express. 2000;7:292–298. doi: 10.1364/oe.7.000292. [DOI] [PubMed] [Google Scholar]
- 22.Hitzenberger CK, Trost P, Lo PW, Zhou QY. Three-dimensional imaging of the human retina by high-speed optical coherence tomography. Opt Express. 2003;11:2753–2761. doi: 10.1364/oe.11.002753. [DOI] [PubMed] [Google Scholar]
- 23.Podoleanu AG, Jackson DA. Combined optical coherence tomograph and scanning laser ophthalmoscope. Electron Lett. 1998;34:1088–1090. [Google Scholar]
- 24.Pircher M, Gotzinger E, Hitzenberger CK. Dynamic focus in optical coherence tomography for retinal imaging. J Biomed Opt. 2006;11:054013. doi: 10.1117/1.2358960. [DOI] [PubMed] [Google Scholar]
- 25.Podoleanu AG, Dobre GM, Cucu RG, Rosen R, Garcia P, Nieto J, Will D, Gentile R, Muldoon T, Walsh J, Yannuzzi LA, Fisher Y, Orlock D, Weitz R, Rogers JA, Dunne S, Boxer A. Combined multiplanar optical coherence tomography and confocal scanning ophthalmoscopy. J Biomed Opt. 2004;9:86–93. doi: 10.1117/1.1627778. [DOI] [PubMed] [Google Scholar]
- 26.Gorczynska I, Srinivasan VJ, Vuong LN, Chen RW, Liu JJ, Reichel E, Wojtkowski M, Schuman JS, Duker JS, Fujimoto JG. Projection OCT fundus imaging for visualizing outer retinal pathology in non-exudative age related macular degeneration. Br J Ophthalmol. doi: 10.1136/bjo.2007.136101. accepted 2008, electronic version available. [DOI] [PMC free article] [PubMed] [Google Scholar]
- 27.Sikorski BL, Wojtkowski M, Kaluzny JJ, Szkulmowski M, Kowalczyk A. Correlation of spectral optical coherence tomography with fluorescein and indocyanine green angiography in multiple evanescent white dot syndrome. Br J Ophthalmol. 2008;92:1552–1557. doi: 10.1136/bjo.2007.135863. [DOI] [PubMed] [Google Scholar]
- 28.Kaluzny JJ, Wojtkowski M, Sikorski BL, Szkulmowski M, Szkulmowska A, Bajraszewski T, Fujimoto JG, Duker JS, Schuman JS, Kowalczyk A. Analysis of the outer retina reconstructed by high-resolution, three-dimensional spectral domain optical coherence tomography. Ophthalmic Surg Lasers Imaging. 2008;39:S30–S36. doi: 10.3928/15428877-20090301-10. [DOI] [PMC free article] [PubMed] [Google Scholar]
- 29.Russ JC. The Image Processing Handbook. CRC Press; 2002. [Google Scholar]
- 30.Weeks AR. The Fundamentals of Electronic Image Processing. SPIE Press & IEEE Press; 1996. [Google Scholar]
- 31.Pircher M, Zawadzki RJ, Evans JW, Werner JS, Hitzenberger CK. Simultaneous imaging of human cone mosaic with adaptive optics enhanced scanning laser ophthalmoscopy and high-speed transversal scanning optical coherence tomography. Opt Lett. 2008;33:22–24. doi: 10.1364/ol.33.000022. [DOI] [PMC free article] [PubMed] [Google Scholar]
- 32.Michels S, Pircher M, Geitzenauer W, Simader C, Gotzinger E, Findl O, Schmidt-Erfurth U, Hitzenberger CK. Value of polarisation-sensitive optical coherence tomography in diseases affecting the retinal pigment epithelium. Br J Ophthalmol. 2008;92:204–209. doi: 10.1136/bjo.2007.130047. [DOI] [PubMed] [Google Scholar]
- 33.Yasuno Y, Makita S, Sutoh Y, Itoh M, Yatagai T. Birefringence imaging of human skin by polarization-sensitive spectral interferometric optical coherence tomography. Opt Lett. 2002;27:1803–1805. doi: 10.1364/ol.27.001803. [DOI] [PubMed] [Google Scholar]
- 34.Yasuno Y, Makita S, Endo T, Itoh M, Yatagai T, Takahashi M, Katada C, Mutoh M. Polarization-sensitive complex Fourier domain optical coherence tomography for Jones matrix imaging of biological samples. Appl Phys Lett. 2004;85:3023–3025. [Google Scholar]
- 35.Pierce MC, Strasswimmer J, Park BH, Cense B, de Boer JF. Birefringence measurements in human skin using polarization-sensitive optical coherence tomography. J Biomed Opt. 2004;9:287–291. doi: 10.1117/1.1645797. [DOI] [PubMed] [Google Scholar]
- 36.Leitgeb RA, Schmetterer L, Drexler W, Fercher AF, Zawadzki RJ, Bajraszewski T. Real-time assessment of retinal blood flow with ultrafast acquisition by color Doppler Fourier domain optical coherence tomography. Opt Express. 2003;11:3116–3121. doi: 10.1364/oe.11.003116. [DOI] [PubMed] [Google Scholar]