

Abstract
We demonstrate en face swept source optical coherence tomography (ss-OCT) without requiring a Fourier transformation step. The electronic optical coherence tomography (OCT) interference signal from a k-space linear Fourier domain mode-locked laser is mixed with an adjustable local oscillator, yielding the analytic reflectance signal from one image depth for each frequency sweep of the laser. Furthermore, a method for arbitrarily shaping the spectral intensity profile of the laser is presented, without requiring the step of numerical apodization. In combination, these two techniques enable sampling of the in-phase and quadrature signal with a slow analog-to-digital converter and allow for real-time display of en face projections even for highest axial scan rates. Image data generated with this technique is compared to en face images extracted from a three-dimensional OCT data set. This technique can allow for real-time visualization of arbitrarily oriented en face planes for the purpose of alignment, registration, or operator-guided survey scans while simultaneously maintaining the full capability of high-speed volumetric ss-OCT functionality.
Optical coherence tomography (OCT) is a powerful biomedical imaging technique for in vivo imaging of tissue microstructure [1]. OCT can have better rejection of out-of-focus light than confocal laser microscopy [2]. In standard OCT depth priority scanning is performed, resulting in the standard, cross-sectional OCT images. In optical coherence microscopy (OCM), the scattering intensity of the sample is measured only at one depth and the image is formed by transversal scanning on the sample (en face imaging) [2], often with high transversal resolution [3,4]. Conventional OCM setups use the time domain (TD) detection technique [1]. The optical path length of the reference arm of the imaging interferometer is periodically modulated to introduce a phase shift and to generate a beat signal between light from the reference arm and backscattered light from the sample.
Recently the introduction of Fourier domain (FD) detection techniques [5,6] for OCT enabled a dramatic increase in imaging speed while maintaining high sensitivity [7–9]. Large densely sampled three-dimensional (3D) OCT data sets can now be acquired in less than 1 s using high-speed wavelength-swept lasers [10–12]. En face projections of the imaged tissue can then be extracted from the 3D data set [13]. In many cases this concept can provide enhanced visualization and additional information on tissue microstructure [14,15] or it can be used for absolute position registration of the individual cross-sectional OCT scans [13].
One drawback of the numerical reconstruction of en face views in FD-OCT is that a complete 3D data set has to be acquired prior to the extraction of the en face image. Current FD-OCT systems using Fourier domain mode-locked (FDML) [11] swept laser sources [swept source OCT (ss-OCT)] achieve rates of several hundred thousand depth scans per second [12], resulting in sustained data rates of ∼1 Gbyte/s. Since complex real-time data processing at these speeds is not presently cost effective, en face projections have been generated in software by postprocessing the acquired 3D data and not in real time. Numerical postprocessing typically involves the steps of data resampling, numerical spectral shaping and apodizing, Fourier transformation, and summation over parts of the individual depth scans (A line). In this Letter we demonstrate a method for en face FD-OCT imaging without any of these steps, making real-time display of en face OCT images in fast ss-OCT possible. It should be noted that in the limit of one sample point per A scan, ss-OCT exhibits no sensitivity advantage over OCM. However, in cases where more than one resolution element per A scan is acquired for an individual pixel in the en face projection (e.g., for speckle reduction), the ss-OCM approach exhibits increased sensitivity. Furthermore, the presented approach opens the possibility of a combined real time OCT and OCM system for improved alignment, registration, stabilization, quick survey scanning, and online extraction of arbitrarily shaped surfaces while maintaining full 3D functionality.
The approach for fast hardware en face ss-OCT is based on the highly linear optical frequency versus time sweep characteristic, demonstrated with FDML lasers [16]. Figure 1(a) shows the setup of the laser. The ring cavity is all fiber-based and has a total optical path length of 7.2 km. A semiconductor optical amplifier (SOA) is used as a broadband gain medium, a fiber-based tunable Fabry–Perot filter (FFP-TF, Lambda Quest, LLC) acts as a spectral filter and is driven synchronously to the second harmonic of the optical cavity round-trip time with a frequency of 57 kHz to enable FDML operation [11]. The average power of the laser is 5 mW. A two-channel arbitrary waveform generator (AWG) provides the control signal for the FFP-TF and synchronously a control signal for the SOA driver to achieve arbitrary spectral shaping.
Fig. 1.
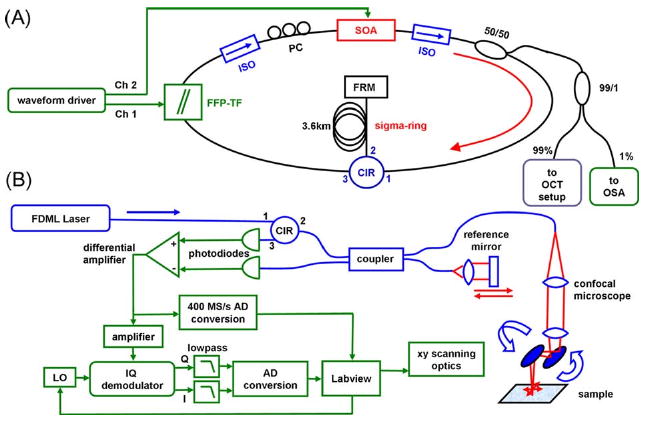
(Color online) (A) Setup of the FDML laser. (B) ss-OCT/OCM setup.
Figure 1(b) shows a schematic of the hardware en face FD-OCT–OCM setup. The approach is to extract the amplitude of a single frequency band from the OCT fringe signal by mixing the OCT signal with a reference frequency from a local oscillator (LO). For improved performance and to suppress the influence of phase variations, an in-phase-and-quadrature (I and Q) demodulator is used (Minicircuits MIQC-60WD+) as in heterodyne swept source OCT [17]. The in-phase (I) and quadrature (Q) outputs of the mixer are low-pass filtered with a bandwidth of 60 kHz selecting a 120 kHz wide frequency band from the fringe signal centered around the LO frequency νLO. Since 120 kHz corresponds to the effective sweep rate, the full optical bandwidth of the laser of ∼110 nm is taken into account. By tuning the LO, an adjustable depth z can be selected: , where is the sweep speed (optical frequency per time) and c is the speed of light. An en face image is recorded by xy scanning over the sample and recording the spectral magnitude once per sweep. Acquisition of I and Q is performed synchronously to the FDML sweep rate at 57 kHz using a 16 bit analog-to-digital (AD) converter card. In addition to the real-time hardware en face imaging mode described, the system can be operated in the standard ss-OCT mode with a 400 Msamples/s 12 bit AD converter, and for comparison en face images can be extracted from 3D OCT data sets by postprocessing.
In the hardware en face ss-OCT implementation, numerical spectral shaping and apodizing to minimize sidelobes in the point-spread function (PSF) are not possible. Therefore, the SOA current of the laser source is modulated such that an arbitrary spectral shape can be generated, limited only by the gain bandwidth of the SOA and the modulation bandwidth of the driver. The modulation is performed by a homebuilt 6 MHz diode driver controlled by the second channel of the AWG [Fig. 1(a)]. Shaping by an additional, active element with linear response has been demonstrated in the kilohertz range [18]. However, due to the SOA's highly nonlinear amplification characteristic near saturation as well as transient thermal effects, no simple analytical approach can be used to determine the best control waveform. Therefore, a software regulator has been implemented that iteratively optimizes the drive waveform to generate the desired spectral output power characteristic of the laser. The system acquires an intensity trace covering the time span of approximately one full laser sweep cycle. At each sampling point the deviation from the normalized target spectrum is calculated as local error parameter, and a correction value to the diode current is calculated by simple multiplication with a proportional factor for each point. The calculated new drive current transient is uploaded to the AWG. After ∼20 iteration steps, each of which takes ∼0.5 s, the measured intensity matches the target spectrum. Once the optimum waveform is found it is stable and does not have to be changed. The result of this method is shown in Fig. 2(a), with the spectral output of the laser with a constant diode current (ns) and with a modulation optimized for a Welch-(w) and a Hanning-(h) shaped spectrum. The corresponding fringe signals are plotted in Fig. 2(c); the insets show the applied transient diode current. The PSFs at 0.75 mm depth were measured by sweeping the RF frequency of the LO [Fig. 2(b)]. The asymmetry of the PSFs is caused by imperfect linearization. The Hanning PSF exhibits significantly reduced sidelobes compared to the constant current PSF; however, the resolution degrades from 12.4 (ns) to 17.0 μm (h). The resolution values theoretically expected from the spectra are 10.6 (ns) and 16.6 μm (h). Depending on the application, with the demonstrated shaping method axial resolution and sidelobe suppression can be arbitrarily balanced in hardware. Besides the potential speed advantages of hardware shaping compared to spectral shaping in software, for applications with a limit of incident power on the sample, an optimized spectral shape leads to a more efficient use of light intensity and may reduce noise.
Fig. 2.
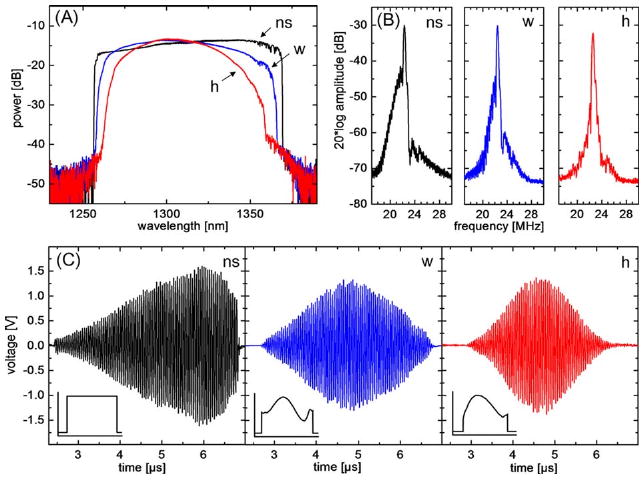
(Color online) (A) Spectral laser output, unshaped (ns), Welch shaped (w), and Hanning shaped (h). (B) Corresponding PSFs in OCT setup at 0.75 mm depth. (C) Corresponding fringe signals. Insets show applied current.
To characterize the performance of the setup for hardware en face ss-OCT imaging, Fig. 3 shows the PSF roll-off characteristic for a depth range of 2 mm. In the graph a constant is added such that the peak values represent the corresponding sensitivity. A maximum system sensitivity of 108 dB at 2.5 mW average power on the sample (101 dB with optical density 3.56 neutral density filter and 7 dB backcoupling losses in the microscope accounted for) and a maximum dynamic range of 63 dB have been measured. Roll-off, sensitivity and dynamic range are comparable to standard ss-OCT values.
Fig. 3.
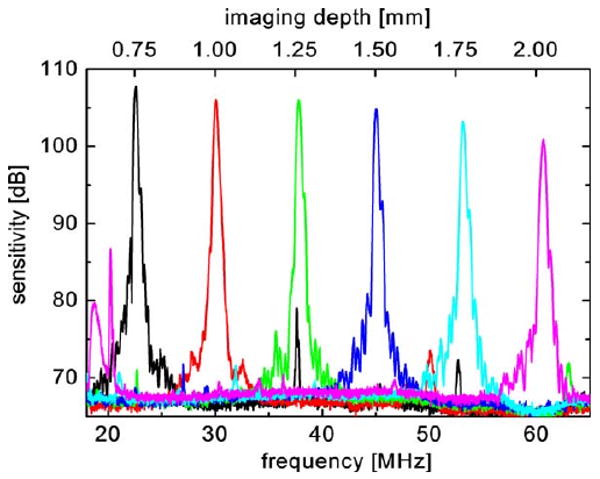
(Color online) Measured roll-off for a Hanning shaped spectrum in the frequency range of 20 to 60 MHz, corresponding to imaging depths of 0.75 to 2.00 mm (average over 100 measurements).
To investigate the imaging performance of the setup, Fig. 4 shows a comparison of two images of a grape, one generated by postprocessing of a 3D data set [Fig. 4(a)] and the other generated in real time with the hardware en face ss-OCT setup [Fig. 4(b)]. Both images consist of 512×512 pixels, the power on the sample was 2.5 mW, and the transverse spot size was ∼22 μm yielding a 480 μm confocal gate. The quality of both images is comparable, demonstrating the applicability of the hardware en face FD-OCT setup.
Fig. 4.
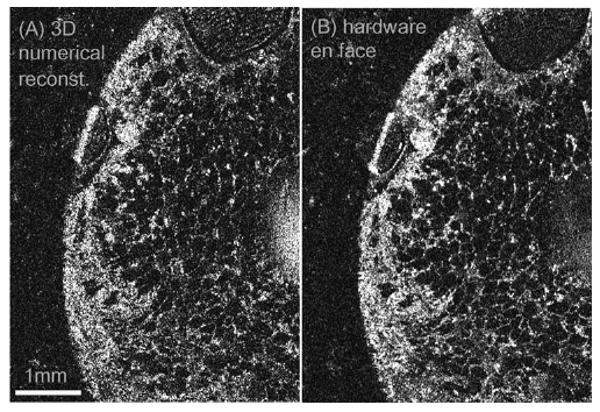
(A) En face image of a grape generated from a volumetric 3D data set. (B) En face image at the same position, generated with hardware demodulation.
In conclusion, we demonstrate a method for hardware en face ss-OCT without the steps of data resampling, Fourier transformation, and numerical spectral shaping. The system can provide real-time en face images even for very high A line rates. Simultaneously, standard ss-OCT data can be acquired. The system will be ideally suited for real-time alignment, absolute position registration, operator-guided survey scans, search for landmark positions on the sample, etc., in future high-speed ss-OCT systems. The possibility to arbitrarily choose and track the depth of the coherence gate by adjusting the frequency of the local oscillator synchronously to the scanning will enable real-time en face images with arbitrarily curved surfaces that can be applied to track certain layers in tissue.
Acknowledgments
We acknowledge support from W. Zinth at the Ludwig-Maximilians-Universität München. This research was sponsored by the Emmy Noether program of the German Research Foundation (DFG) (HU 1006/2-1), the European Union (EU) project FUN OCT (FP7 HEALTH, contract 201880), the National Institutes of Health (NIH) (R01-CA75289-09 and R01-EY11289-20), and the Air Force Office of Scientific Research FA9550-071-0014 and FA9550-07-1-0101.
References
- 1.Huang D, Swanson EA, Lin CP, Schuman JS, Stinson WG, Chang W, Hee MR, Flotte T, Gregory K, Puliafito CA, Fujimoto JG. Science. 1991;254:1178. doi: 10.1126/science.1957169. [DOI] [PMC free article] [PubMed] [Google Scholar]
- 2.Izatt JA, Hee MR, Owen GM, Swanson EA, Fujimoto JG. Opt Lett. 1994;19:590. doi: 10.1364/ol.19.000590. [DOI] [PubMed] [Google Scholar]
- 3.Beaurepaire E, Boccara AC, Lebec M, Blanchot L, Saint-Jalmes H. Opt Lett. 1998;23:244. doi: 10.1364/ol.23.000244. [DOI] [PubMed] [Google Scholar]
- 4.Pircher M, Baumann B, Gotzinger E, Hitzenberger CK. Opt Lett. 2006;31:1821. doi: 10.1364/ol.31.001821. [DOI] [PMC free article] [PubMed] [Google Scholar]
- 5.Fercher AF, Hitzenberger CK, Drexler W, Kamp G, Sattmann H. Am J Ophthalmol. 1993;116:113. doi: 10.1016/s0002-9394(14)71762-3. [DOI] [PubMed] [Google Scholar]
- 6.Häusler G, Lindner MW. J Biomed Opt. 1998;3:21. doi: 10.1117/1.429899. [DOI] [PubMed] [Google Scholar]
- 7.Leitgeb R, Hitzenberger CK, Fercher AF. Opt Express. 2003;11:889. doi: 10.1364/oe.11.000889. [DOI] [PubMed] [Google Scholar]
- 8.Choma MA, Sarunic MV, Yang CH, Izatt JA. Opt Express. 2003;11:2183. doi: 10.1364/oe.11.002183. [DOI] [PubMed] [Google Scholar]
- 9.de Boer JF, Cense B, Park BH, Pierce MC, Tearney GJ, Bouma BE. Opt Lett. 2003;28:2067. doi: 10.1364/ol.28.002067. [DOI] [PubMed] [Google Scholar]
- 10.Oh WY, Yun SH, Tearney GJ, Bouma BE. Opt Lett. 2005;30:3159. doi: 10.1364/ol.30.003159. [DOI] [PMC free article] [PubMed] [Google Scholar]
- 11.Huber R, Wojtkowski M, Fujimoto JG. Opt Express. 2006;14:3225. doi: 10.1364/oe.14.003225. [DOI] [PubMed] [Google Scholar]
- 12.Huber R, Adler DC, Fujimoto JG. Opt Lett. 2006;31:2975. doi: 10.1364/ol.31.002975. [DOI] [PubMed] [Google Scholar]
- 13.Jiao SL, Knighton R, Huang XR, Gregori G, Puliafito CA. Opt Express. 2005;13:444. doi: 10.1364/opex.13.000444. [DOI] [PubMed] [Google Scholar]
- 14.Huang SW, Aguirre AD, Huber RA, Adler DC, Fujimoto JG. Opt Express. 2007;15:6210. doi: 10.1364/oe.15.006210. [DOI] [PubMed] [Google Scholar]
- 15.Adler DC, Chen Y, Huber R, Schmitt J, Connolly J, Fujimoto JG. Nat Photonics. 2007;1:709. [Google Scholar]
- 16.Eigenwillig CM, Biedermann BR, Palte G, Huber R. Opt Express. 2008;16:8916. doi: 10.1364/oe.16.008916. [DOI] [PubMed] [Google Scholar]
- 17.Davis AM, Choma MA, Izatt JA. J Biomed Opt. 2005;10:1083. doi: 10.1117/1.2136147. [DOI] [PubMed] [Google Scholar]
- 18.Yun SH, Richardson DJ, Culverhouse DO, Kim BY. IEEE J Sel Top Quantum Electron. 1997;3:1087. [Google Scholar]