Abstract
Pompe disease (glycogen storage disease II) is caused by mutations in the acid α-glucosidase gene. The most common form is rapidly progressive with glycogen storage, particularly in muscle, that leads to profound weakness, cardiac failure, and death by the age of two years. Although usually considered a muscle disease, glycogen storage also occurs in the CNS. We evaluated the progression of neuropathological and behavioral abnormalities in a Pompe disease mouse model (6neo/6neo) that displays many features of the human disease. Homozygous mutant mice store excess glycogen within large neurons of hindbrain, spinal cord, and sensory ganglia by the age of one month; accumulations then spread progressively within many CNS cell types. “Silver degeneration” and Fluoro-Jade C stains revealed severe degeneration in axon terminals of primary sensory neurons at three to nine months. These abnormalities were accompanied by progressive behavioral impairment on rotorod, wire hanging and foot fault tests. The extensive neuropathological alterations in this model suggest that therapy of skeletal and cardiac muscle disorders by systemic enzyme replacement therapy may not be sufficient to reverse functional deficits due to CNS glycogen storage, particularly early-onset, rapidly progressive disease. A better understanding of the basis for clinical manifestations is needed to correlate CNS pathology with Pompe disease manifestations.
Keywords: Axon terminal degeneration, Genetic disease, Glycogen storage in CNS, Lysosomal storage diseases, Neurobiology
INTRODUCTION
In 1932 Joannes Cassianus Pompe described the clinical and pathological findings in a 7-month-old girl who died with an unusual disease (1) that has come to bear his name (2). More than two decades later, Pompe disease was named “glycogen storage disease type II” and classified by Cori as the most severe type of glycogen storage disease (3). In an insightful study almost a decade later (4), Hers inferred that it was a lysosomal storage disease, the first in what has become an extensive list of 40 to 50 lysosomal storage diseases (5).
Pompe disease was recognized in the early 1990s to be due to a defect in the acid α-glucosidase gene (GAA) (2, 6). Weakness of cardiac and skeletal muscles produces the main symptoms, and in the infantile onset disease, excessive glycogen storage can be seen in cardiac, skeletal, and smooth muscle and in renal tubular epithelium (7). Most infants with a rapidly progressive course of the disease have <1% or no GAA enzyme activity, develop severe skeletal muscle weakness and cardiac enlargement with heart failure, and succumb within the first or second postnatal year (8). Patients with less severe enzyme deficiencies generally develop symptoms later in life, with skeletal muscle weakness, especially of respiratory musculature, but not cardiac failure (9, 10). Pathological analyses have correspondingly focused on glycogen accumulation in skeletal muscle and heart, but several of the early (11–15) and more recent (16, 17) pathological accounts describe abnormalities also in the CNS and peripheral nervous system (PNS). The significance of nervous system involvement is, however, far from clear (18–20). With the great interest that has developed in recent years in the beneficial effects of enzyme replacement therapy (ERT) with recombinant human acid α-glucosidase (rhGAA) on cardiac function, respiration, and ambulation (21–23), renewed attention is pertinent on the question as to whether impaired neurological function will remain a significant long-term hurdle for rhGAA-treated patients.
Three mouse models of Pompe disease have been generated by targeted disruption of the GAA gene (24, 25). The first, published by Bijvoet and colleagues in the Reuser lab, was based on disruption of exon 13, with resultant absence of GAA enzyme activity (24). No behavioral abnormalities were observed in those mice until subtle motor abnormalities appeared in some mice at about 6 months of age and became more obvious when the mice reached one year of age (26). Glycogen storage was noted in many tissues, including neurons and non-neuronal cells of the CNS and PNS. Two additional mouse models were developed by Raben and colleagues (25). In one, exon 6 was disrupted by insertion of a neomycin-resistance (neo) gene and additional gene fragments into exon 6 (called the 6neo/6neo model). In the other model, exon 6 was deleted by Cre mediation with loxP sites inserted into introns 5 and 6 (called the Δ6/Δ6 model). Like the Bijvoet model, both models lacked GAA enzyme activity and accumulated glycogen progressively in lysosomes of skeletal and heart muscle and other tissues, but only the 6neo/6neo model mice showed reduced mobility and strength beginning at about 3.5 weeks of age with obvious muscle wasting and waddling gait by 8 to 9 months of age. The relative lack of behavioral defects in parallel with the severe biochemical and pathological abnormalities in some of these mouse disorders may result from genetic background differences among the models (25).
In the present study we characterized the temporal progression of neuropathologic and behavioral abnormalities in the 6neo/6neo mouse. This model is phenotypically and genotypically a good model of Pompe disease and apparently is the most suitable one for testing ERT and gene therapies.
MATERIALS AND METHODS
Animals
Mice of a 6neo/6neo breeding stock crossed onto a predominantly C57BL/6J genetic background were obtained at 1 to 12 months from the Genzyme colony at Charles River, and 15- and 22-month-old animals from the Genzyme facility in Oklahoma. Age-matched C57BL/6 wild-type control mice (Charles River Laboratories, Wilmington, MA) were used, except as otherwise noted in the behavior methods. Mice were housed in a standard animal room in an AAALAC-accredited facility with a 12:12 light/dark cycle and ad libitum access to Purina rodent chow 5001 and water. Animal experiments were conducted in accordance with the Guide for the Care and Use of Laboratory Animals (Department of Health and Human Services, NIH Publication 86–23).
Glycogen Assay
Mice (n = 5 per time point) were transcardially perfused with phosphate-buffered saline. Brain and spinal cord were dissected immediately after perfusion. Brains were sectioned into five coronal slabs of ~2 mm thickness. The spinal cord was processed as a whole. All tissue was then placed into cryo-vials (VWR International, Leicestershire, UK), snap-frozen in liquid nitrogen, and stored at −80° C. Frozen slabs were weighed and placed into 5-ml snap cap tubes (VWR), 10x volume dH2O was added by mass to each tube, and the tissue was homogenized (Ultra Turrax, IKA Werke, Wilmington, NC) for ~20 seconds until a smooth suspension was obtained. Suspensions were then sonicated (VirSonic 100, VirTis, Gardiner, NY) on wet ice for ~15 seconds, and transferred to 2.0 mL Eppendorf tubes (Eppendorf, Westbury, NY) and centrifuged (Microfuge 22R, Beckman Coulter, Fullerton, CA) at 14,000 RPM for 15 minutes at 4°C. Three 100 μL aliquots of supernatant were saved in Eppendorf tubes and stored at −80°C. Glycogen standards were prepared by diluting a 1250 μg/mL stock solution (glycogen from bovine liver [standard], Sigma) made in dH20 to: 1250 μg/mL, 625 μg/mL, 312.5 μg/mL, 156.25 μg/mL, 78.125 μg/mL, 39 μg/mL and 19.5 μg/mL. A dH20 blank was also prepared. All standards were stored at −20°C.
Supernatant samples were thawed on wet ice. Duplicate samples were prepared by aliquoting 12.5 μL of supernatant into two 2.0 mL Eppendorf tubes and adding 62.5 μL dH20 to each. All samples and standards were then boiled at 100°C for 3 minutes in a digital heat block (VWR) and allowed to cool on wet ice. To the standards and one set of samples 25 μL 1:20 amyloglucosidase (Sigma-Aldrich, St. Louis, MO) in a stock solution of 0.1M potassium acetate pH 5.5 (Sigma-Aldrich) was added. To the other set of samples 25 μL 0.1M potassium acetate pH 5.5 was added. All samples and standards were then incubated while shaking at 37°C for 2 hours (Lab-Line Environ Shaker, Barnstead International, Dubuque, IA), followed by boiling at 100°C for 3 minutes and centrifugation at 14,000 RPM for 5 minutes at room temperature (RT). All samples and standards were then stored at 4°C. Protein fluorescence assay was run with an Amplex Red Glucose/Glucose Oxidase Assay Kit (Invitrogen, Carlsbad, CA) on black 96-well plates (VWR). After incubation for 30 minutes in the dark following addition of fluorophore, samples were read on a M2 plate reader (Molecular Devices, Sunnyvale, CA) with excitation at 530 nm and fluorescence detection at 590 nm. All values were plated in duplicate, and the two values for each sample were averaged. Total tissue glycogen was calculated by subtracting the value of samples prepared without enzyme (background glucose) from that of samples prepared with enzyme (digested glycogen plus background glucose). Values were divided by a dilution conversion factor of 100 to arrive at final data in units of mg glycogen/g tissue.
Tissue Harvesting and Fixation
Animal experiments were conducted at Genzyme Corporation (Framingham, MA) according to Institutional Animal Care Committee standards. Control C57BL/6 and 6neo/6neo knockout mice (25) at various ages (1, 3, 6, 9, 12, 15 and 22 months, n = 3 per time point) were euthanized by CO2 asphyxiation and perfused with 0.1 M phosphate-buffered saline (PBS) followed by 10% neutral buffered formalin (NBF). After perfusion-fixation brains were quickly removed and immersed in 10% NBF for 48 hours. After fixation, wild-type and knockout brains were bisected at the midline and right hemispheres were divided into 1-mm-thick sagittal slabs with a sharp thin razor blade and a mouse brain blocker (Stoelting, Co., Wood Dale, IL) for processing into glycol methacrylate embedding medium (JB-4 Plus, Electron Microscopy Sciences, Hatfield, PA) and sectioning at 2–3 μm, followed by staining with the periodic acid Schiff method (PAS) and Richardson’s methylene blue/azure II counterstain. Whole left hemispheres were paraffin embedded and sectioned at 4 to 7 μm, followed by PAS staining and a hematoxylin counterstain. Cryostat sections cut at 20 μm were stained for cholesterol with the filipin reagent (Sigma-Aldrich), 10 mg/ml in PBS for 3 hours, and were examined by fluorescence microscopy.
Epon-Araldite Processing
Epon-araldite processing and staining methods were performed on 1 μm sections as previously described (26).
JB-4 Plus Processing
After primary immersion fixation in 10% NBF, slabs were washed twice (10 minutes each) in 0.2 mol/L sodium cacodylate buffer (pH 7.3) and post-fixed in a 1:1 mixture of 2% osmium tetroxide in 0.2 M cacodylate buffer and 5% potassium dichromate for 1 hour followed by multiple (4 to 5) rinses, 5 minutes each, with distilled water until clear. Infiltration, embedding into JB-4 Plus Media (Electron Microscopy Sciences), sectioning at 3 μm, mounting on charged glass slides, and staining were performed as previously described (28).
Paraffin Processing
After primary immersion fixation for 48 hours with 10% NBF, brain hemispheres were postfixed with 1% periodic acid in 10% NBF for 48 hours at 4°C, rinsed with PBS (three washes, 10 minutes each) and placed on a tissue processor (Leica Microsystems, Vienna, Austria) for dehydration, clearing and infiltration (28). Sections cut at 7 μm were mounted on charged glass slides.
PAS Reaction on JB-4 Plus and Paraffin-Embedded Tissue
Glycogen was identified in PAS-stained sections and was unstained in control sections treated with salivary diastase prior to staining (28). Briefly, for paraffin processing, slides were deparaffinized, hydrated progressively to distilled water for 5 minutes per stage, and identification of glycogen was performed with the PAS reaction. Slides were oxidized in freshly made 0.5% periodic acid for 5 minutes and rinsed in deionized water for 1 minute. After 15 minutes in Schiff’s reagent (SurgiPath Medical Industries, Richmond, IL) at RT, slides were washed in running tap water for 10 minutes for pink color to develop. Slides were counterstained with hematoxylin 1 (Richard Allan Scientific; Kalamazoo, MI) for 1 minute, rinsed with tap water, dipped in bluing reagent (Richard Allan Scientific) for 30 seconds, dehydrated to xylene and coverslipped with Acrytol mounting medium (SurgiPath). For tissues subjected to the modified paraffin processing described in the previous paragraph, the oxidizing step with periodic acid was eliminated, and slides were treated with the Schiff’s reagent only for 15 minutes at RT. Slides were counterstained, dehydrated and coverslipped as described above. With the Richardson or hematoxylin counterstains, glycogen was colored dark pink to magenta, nuclei dark blue and cytoplasm and other elements light blue.
Cupric-Silver Degeneration Method
To stain Pompe model and other mutant and wild-type mouse brain sections simultaneously, brains were embedded in a gel matrix by multi-brain technology (Neuroscience Associates, Knoxville, TN) and sectioned serially at 35 μm (29, 30) and processed by the De Olmos amino cupric silver staining method (31, 32). To complement the silver degeneration method, paraffin sections were stained with Fluoro-Jade C (33, 34).
Immunohistochemistry
Glial fibrillary acidic protein (GFAP) staining was performed with a Bond System automated immunostainer (Leica Microsystems, Bannockburn, IL). Slides were incubated in Epitope Retrieval-1 (ER-1) (Leica) for 10 minutes at 99°C, incubated with peroxidase block (Leica) for 5 minutes and serum-free protein block (Dakocytomation, Carpinteria, CA) for 10 minutes. Subsequently, the slides were incubated in rabbit anti-GFAP (diluted 1:10,000, Dakocytomation) for 30 minutes at RT followed by ready to use Mach-2 HRP Rabbit Polymer (Biocare Medical, Concord, CA) for 20 minutes and positive staining was visualized with diaminobenzidine (DAB). Both the peroxidase block (3.0% hydrogen peroxide) and the DAB used in this staining are included in Bond Intense R Detection System (Leica). Additional sections were stained with a microglial marker rat anti-F4/80 (1:10, Genzyme). Secondary antibodies used were donkey anti-species specific conjugated with Cy3. Serial sections were stained for the GFAP or F4/80 antigens, for glycogen, or were double-stained. Sections were visualized with a Nikon Eclipse E800 fluorescent microscope.
Additional sections were similarly blocked, then incubated in anti-F4/80 (Serotec, Raleigh, NC) 1:200 for 1 hour at room temperature, followed by three 5-minute washes in PBS and incubation in 1% Alexa Fluor-conjugated goat anti-rabbit IgG (Invitrogen-Molecular Probes, Carlsbad, CA) plus 30 mg/ml BSA in PBS for 2 hour at room temperature, washed three times in PBS, and mounted in Vectashield (Vector Laboratories, Burlingame, CA).
Electron microscopy
Methods previously carried out in this laboratory were used (17).
Evaluation of Sections
All stained sections were evaluated by one investigator (R.L.S.) and most were assessed independently by two additional investigators (T.T. and L.S.S.). Glycogen per cell in was evaluated qualitatively in Pompe model mice of various ages on a 0 to 5+ scale, based on visual judgment of PAS staining intensity in histological sections. All slides were identified by genotype and age at the time of study.
Behavioral Testing
Animals
For behavioral testing, 6neo/6neo mice at 3, 4, 6, 8 and 12 months of age were obtained from the Genzyme colony at Charles River. Three-month-old wild-type animals (n = 12) of B6129SF2/J strain were purchased from The Jackson Laboratory (Bar Harbor, ME). All behavioral testing was conducted between 1:00 to 4:00 P.M. to avoid circadian variation.
Four groups of animals were used: one group was wild-type as control; the other three groups were Pompe knockout (KO) mice at 3 months of age (group 1, young mice), 8 months (group 2, mid-age mice), and 13 months (group 3, old mice). Each group consisted of 6 male and 6 female mice (total n = 12 per group).
Procedures
Pompe knockout and wild-type mice were evaluated with a standardized functional observation battery of tests once a week from 3 months of age. Motor coordination and balance were measured with a rotating rod apparatus (SmartRod, Accuscan Instruments, Columbus, OH). For the rocking rotorod test, the rod was programmed to rock backwards and forwards for up to 2.5 sec duration with the overall acceleration in either direction increasing to 25 rpm. Cutoff times were 60 seconds for the accelerating test and 54 seconds for the rocking test. Animals were tested three times on each version of the test with a rest period of at least 5 minutes between measurements. Average fall latency from the rod (or cutoff time) was recorded for each animal and used for statistical analysis. Analyses of locomotor function were performed with the Student t test (Prism GraphPad, San Diego, CA). Data are mean ± SEM. p < 0.05 was considered as a statistically significant difference.
For the Foot Fault Test, each animal was placed on a wire rack with square holes for 60 seconds and the number of times the paws slipped into the holes was recorded. Each animal was tested twice. Mean values were used for statistical analysis.
Strength was measured with a Wire Hang Test. The ability to hang upside down from a wire screen placed 60 cm above a large housing cage was measured as a latency to fall into the cage. A score of zero was assigned to animals that fell immediately and a score of 60 seconds was assigned to animals that did not fall. Cut-off time was 60 seconds. Each animal was tested twice and means were used for statistical analyses.
Statistics
Mean values were used for statistical analyses. Data are expressed as mean ± SEM. For two groups the Student t test was used; for more than two group comparisons, one-way ANOVA was used followed by the post hoc Bonferroni multiple comparison test.
RESULTS
Biochemical Findings, Progressive Glycogen Accumulation
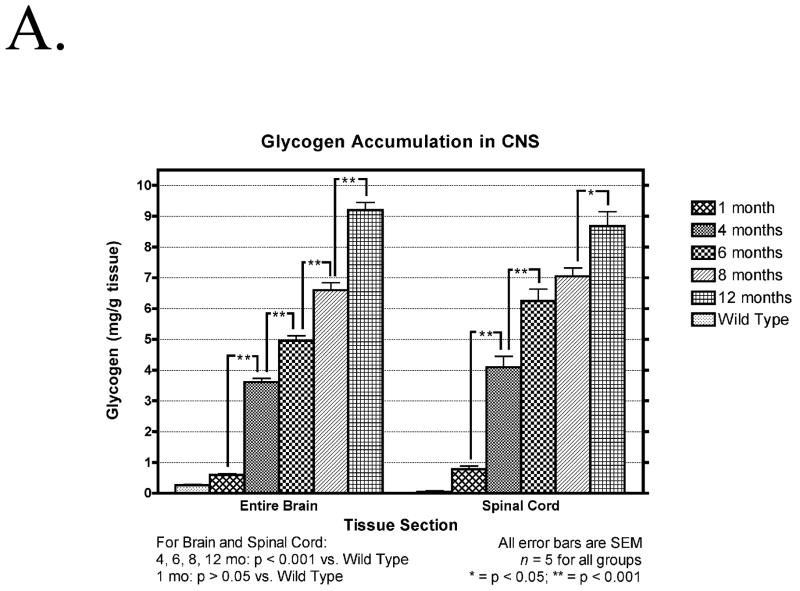
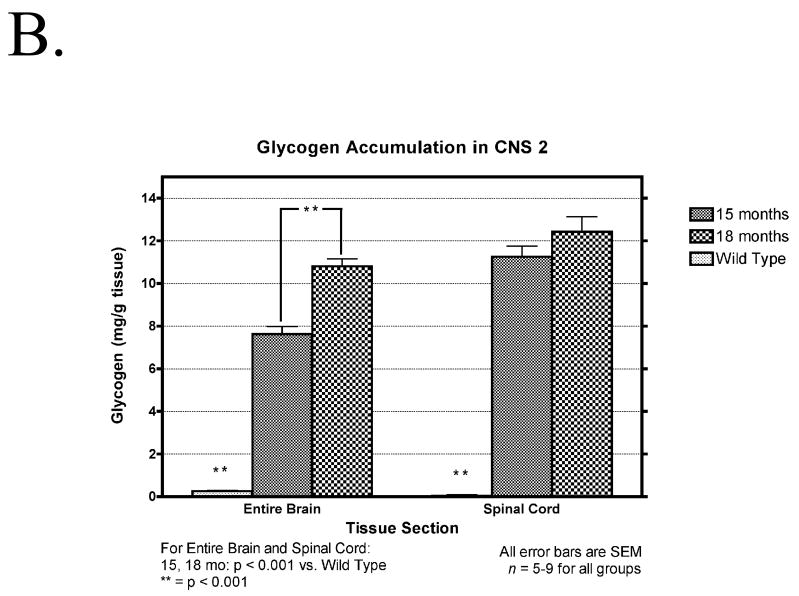
There was significant accumulation of glycogen over time in all regions of the brain and in the spinal cord of the mutant mice (Fig. 1A). No significant differences between 2-mm brain slabs were found per time point (data not shown). There was also a significant accumulation of glycogen in the brain between 15 and 18 month of age in 6neo/6neo mice obtained from a separate colony (Fig. 1B)
Figure 1.
(A) Temporal accumulation of glycogen in the CNS. Glycogen content of the total brain and spinal cord of five affected (1, 4, 6, 8 and 12 months old) and five normal (9 months old) animals, at each time point, is expressed as mg/g wet weight of tissue. Data are mean ± SEM. *, p < 0.05; **, p < 0.001, n = 5 per time point. (B) Glycogen content of the total brain and spinal cord of five affected (15 and 18 months old) and five normal (9 months old) animals, at each time point, is expressed as mg/g wet weight of tissue. Data are mean ± SEM. *, p < 0.05; **, p < 0.001, n = 5 per time point.
Neuropathology
The histochemical periodic acid-Schiff (PAS) method is less quantitatively precise than the chemical data above, but adds considerably to recognition of regional differences and the cell types affected. The major pathological process in the nervous system of the 6neo/6neo Pompe model mouse is intracellular accumulation of glycogen in cells of all types, but with significant regional differences in amount and temporal progression. No evidence was found of developmental abnormality, neuronal loss, cellular infiltration or myelin breakdown. Brain shapes were normal; ventricles in the brains of knockout mice were not enlarged compared to matched controls; pyknotic nuclei were not seen; perivascular inflammatory cell cuffs were absent; macrophage and microglial cell numbers stained by F4/80 were minimal and not different than in control sections; and no myelin breakdown was seen by electron microscopy. Only at the oldest ages (i.e. 15 and 22 months) was there evidence of some astrogliosis, particularly in white matter tracts, as seen in GFAP-stained sections (data not shown).
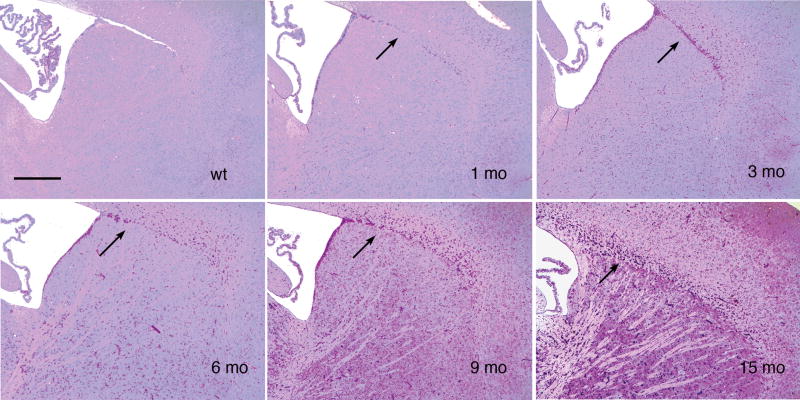
Glycogen, visualized by the red color imparted by the PAS stain and absent from control sections pretreated with salivary amylase, was below the threshold for detection in the normal mouse nervous system but was dramatically increased in the knockout mice. The striatum (Fig. 2) was representative of regions reacting for glycogen progressively as a function of age, reaching only moderate intensity at this site even by the relatively advanced age of 15 months. Slight glycogen accumulation in neurons, glia, pericytes and choroid plexus was seen starting at 3 months of age and progressively increased over time. Similar results were seen in the thalamus, although there was considerable variation among thalamic nuclei (data not shown).
Figure 2.
Glycogen accumulation in each CNS region is progressive. Sagittal sections of paraffin-embedded tissue, sectioned at 7 μm and stained with PAS-hematoxylin show a portion of the lateral ventricle containing choroid plexus (upper left of each field) with the adult stem cell generation site bordering the upper right (rostral) side of the ventricle. Most of each field is occupied by the striatum (caudate/putamen). Cerebral neocortex is in the upper right. Between the striatum and neocortex is the beginning of the rostral migratory stream (arrows), which stands out because many of its cells are rich in glycogen. Upper left, wild-type (wt) 9 month control; upper middle, upper right, lower left, lower middle, and lower right show the corresponding field in mutant mice at 1, 3, 6, 9, and 15 months, respectively. Glycogen is just detectable in the knockout at 1 month and then increases progressively, predominantly in glial cells (3 months and older) and small blood vessels (6 and 9 months), throughout the striatum and neocortex. The corpus callosum, just dorsal to the striatum and rostral migratory stream, contains many glycogen-rich glial cells, progressively increasing from 3 months onward. Striatal neurons appear free of glycogen but had moderate increases in glycogen-containing lysosomes in PAS-stained 1 μm and 3 μm plastic sections (not shown). Magnification: 100x for all panels in this figure; bar: 400 μm.
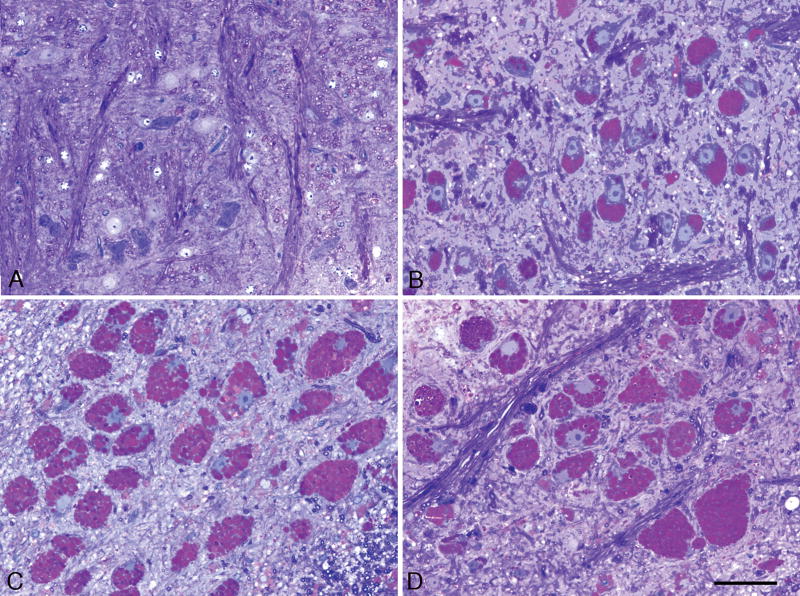
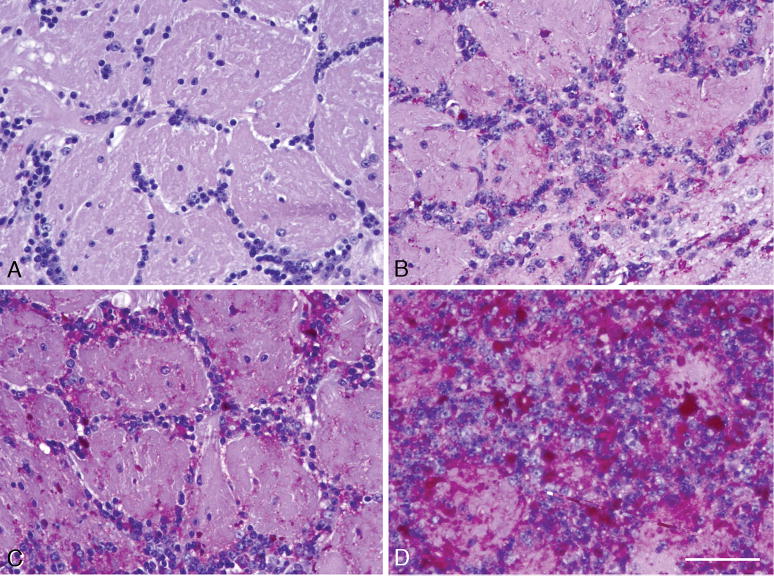
Large neuron cell bodies in multiple brainstem motor and sensory relay nuclei contained no detectable glycogen in control mice, but some large neurons in the knockout mice, such as the facial nucleus in the ventral medulla, were already packed with glycogen-rich enlarged lysosomes at one month of age. Both the total amount and concentration of glycogen per cell body increase progressively, so that the neuron cell bodies became correspondingly enlarged (Fig. 3). By contrast, adjacent fascicles of white matter in the knockouts contained relatively little glycogen at corresponding early ages, although the amount increased with age.
Figure 3.
Glycol methacrylate-embedded specimen, sectioned at 2 μm, stained with the PAS method and the Richardson counterstain, showing cells in the facial nucleus in the ventral pons. (A) Wild-type 3-month-old control mouse. (B–D) Panels are from 4-, 15-, and 22-month-old knockout mice, respectively. The enlarged round lysosomes are stained for glycogen with PAS (red), and fill the neuronal cell bodies. Most of the nuclei are displaced to the periphery of the cell, as in chromatolytic neurons. Similar data were obtained in large neurons in other brainstem motor nuclei. Magnification: 400x for all panels in this figure; bar: 20 μm.
As demonstrated in Figure 2, most parts of the cerebral cortex stained weakly to moderately for glycogen, even at ages greater than one year. An exception was the glomerular layer of the olfactory bulb in which granule cell neurons within and around the glomeruli were distinctly positive for glycogen at one month, and then gained glycogen dramatically and progressively, as illustrated at 3 and 15 months (Fig. 4).
Figure 4.
Olfactory bulb glomerular layer, paraffin, 7-μm section, PAS-hematoxylin stain. (A) Wild-type 6-month control. (B–D) Knockouts at 1, 3, and 15 months, respectively. Glycogen increases progressively in periglomerular granule cell neurons and in glial cells within the glomeruli. Magnification: 200x for all panels in this figure; bar: 100 μm.
The rostral migratory stream (RMS), delineated distinctively by its strong glycogen staining, carried stem cells from the subventricular zone (Fig. 5A) in the RMS (Fig. 5B) all the way to the olfactory bulb (Fig. 5C). The RMS widened as its cells were about to enter the deep (internal granular layer) and superficial (glomerular layer) parts of the olfactory bulb. The ependymal cells contained lipid droplets but were almost glycogen-free (Fig. 5A), whereas the majority of the large and medium-sized subventricular astrocytic cells in the adult stem cell niche (35) (Fig. 5A) and RMS (36) (Fig. 5B) were intensely glycogen-positive, and were thus distinguished from CNS astrocytes in general, which stained relatively lightly or moderately for glycogen.
Figure 5.
(A, B) Glycol methacrylate-embedded 3-μm sections of 4% paraformaldehyde-fixed, post-osmicated tissue stained with the periodic acid-Schiff method for glycogen, counterstained with Richardson’s stain, through the adult stem cell niche (A), and rostral migratory stream (B) in a 3-month-old knockout mouse. (A) The rostral part of the lateral ventricle is seen at the upper left, and is lined by ependymal cells containing little glycogen, but with prominent cytoplasmic lipid droplets of various sizes (black droplets, some marked with white arrows). External to the ependymal zone is a prominent subventricular zone in which the majority of large astrocytic stem (progenitor) cells are filled with glycogen (white arrowheads). The horizontal zone in the lower quarter of the field is the dorsal part of the striatum (caudate/putamen) with bundles of myelinated axons and interspersed glial cells, some of which contain moderate amounts of glycogen (black arrows). (B) Approximately halfway toward the olfactory bulb, illustrated here (and elsewhere along the RMS), the RMS is demarcated by prominent assemblage of glycogen-rich cells (black arrowheads), probably of both glial and young neuronal types. Smaller amounts of glycogen are present in glial cells of the striatum (black arrows in lower half of the field) and in the cerebral cortex (upper right quadrant). Panels A and B, magnification: 400x; bar: 100 μm. (C) Paraffin section, 7 μm, PAS-hematoxylin stain of the olfactory bulb. Positioned in a vertical band along the left side of the figure are the olfactory bulb’s glycogen-poor mitral neurons, which send axons out of the bulb in the lateral olfactory tract, to innervate regions in the basal and medial cerebral cortex. Many glycogen-rich cells lie in the outer granular layer (left two-thirds of the field, to the right of the mitral cell layer) and in the glomerular layer (right edge of the figure), especially in the periglomerular zones. Panel C, magnification: 200x; bar: 50 μm.
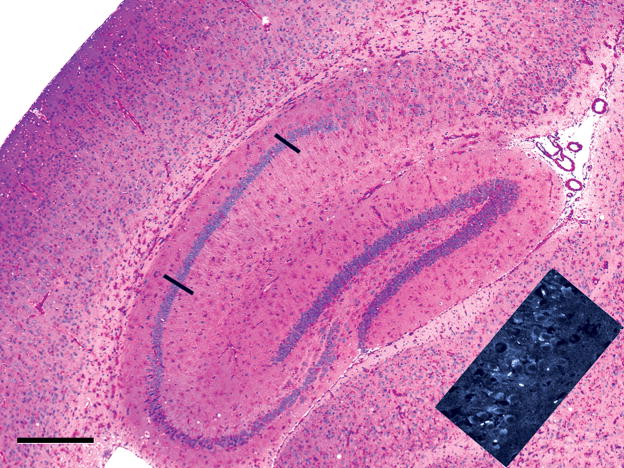
Similar to the cerebral cortex, striatum, and thalamus, the hippocampal formation (Fig. 6, center of the field) became moderately rich in glycogen by 15 months, but the prominent bands of granule cell neurons of the dentate gyrus and the pyramidal neurons of the hippocampus itself contained less glycogen than the interstitial, presumably GABAergic neurons. Note that the pyramidal neurons in hippocampal area CA1, between the two bars, are almost entirely free of glycogen. Likewise, most of the projection neurons of the cerebral cortex contained little glycogen, in contrast to the heavily stained penetrating blood vessels. Thus, glycogen accumulation was present in multiple cell types including neurons, glia and pericytes, but some cells were more severely involved than others. Accumulation of glycogen, however, was not the sole abnormality; the inset at the lower right corner displays a band of CA1 pyramidal neurons oriented like the cell band between the two bars in the main part of the figure stained with PAS/hematoxylin, whereas the inset displays a non-fluorescent background (black) and superimposed fluorescence (white) due to binding of the fluorescent molecule, filipin, to lysosomal cholesterol which is known to accumulate non-specifically in the abnormal lysosomes in several of the lysosomal storage diseases.
Figure 6.
Paraffin section, 7 μm, PAS-hematoxylin. The hippocampal formation (dentate gyrus, hippocampus CA1, Ca2, and CA3, and subiculum) occupies the center of the field, and a sector of cerebral neocortex lies in the left part of the field of a 15-month-old knockout mouse. Glial cells contain increased glycogen in the radiatum and lacunosum layers of the hippocampus, in the dentate gyrus and subiculum, in the corpus callosum dorsal to the hippocampus, while glycogen-rich glial and vascular cells lie in the gray matter of the cerebral cortex (top left) and thalamus (left of inset). The inset shows lysosomal fluorescence (white), due to binding of the filipin reagent to lysosomal cholesterol in the apical cytoplasm of CA1 pyramidal neurons, even though these cells, delimited by the black bars in the colored part of the figure, are predominantly glycogen-free. Bar: 500 μm.
The extent of the glycogen accumulation and the increase with age varied among brain regions and the cell types involved. For example, in thalamus and striatum, glycogen increased earlier and staining was more intense in small blood vessels and glial cells than in small- to medium-sized neurons (Figs. 2, 6). By contrast, in spinal cord and lower brainstem the most prominent abnormality was the massive and early increase of glycogen in large neurons, especially motor neurons (Figs. 3, 10B), but also in some other sites such as the medial vestibular nucleus, the ventral nucleus of the posterior colliculus, and the mesencephalic nucleus of the trigeminal (data not shown).
Figure 10.
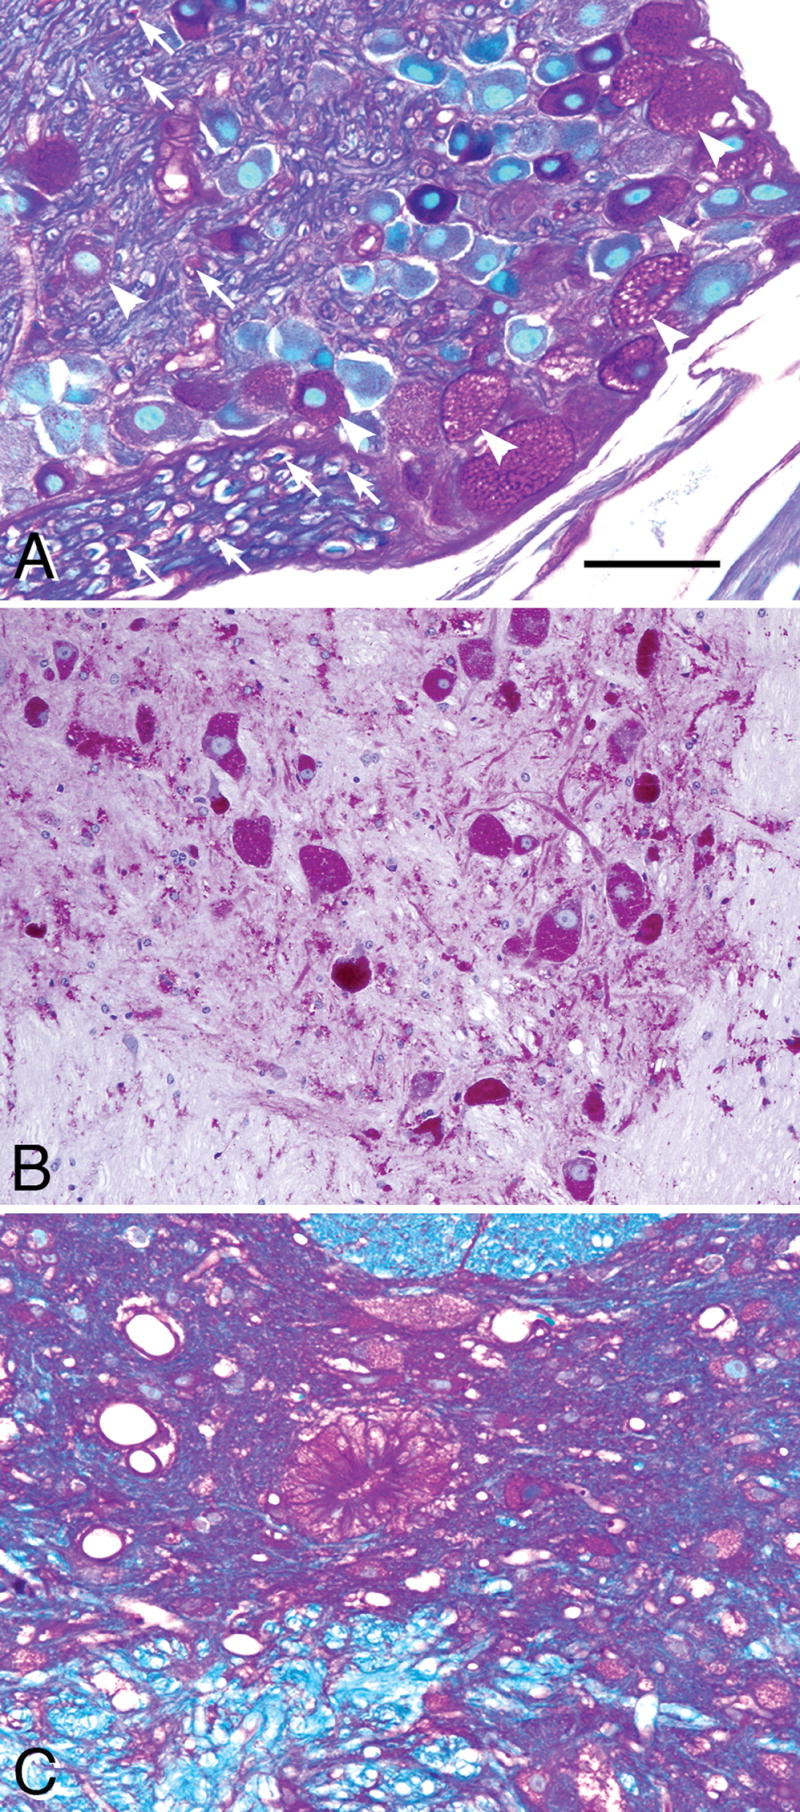
(A) Paraffin-embedded 7-μm section stained with the PAS method and counterstained with Richardson’s stain shows that many, but not all, dorsal root ganglion (DRG) neuron cell bodies are filled with glycogen and contain vacuoles at sites where lipids have dissolved out during the processing of the tissue (white arrowheads). Relatively low amounts of glycogen are also seen in Schwann cells (white arrows) and endothelial cells of the peripheral nerve. (B) Glycol methacrylate-embedded 3-μm section through the low thoracic spinal cord, PAS stain for glycogen, Richardson counterstain. Large ventral horn motor neurons were filled with glycogen-containing lysosomes and small neurons and many glial cells in gray and white matter also accumulated glycogen. (C) The columnar ependymal cells of the spinal cord stained strongly for glycogen in a 3-month-old mutant mouse. Ependymal cells in the brains of these mice contained little or no glycogen. Magnification: all panels, 200x. Bar: all panels, 30 μm.
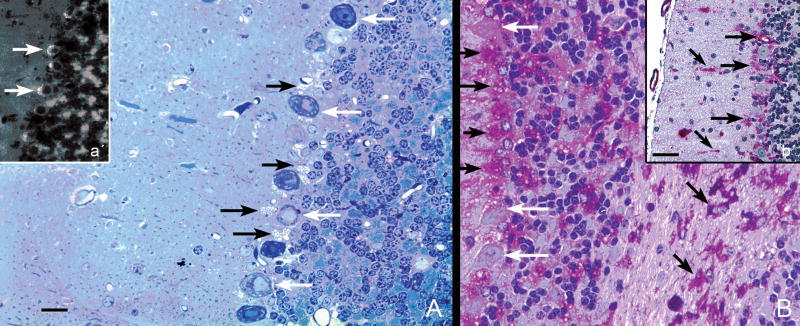
In contrast to the consistent observation of marked glycogen accumulation in large neurons of the ventral horn of the spinal cord and in the brainstem, the Purkinje neurons, which are among the largest cells in the brain, contained very little glycogen and only slight vacuolation (Fig. 7A and 7B, white arrows). By contrast, the adjacent specialized astrocytes, called Golgi epithelial cells, appear to bear the brunt of the disease process, as they had intensely vacuolated cell bodies (Fig. 7A, black arrows) and stained intensely for glycogen (Fig. 7B, black arrows). Even at 15 months of age, the Purkinje neurons were relatively spared, but the adjacent Golgi epithelial astrocyte cell bodies and their radially oriented cytoplasmic processes (Bergman fibers) crossing the molecular layer were filled with glycogen (Fig. 7b′). At this late stage, the entire molecular layer at this late stage was diffusely glycogen-positive and there was abundant glycogen in the granular layer (Fig. 7B, in clumps adjacent to the small granule cell bodies [perhaps in mossy fibers—incoming axon terminals contacting granule cell dendrites], in glial cells of the folial white matter (Fig. 7B, right lower quadrant), and in the entire nuclear region deep in the cerebellum (data not shown). The final point is that Purkinje neurons, although almost devoid of glycogen, did fluoresce intensely based on binding of the fluorescent reagent, filipin, to cholesterol in the apical cytoplasm of these cells (Fig. 7a′, white arrows). Loss of Purkinje and granule cell neurons was not recognized at any age examined and myelin appeared normal by the methods used.
Figure 7.
Cerebellar cortex, 15-month-old knockout mice. (A) Glycol methacrylate-embedded tissue sectioned at 3 μm, stained with Richardson’s stain. Purkinje neuron cell bodies (white arrows) are mildly vacuolated (and almost free of glycogen, as seen in B), whereas the cell bodies of adjacent Golgi epithelial cells (radially-oriented astrocytes) are markedly vacuolated. Magnification: 200x; bar: 20 μm. a′. Cryostat section, 20-μm-thick stained with the fluorescent dye, filipin, shows intense accumulation of cholesterol in the apical cytoplasm of Purkinje neurons (white arrows), even though these cells differ from most other large neurons in not accumulating comparable amounts of glycogen (B). Magnification: 100x. (B) Paraffin section, 7 μm, stained with the PAS method and counterstained with hematoxylin. There is marked glycogen accumulation in the cell bodies of Golgi epithelial cell astrocytes (horizontal black arrows) and in clumps in the granular layer and in the cytoplasm of most glial cells in the cerebellar cortical white matter (oblique black arrows). In contrast to many other types of large neurons, the Purkinje cell bodies contain only small amounts of glycogen (white arrows). Magnification: 200x, same magnification as in panel A. b′. Glycogen accumulation is prominent also in the molecular layer and in the cell bodies (horizontal black arrows) and apical cytoplasmic processes (Bergman fibers, oblique black arrows) of Golgi epithelial cell astrocytes, but not in basket or stellate neurons. Magnification: 200x; bar = 20 μm.
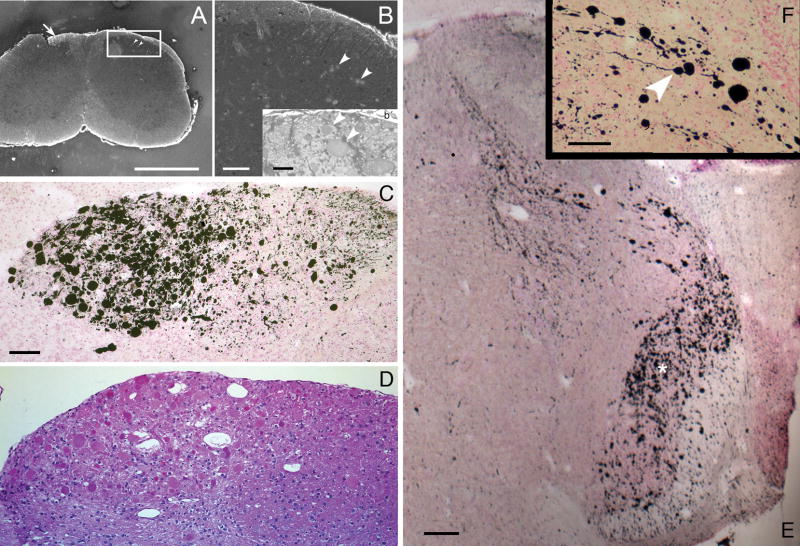
A striking finding was the presence of remarkably enlarged degenerating axons and especially axon terminals in the lower brainstem and spinal cord. The affected axons arise in sensory neurons of the PNS, in dorsal root ganglia (DRGs) and in the trigeminal ganglion. Axons of DRGs run up the spinal cord within the dorsal columns and terminate in the nuclei gracilis and cuneatus of the lower medulla; axons arising outside the brain in the trigeminal ganglion course caudally through the pons and medulla in the spinal tract of the trigeminal nerve and terminate in contact with second order neurons in the spinal nucleus of the trigeminal tract. Swollen degenerating axonal shafts were seen within the spinal cord in sections stained with Fluoro-Jade C (Fig. 8A, B, b′). Progressive evidence of degeneration was seen starting at 6 months of age. Degenerating axon terminals were most vividly demonstrated with silver degeneration staining methods (Fig. 8C, E, F). Conclusive evidence that the silver images reliably demonstrate abnormal axons and axon terminals was obtained by staining adjacent sections with hematoxylin and eosin, which showed relatively uniformly stained eosinophilic structures of the same positions and sizes as the silver images (Fig. 8D). The diameters of the degenerating terminals ranged from approximately five to more than 50 μm (Fig. 8C–F). Trigeminal axon terminals (Fig. 8E) were less markedly swollen than dorsal root ganglion axons (Fig. 8C, D), but were still far larger than their normal counterparts, which are not resolvable by standard light microscopy. Axonal profiles of comparable large size are never seen in spinal cords or brains of normal rodents.
Figure 8.
(A, B, and b′) From a transverse section through the cervical spinal cord of a 6-month-old knockout mouse stained with the fluorescent dye, Fluoro-Jade C, showing swollen axons that cross the dorsal gray matter (A, arrowheads in the boxed area, enlarged in B). These neurons will make synaptic contact with second-order neurons in the dorsal horn of the spinal cord. Some stained axons of dorsal root ganglion neurons ascend on the dorsal white matter (white arrow in A); they will terminate in grossly swollen axon terminals in the lower medulla (C, D). (C) Intense silver precipitation (black staining) in the nucleus gracilis (left half of field) and less in the adjacent nucleus cuneatus (right half of field). This image is from a slide stained by the cupric silver method of De Olmos (29–32). Comparable staining in these second order sensory nuclei was observed bilaterally in every section through the low medulla stained by this method from every knockout mouse at all ages from 1 to 15 months but not in comparable sections from wild-type mice or from mice with other lysosomal storage diseases mounted on the same slides. (D) The corresponding field from a nearby section stained with hematoxylin and eosin, showing that the swollen axon terminals stained with silver in C are also stained homogeneously with eosin (red). (E) Transverse section through the rostral medulla of an 11-month-old knockout mouse, showing silver-stained (black) swollen and degenerating axon terminals in the lateral and dorsal medulla, the former (broad band oriented vertically, marked with white asterisk) clearly belonging to the spinal tract of the trigeminal nerve and the latter (a lesser band oriented from dorsomedially to ventrolaterally) from the same tract or possibly from the solitarius sensory pathway. (F) This inset, at higher magnification, shows short segments of axons of normal or near-normal caliber terminating in grossly swollen endings of 5- to 50-μm diameter (e.g. white arrowhead). Magnifications: C, D, 200x; E, 20x; F, 400x. Bars: A, 600 μm; B, 100 μm; b′, 50 μm; C, D, 200 μm; E, 400 μm; F, 100 μm.
The one additional site in which degenerating axon terminals consistently occurred was in the mossy fiber terminals on pyramidal neuron dendrites in hippocampal segments CA2 and CA3 of knockout mouse brains. These axons originate from granule neuron cell bodies in the dentate gyrus. The strongest reaction, beginning at about one month of age, was close to the CA2–CA3 boundary. In the dorsal part of the rostral hippocampus in coronal sections, the exact position of this boundary is uncertain in Nissl-stained sections, but the silver reactivity was always stronger on the boundary’s CA2 side (Fig. 9A, black arrow) than on the CA3 side (Fig. 9A, white arrow), and was minimally detectable in the hilus and dorsal limb of the dentate gyrus (Fig. 9A, B). More caudally in coronal sections (Fig. 9B), the hippocampal formation curves down toward the ventral surface of the brain, and the CA2 (black arrow) and CA3 (white arrow) segments in this area are distinctly separated from each other. Here it was clear that the stronger reactivity was in CA2 (Fig. 9B, black arrow). The CA2 region is functionally distinct from CA1 and CA3 (37).
Figure 9.
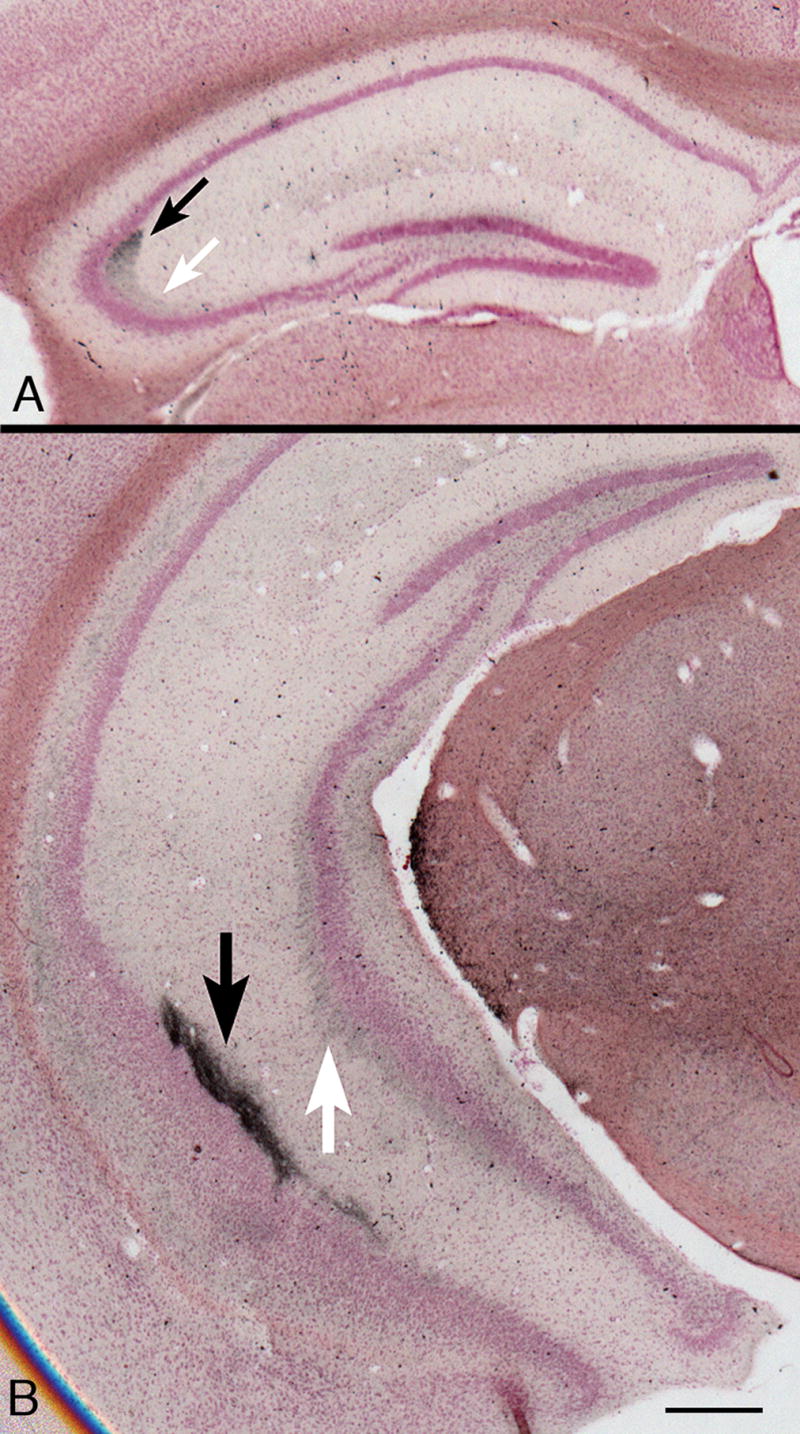
(A) Rostral part of the hippocampal formation in a coronal section from a 7-month-old knockout mouse. Staining intensity is strongest on the CA2 side of the fuzzy boundary between segments CA2 (black arrow) and CA3 (white arrow). The pyramidal cell body layer at the medial end of CA3, close to the hilus of the dentate gyrus shows a typical mild malformation. There is minimal silver degeneration staining in the hilus and dorsal limb of the dentate gyrus. De Olmos silver degeneration stain. (B) At a more caudal level in a comparable 9-month-old knockout mouse, the hippocampal formation curves ventrally (for orientation, see three-dimensional reconstructions in http://www.hms.harvard.edu/research/brain), so that CA2 (black arrow) and CA3 (white arrow) here are separate from each other. Differences in staining intensity between CA2 and CA3 are clear. Magnifications: A, B, 20x. Bars: A, B, 500 μm.
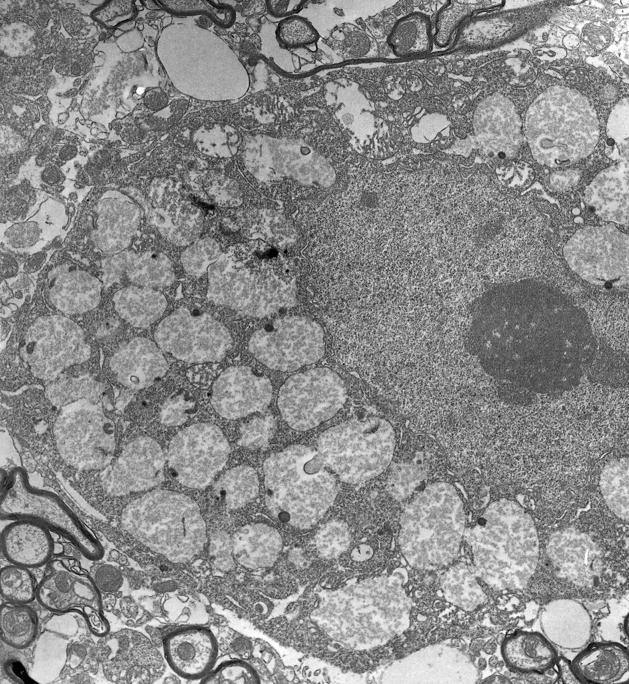
Many neurons in the PNS, like those in the CNS, also developed cytoplasmic vacuoles and accumulate glycogen, as illustrated in a typical DRG (Fig. 10A, arrowheads). Excessive glycogen was also seen in Schwann cells (Fig. 10A, arrows) and less obviously in myelinating glia (data not shown). Also, at all levels of the spinal cord, accumulation of glycogen in neurons of various sizes was prominent, for example, in the thoracic spinal cord of an 8-month-old knockout mouse (Fig. 10B). This site was chosen for illustration because Pompe patients typically develop respiratory signs, as well as “floppy baby” motor signs and at older ages, debilitating fatigue (38–40). These manifestations might be the consequence purely of the skeletal and cardiac muscle abnormalities, but could possibly also result from spinal cord neuron malfunction. Prominent neuronal storage was found in the ventral horns and in all motor nuclei of the brainstem at 3 month of age. The glycogen in large neurons such as those illustrated in Figures 3 and 10 was predominantly in lysosomal organelles, as shown by electron microscopy (Fig. 11).
Figure 11.
Electron micrograph of part of the cell body of a spinal cord motor neuron. The cell nucleus occupies the middle right part of the field, and is surrounded by cytoplasm in which more than 50% of the volume is occupied by enlarged lysosomes. Magnification: 12,500x.
Another site of glycogen accumulation was in columnar ependymal cells lining the spinal canal (Fig. 10C). By contrast, the cuboidal ependymal cells lining the ventricles throughout the mutant brain were almost free of glycogen that could be detected by the methods used in this study (Fig. 5A).
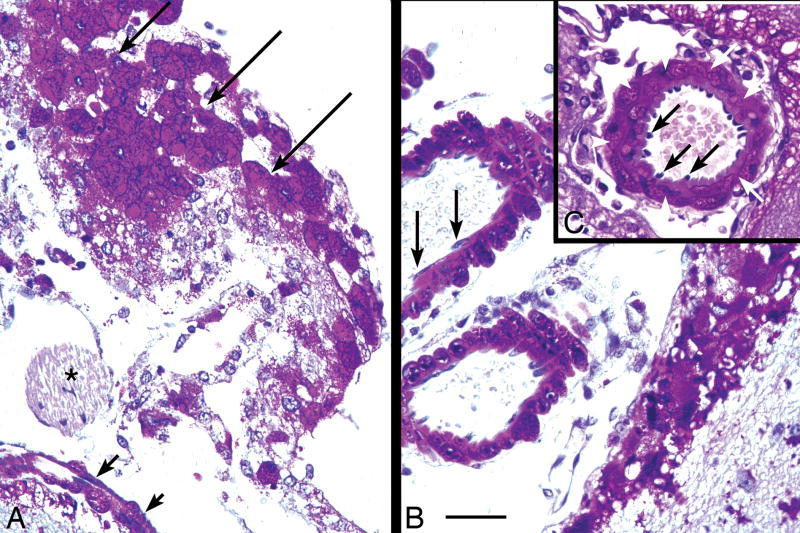
In sections doubly stained with PAS and GFAP immunohistochemistry, glycogen was increased particularly in astrocyte cell bodies, but also was evident in astrocytic cytoplasmic processes extending several cell body diameters outward (data not shown). Glycogen storage in glial cells was widespread but was most pronounced in the white matter of the cerebral hemispheres and spinal tracts. Evidence of moderate gliosis was seen only at 15 and 22 months of age, and was mainly present in white matter tracts and brainstem. Glycogen accumulation was not, however, limited to neurons and glial cells since meningeal cells and blood vessels also accumulated very large amounts of glycogen. The specialized large flat meningeal cells arranged in a monocellular sheet on the external surface of the CNS became filled with glycogen by 15 months of age (Fig. 12A), even though cells of peripheral nerve in the immediate vicinity (cranial nerve IV, asterisk) were glycogen-free. Likewise, pericytes and smooth muscle cells in the walls of arteries on the external surface of the brain were rich in glycogen, though the thin endothelial cells lining the same arteries and adjacent veins were glycogen-free (Fig. 12B, C). Arteries can also be affected in the human disease (41, 42).
Figure 12.
(A–C) Paraffin-embedded 7-μm section stained with the PAS method and counterstained with hematoxylin, showing meningeal cells and large blood vessels at the dorsal surface of the midbrain of a 15-month-old knockout mouse. (A) Large flat meningeal cells in face view (long arrows) and edge view (short arrows), are filled with glycogen. By contrast, the myelinated IVth cranial nerve (asterisk) lying external to the brainstem in the meninges, appears to be glycogen-free. (B) Large meningeal blood vessels. The large arteries and thin-walled veins external to the brain have glycogen-free endothelial cells (black arrows). (C) The endothelial cells (black arrows) in arteries are surrounded by glycogen-rich smooth muscle cells (white arrows). Magnification: 400x. Bar: all panels, 50 μm.
The extent of intracellular glycogen accumulation in various nervous system regions as a function of mouse age is summarized in the Table. These results are consistent with the regional distributions in a 6-month human infant listed in Table 1 in Martin et al (14).
Table.
Qualitative Evaluation of Increases in Cellular Glycogen
| Structure | Age | |||||
|---|---|---|---|---|---|---|
| 1 Month | 3 Months | 6 Months | 9 Months | 12 Months | 15 Months | |
| Brainstem and spinal cord motor nuclei | 3+ | 4+ | 4+ | 4+ | 4+ | 5+ |
| Brainstem sensory nuclei | 2+ | 3+ | 3+ | 3+ | 3+ | 3+ |
| Brainstem white matter | 1+ | 2+ | 3+ | 3+ | 3+ | |
| Dorsal root ganglion neurons | 2+ | 3+ | 4+ | 4+ | 4+ | 4+ |
| Striatum, neurons | 1+ | 1–2+ | 2+ | |||
| Striatum, glia and small vessels | 0–1+ | 1–2+ | 2+ | 2–3+ | 3+ | |
| Thalamus, neurons | 1+ | |||||
| Thalamus, glia and small vessels | 0–1+ | 1–2+ | 2+ | 2–3+ | 3+ | |
| Cerebral neocortex, neurons | 1+ | 1–2+ | 2+ | |||
| Cerebral cortical white matter | 1+ | 2+ | 3+ | 3–4+ | 4+ | |
| Rostral migratory stream | 2+ | 3+ | 3+ | 4+ | 4+ | 4+ |
| Olfactory bulb | 1+ | 2+ | 2+ | 3+ | 3+ | 4+ |
| Hippocampal pyramidal neurons | 1+ | |||||
| Hippocampal interstitial neurons | 1+ | 1–2+ | 2+ | |||
| Cerebellar Purkinje neurons | 1+ | |||||
| Cerebellar Golgi radial glia | 1+ | 2+ | 3+ | 3+ | 4+ | |
| Cerebellar nuclei | 2+ | 2+ | 3+ | 3+ | 3+ | |
| Meningeal cells and large vessels | 1+ | 2+ | 3+ | 3+ | 4+ | |
Glycogen per cell was evaluated qualitatively in Pompe model mice of various ages on a 0 to 5+ scale based on visual judgment of PAS staining intensity in histological sections.
Behavioral Abnormalities
To establish a battery of behavioral tests that can be used to measure functional outcome of therapeutic strategies being developed for Pompe disease, we evaluated motor function and coordination in this mouse model with the rocking rotarod, wire hang, and foot fault behavioral tests.
Rotarod
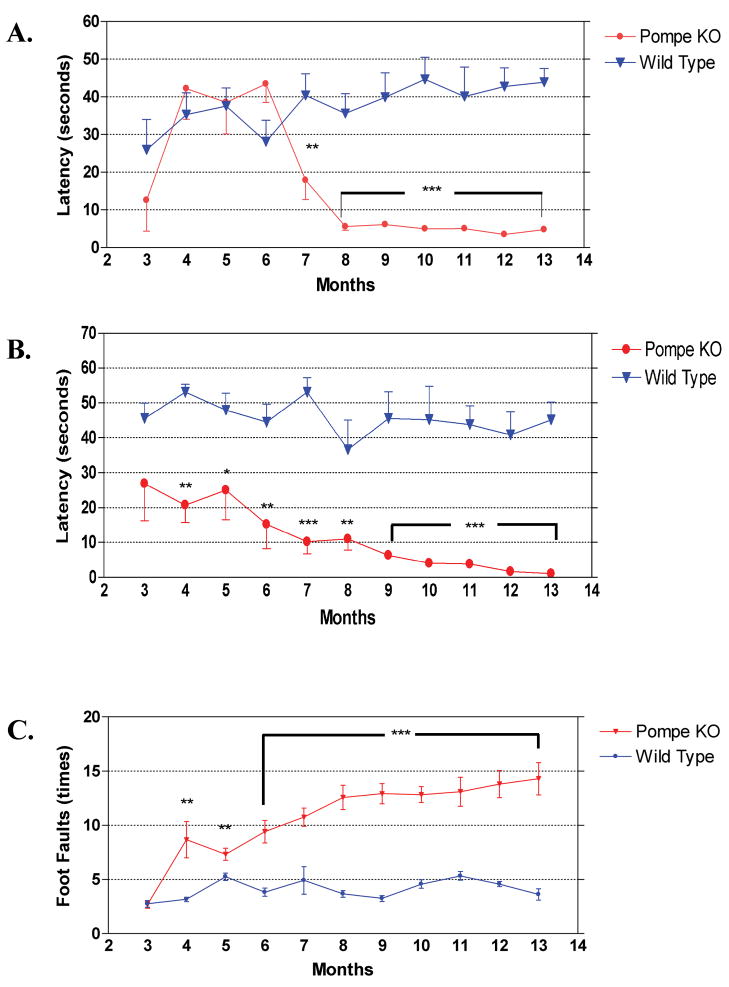
Muscle strength and motor coordination of mice were measured with a rocking rotarod. Testing was performed monthly, beginning at three months. All mice showed an initial learning effect on the rotarod test and reached a stable level of performance on the second test session, as demonstrated by an increased mean latency time before mice fell from the rotarod. The rocking rotarod test is more difficult for mice than the accelerating test. Throughout the study wild-type mice maintained balance on the rotarod for about 40 seconds or close to maximum allowed time of 54 seconds.
Pompe KO mice performed equally well on the rotarod until 6 months of age, and showed a sharp decline in performance at seven to 8 months of age that was then maintained to the end of the study (Fig. 13A). The difference between wild type and Pompe KO mice was highly significant from seven months of age onward (p < 0.01 or p < 0.001).
Figure 13.
(A) Rocking rotarod test for muscle strength and muscle coordination. All animal were tested from 3 to 12 months of age, with 12 animals per group. Pompe knockout mouse performance deteriorated sharply between 6 and 8 months of age, and remained poor thereafter. Data are mean ± SEM. **, p < 0.01; ***, p < 0.001 (Student t test). (B) Wire hang test for muscle strength. All animals, 12 per group, were tested from 3 to 13 months of age. Knockout mice gave significantly poorer scores at all ages. Data are mean ± SEM. **, p < 0.01; ***, p < 0.001 (Student t test). (C) Foot fault test for muscle coordination. All animals, 12 per group, were tested from 3 to 13 months of age. Knockout mice were indistinguishable from controls at 3 months of age, but showed significantly more foot faults at all older ages. Data are mean ± SEM. **, p < 0.01; ***, p < 0.001 (Student t test).
Wire Hang
The wire hang test was designed to serve as a more stringent test for muscle strength. The latency of hanging on the metal wire screen was used to measure muscle strength. Mice were suspended upside-down by all four paws from a 1-cm-square grid 30 cm above the table surface and the latency time to fall was recorded, with a maximum allowed latency of 60 seconds. Wire hang was performed once a month from three to 13 months of age. There was already a significant difference in latency between mutant and wild-type mice at three months of age, and the mutant mice continued to show a monthly gradual decline, so that by 12 months of age, they could barely hang onto the wire (Fig. 13B). Wild-type animals sustained their good performance through the entire test period. There was a significant difference in latency of falling from the wire between KO and wild-type animals throughout the test. At 6 months of age, the p value was less than 0.01, and for later time points, less than 0.001.
Foot Fault
At three months of age, wild-type and KO mouse showed the same number of foot faults during a 60 second test period (Fig. 13C). Pompe KO mice demonstrated a gradual increase of foot faults during the next 10 months, whereas wild-type animals held a constant level. The performances were significantly different from four months of age onward, with a three-fold difference in the numbers of foot faults in the final months.
DISCUSSION
Experimental Models
Several papers describe Pompe-like phenotypes in each of three additional species: spontaneously mutant Shorthorn and Brahman cattle (43), Lapland dogs (44), and Japanese quail (45). For experimental therapeutic studies, however, cattle are too large to test with expensive therapeutic agents, and dogs appear to be unavailable in sufficient quantity, though they do show extensive glycogen deposition and granulovesicular abnormalities in cells of the CNS. The quail phenotype features extensive pathology in skeletal muscle, but the nervous system has not been described and the quail differ from human Pompe cases in showing onset at embryonic stages and no cardiomyopathy despite some increase in cardiac glycogen. Thus, the test animals of choice appear to be the GAA knockout mice.
Is the Mouse an Adequate Model of Pompe Disease?
Like the infantile form of the human disease, the mouse models almost entirely lack GAA enzyme. Unlike their human counterparts, however, affected mice do not develop cardiac or respiratory signs, have far lower levels of muscle glycogen and do not die in infancy. In these respects, the mice appear to share features of the infantile and later onset forms of the human disease. Moreover, even when they carry the same mutations, affected humans can show remarkably different phenotypes and can differ dramatically in age of onset and pace of disease progression. The basis for this difference may lie in variations in genes other than the GAA gene itself; the same argument probably applies to the differences among the three mouse models, since each is on a different genetic background. Despite the behavioral variability, however, the biochemical and pathological data are relatively similar in affected humans and mice. Therefore, in these respects the mouse disease serves as an adequate model. A few earlier reports (2, 14) described abnormal glycogen accumulation in multiple regions of the nervous system in human Pompe disease cases, but in recent years this issue has been largely ignored and the focus has been on skeletal and cardiac muscle. The mouse and human diseases share features such as massive accumulation of glycogen in large motor neurons in the spinal cord, brainstem, and DRG; glycogen storage in astrocytes, myelinating glia, and peripheral Schwann cells; a greater glycogen increase in astrocytes than in neurons in cerebral neocortex, hippocampal formation, striatum and thalamus; and the involvement of meningeal cells, pericytes and cells in the muscular walls of large cerebral vessels (2, 14). Furthermore, less pronounced accumulation of glycogen was also seen in the posterior horns and sensory nuclei of the brainstem and very slight to absent accumulation in cortical neurons and Purkinje cells in the KO mice. In humans, CNS myelination appears to be normal or very slightly retarded for the patient’s age, and gliosis is present in the white matter of the cerebral hemispheres, spinal tracts, the anterior horns, the pyramids, the subpial and subependymal zones (14). Findings in the GAA knockout mouse that have not been reported in humans include enlargement and staining with “degeneration” methods of primary sensory neuron axon terminals, the progressive increases in glycogen in olfactory bulb glomeruli, in cerebellar cortical Golgi epithelial cell astrocytes and their Bergman radial processes, and in astrocytes along the rostral migratory stream. In view of the fact that the significance of brain involvement in infantile-onset Pompe disease remains unclear, the detailed description in the present report of nervous system pathology in the 6neo/6neo mouse is intended to stimulate reexamination of the effects of the nervous system pathology in human Pompe disease cases. In light of the current interest in ERT, understanding the CNS pathology is important to clarify the long-term prognosis of patients with CNS involvement.
It may be that the rates of glycogen synthesis and accumulation in the face of GAA deficiency are similar in an absolute sense, independent of the differing life span in the two species, so that it takes an approximately similar time to accumulate enough glycogen to cause disease manifestations in humans and mice. It was recognized early (4) that symptoms reflect not the congenital enzyme deficiency itself but rather the consequent accumulation of glycogen, so that humans with complete lack of enzyme appear to be healthy at birth, but typically die within the first year after birth. Genetically affected mice, perhaps accumulating comparable amounts of glycogen in a comparable number of months, are full adults at the time that death is induced by the disease.
Is the Nervous System Functionally Abnormal?
A key issue is whether nervous system cells, like skeletal muscle cells, lose normal function when they are loaded with glycogen. The present study documents glycogen increases in almost every type of cell in the nervous system in most, though not all, regions. Nonetheless, the only tangible evidence for nervous system malfunction, as opposed to the prominent accumulation of glycogen, is the hearing deficit in human patients and the comparable functional defects in affected mice, traceable to increased glycogen in inner and outer sensory hair cells of the organ of Corti, supporting cells, stria vascularis, and spiral ganglion neurons in the inner ear (46). Comparable data are not available for vision, where neurons in the inner retinal layers accumulate glycogen but retinal photoreceptor cells appear spared (47, 48). An increase of glycogen in Schwann cells of PNS as well as in CNS neurons has been described (13, 17, 49, 50), but without electrophysiological abnormalities. Careful examination of skeletal muscle has suggested that neurogenic-like alterations may be present in all Pompe subtypes (51). It is surprising that little testing of Pompe disease patients with contemporary electrophysiological methods to assess whether the debilitating motor weakness is referable entirely to muscle pathology has been reported. It may be that the lower motor neuron pathology and/or the glycogen-related abnormalities in DRG neurons and the dramatic degenerative changes in axon terminals of DRG and trigeminal ganglion neurons observed in the mutant mice may occur in the human disease. Despite the changes in axon terminals of primary sensory neurons demonstrated with the cupric silver degeneration method and confirmed by eosin and Fluoro-Jade C staining, however, we did not detect extensive degenerative loss of neuron cell bodies, based on the absence of Fluoro-Jade C-stained cells or cells with pyknotic nuclei.
Many of the standard behavioral tests used with mice reflect motor strength and coordination, which appear from our study to be well preserved at early stages of the disease. This may be because of the exceptional sparing of cerebellar Purkinje neurons from the early and intense glycogen accumulations seen in large motor neurons of the brainstem and spinal cord. This relative sparing of Purkinje neurons (and of the somewhat similarly organized mitral neurons in the olfactory bulb) in the GAA knockouts and the comparable previous findings in human Pompe cerebellum (11, 12) is unexplained, though a recent report described glycogen accumulation in Purkinje neurons in one infantile patient autopsy case (17). By contrast, in several lysosomal storage disorders and other neurogenetic diseases in both species, cerebellar Purkinje neurons are severely affected. Another singular peculiarity of the cerebellar cortex in mouse (and human) Pompe disease is the extreme vacuolization and glycogen accumulation in the specialized radially-oriented astrocytes, the Golgi epithelial cells, compared to the much milder affection in astrocytes elsewhere. A possible explanatory hypothesis for the cerebellar observations follows from the suggestion (52) that astrocyte glycogen may not be needed during normal physiological activity, but may be drawn upon to supply lactate to neurons during intense activity; perhaps Purkinje neurons are so active under normal circumstances as to consume their glycogen, even when the amounts in other cells are rising because of GAA deficiency.
The 6neo/6neo mice develop progressive motor weakness detectable as early as 3 to 4 months of age. Loss of muscle strength as well as significant decline in motor coordination was seen by 7 month of age. This is consistent with earlier findings of muscle weakness and waddling gait by 8 to 9 months of age in this mouse model (25). The biochemical and pathological analyses also indicate progressive accumulation of lysosomal glycogen in the CNS. The most extensive deposition of glycogen was found in motor nuclei of the brainstem, in anterior horn cells of the spinal cord and in dorsal root ganglion neurons, and it progressively increased over time. Furthermore, the deposition was not restricted to neurons. In contrast, accumulation of glycogen in muscle seems to increase only slightly after 3 to 4 months of age in this mouse model (data not shown). Accumulation of glycogen in muscle and nervous system may perhaps both contribute to the progressive motor behavioral deficits. While accumulation of glycogen in muscles contributes to weakness in the early stages, the progressive accumulation of glycogen in the CNS may lead to further deterioration in motor function in the later stages of the disease. Further studies are needed to dissect the role of muscle versus nervous system in the motor deficits. It merits emphasis, however, that in the human disease no evidence of dysfunction of the upper motor neuron, extrapyramidal movement disorders, or serious cognitive disorders has been described.
Enzyme Replacement Therapy (ERT): Muscle versus Nervous System Components of the Disease
One of the primary uses of the animal models is to explore therapeutic prospects; the prognosis in Pompe disease is dismal in the absence of therapy (53–56). Initial ERT studies in patients have been reported in the United States (57, 58), The Netherlands (59, 60), Germany (61), and Italy (62). Although the clinical response of some patients to ERT is remarkable (60, 63), this therapeutic mode may not reach the CNS. This report supports the use of such an animal model in dissecting the possible role, if any, of glycogen accumulation in nervous system cells in Pompe disease.
Acknowledgments
We thank Alison Vitsky for comments on the original pathology report, and Wendy Yang and Jie Bu for tissue collection.
References
- 1.Pompe JC. Over idiopathische hypertrophie van het hart. Ned Tijdschr Geneeskd. 1932;76:304–11. [Google Scholar]
- 2.Hirshhorn R, Reuser A. Glycogen Storage Disease Type II: Acid alpha-glucosidase (acid maltase) deficiency. In: Schriver CR, Beaudet AL, Sly WS, Valle D, editors. Metabolic and Molecular Bases of Inherited Disease. New York, NY: McGraw-Hill; 2001. pp. 3389–420. [Google Scholar]
- 3.Cori GT. Glycogen structure and enzyme deficiencies in glycogen storage disease. Harvey Lect. 1954;8:145–71. [PubMed] [Google Scholar]
- 4.Hers HG. Alpha-glucosidase deficiency in generalized glycogen storage disease (Pompe’s disease) Biochem J. 1963;86:11–16. doi: 10.1042/bj0860011. [DOI] [PMC free article] [PubMed] [Google Scholar]
- 5.Reuser AJ, Drost MR. Lysosomal dysfunction, cellular pathology and clinical symptoms: Basic principles. Acta Paediatr Suppl. 2006;95:77–82. doi: 10.1111/j.1651-2227.2006.tb02395.x. [DOI] [PubMed] [Google Scholar]
- 6.Bijvoet AG, Kroos MA, Pieper FR, et al. Recombinant human acid alpha-glucosidase: High level production in mouse milk, biochemical characteristics, correction of enzyme deficiency in GSDII KO mice. Hum Mol Genet. 1998;7:1815–24. doi: 10.1093/hmg/7.11.1815. [DOI] [PubMed] [Google Scholar]
- 7.Scriver CR, Beaudet AL, Sly WS, Valle D, editors. The Metabolic and Molecular Basis of Inherited Disease. 7. Vol. 2. New York, NY: McGraw-Hill; 1995. Hirschhorn R. Glycogen Storage Disease Type II (GSDII) pp. 2443–65. [Google Scholar]
- 8.Kishnani PS, Hwu W-L, Mandel H, et al. A retrospective, multinational, multicenter study on the natural history of infantile-onset Pompe disease. J Pediatr. 2006;148:671–76. doi: 10.1016/j.jpeds.2005.11.033. [DOI] [PubMed] [Google Scholar]
- 9.Pellegrini N, Laforet P, Orlikowski D, et al. Respiratory insufficiency and limb muscle weakness in adults with Pompe’s disease. Eur Respir J. 2005;26:1024–31. doi: 10.1183/09031936.05.00020005. [DOI] [PubMed] [Google Scholar]
- 10.Hagemans MLC, Hop WJC, Van Doorn PA, et al. Course of disability and respiratory function in untreated late-onset Pompe disease. Neurol. 2006;66:581–83. doi: 10.1212/01.wnl.0000198776.53007.2c. [DOI] [PubMed] [Google Scholar]
- 11.Crome L, Cumings JN, Duckett S. Neuropathological and neurochemical aspects of generalized glycogen storage disease. J Neurol Neurosurg Psychiatry. 1963;26:422–30. doi: 10.1136/jnnp.26.5.422. [DOI] [PMC free article] [PubMed] [Google Scholar]
- 12.Mancall EL, Aponte GE, Berry RG. Pompe’s disease (diffuse glycogenosis) with neuronal storage. J Neuropathol Exp Neurol. 1965;24:85–96. doi: 10.1097/00005072-196501000-00008. [DOI] [PubMed] [Google Scholar]
- 13.Gambetti P, DiMauro S, Baker L. Nervous system in Pompe’s disease. Ultrastructure and biochemistry. J Neuropathol Exp Neurol. 1971;30:412–30. doi: 10.1097/00005072-197107000-00008. [DOI] [PubMed] [Google Scholar]
- 14.Martin JJ, de Barsy T, van Hoof F, et al. Pompe’s disease: An inborn lysosomal disorder with storage of glycogen. A study of brain and striated muscle. Acta Neuropathol (Berl) 1973;23:229–44. doi: 10.1007/BF00687878. [DOI] [PubMed] [Google Scholar]
- 15.Engel AG, Gomez MR, Seybold ME, et al. The spectrum and diagnosis of acid maltase deficiency. Neurol. 1973;23:95–106. doi: 10.1212/wnl.23.1.95. [DOI] [PubMed] [Google Scholar]
- 16.Martini C, Ciana G, Benettoni A, et al. Intractable fever and cortical neuronal glycogen storage in glycogenosis type 2. Neurol. 2001;57:906–8. doi: 10.1212/wnl.57.5.906. [DOI] [PubMed] [Google Scholar]
- 17.Thurberg GL, Maloney CL, Vaccaro C, et al. Characterization of pre- and post-treatment pathology after enzyme replacement therapy for Pompe disease. Lab Invest. 2006;86:1208–20. doi: 10.1038/labinvest.3700484. [DOI] [PubMed] [Google Scholar]
- 18.Slonim AE, Coleman RA, McElligot MA, et al. Improvement of muscle function in acid maltase deficiency by high-protein therapy. Neurol. 1983;33:34–38. doi: 10.1212/wnl.33.1.34. [DOI] [PubMed] [Google Scholar]
- 19.Umpleby AM, Trend PS, Chubb D, et al. The effect of a high protein diet on leucine and alanine turnover in acid maltase deficiency. J Neurol Neurosurg Psychiat. 1989;52:954–61. doi: 10.1136/jnnp.52.8.954. [DOI] [PMC free article] [PubMed] [Google Scholar]
- 20.Teng YT, Su WJ, Hou JW, et al. Infantile-onset glycogen storage disease type II (Pompe disease): Report of a case with genetic diagnosis and pathological findings. Chang Gung Med J. 2004;27:379–84. [PubMed] [Google Scholar]
- 21.Van den Hout H, Reuser AJ, Vulto AG, et al. Recombinant human alpha-glucosidase from rabbit milk in Pompe patients. Lancet. 2000;356:397–98. doi: 10.1016/s0140-6736(00)02533-2. [DOI] [PubMed] [Google Scholar]
- 22.van der Beek NA, Hagemans ML, van der Ploeg AT, et al. Pompe disease (glycogen storage disease type II): Clinical features and enzyme replacement therapy. Acta Neurol Belg. 2006;106:82–86. [PubMed] [Google Scholar]
- 23.Kishnani PS, Corzo D, Nicolino M, et al. Recombinant human acid α-glucosidase. Neurol. 2007;68:99–109. doi: 10.1212/01.wnl.0000251268.41188.04. [DOI] [PubMed] [Google Scholar]
- 24.Bijvoet AG, van de Kamp EH, Kroos MA, et al. Generalized glycogen storage and cardiomegaly in a knockout mouse model of Pompe disease. Hum Mol Genet. 1998;7:53–62. doi: 10.1093/hmg/7.1.53. [DOI] [PubMed] [Google Scholar]
- 25.Raben N, Nagaraju K, Lee E, et al. Targeted disruption of the acid alpha-glucosidase gene in mice causes an illness with critical features of both infantile and adult human glycogen storage disease type II. J Biol Chem. 1998;273:19086–92. doi: 10.1074/jbc.273.30.19086. [DOI] [PubMed] [Google Scholar]
- 26.Bijvoet AG, Van Hirtum H, Vermey M, et al. Pathological features of glycogen storage disease type II highlighted in the knockout mouse model. J Pathol. 1999;189:416–24. doi: 10.1002/(SICI)1096-9896(199911)189:3<416::AID-PATH445>3.0.CO;2-6. [DOI] [PubMed] [Google Scholar]
- 27.Lynch C, Johnson J, Vaccaro C, et al. High-resolution light microscopy (HRLM) and digital analysis of Pompe disease pathology. J Histochem Cytochem. 2005;53:63–73. doi: 10.1177/002215540505300108. [DOI] [PubMed] [Google Scholar]
- 28.Taksir TV, Griffiths D, Johnson J, et al. Optimized preservation of CNS morphology for the identification of glycogen in the Pompe mouse model. J Histochem Cytochem. 2007;55:991–98. doi: 10.1369/jhc.7A7239.2007. [DOI] [PubMed] [Google Scholar]
- 29.Fix AS, Ross JF, Stitzel SR, et al. Integrated evaluation of central nervous system lesions: Stains for neurons, astrocytes, and microglia reveal the spatial and temporal features of MK-801-induced neuronal necrosis in the rat cerebral cortex. Toxicol Pathol. 1996;24:291–304. doi: 10.1177/019262339602400305. [DOI] [PubMed] [Google Scholar]
- 30.Colman JR, Nowocin KJ, Switzer RC, et al. Mapping and reconstruction of domoic acid-induced neurodegeneration in the mouse brain. Neurotoxicol Teratol. 2005;27:753–67. doi: 10.1016/j.ntt.2005.06.009. [DOI] [PubMed] [Google Scholar]
- 31.Carlsen J, De Olmos JS. A modified cupric-silver technique for the impregnation of degenerating neurons and their processes. Br Res. 1981;208:426–31. doi: 10.1016/0006-8993(81)90571-0. [DOI] [PubMed] [Google Scholar]
- 32.de Olmos JS, Beltramino CA, de Olmos de Lorenzo S. Use of an amino-cupric-silver technique for the detection of early and semiacute neuronal degeneration caused by neurotoxicants, hypoxia, and physical trauma. Neurotoxicol Teratol. 1994;16:545–61. doi: 10.1016/0892-0362(94)90033-7. [DOI] [PubMed] [Google Scholar]
- 33.Schmued LC, Stowerts CC, Scallet AC, et al. Fluoro-Jade C results in ultra high resolution and contrast labeling of degenerating neurons. Br Res. 2005;1035:24–31. doi: 10.1016/j.brainres.2004.11.054. [DOI] [PubMed] [Google Scholar]
- 34.Bian G-L, Wei L-C, Shi M, et al. Fluoro-Jade C can specifically stain the degenerative neurons in the substantia nigra of the 1-methyl-4-phenyl-1,2,3,6-tetrahydro pyridine-treated C57BL/6 mice. Br Res. 2007;1150:55–61. doi: 10.1016/j.brainres.2007.02.078. [DOI] [PubMed] [Google Scholar]
- 35.Doetsch F, Caille I, Lim DA, et al. Subventricular zone astrocytes are neural stem cells in the adult mammalian brain. Cell. 1999;97:703–16. doi: 10.1016/s0092-8674(00)80783-7. [DOI] [PubMed] [Google Scholar]
- 36.Alvarez-Buylla A, Garcia-Verdugo JM, Tramontin AD. A unified hypothesis on the lineage of neural stem cells. Nat Rev Neurosci. 2001;2:287–93. doi: 10.1038/35067582. [DOI] [PubMed] [Google Scholar]
- 37.Zhao M, Choi Y-S, Obrietan K, et al. Synaptic plasticity (and the lack thereof) in hippocampal CA2 neurons. J Neurosci. 2007;27:12025–32. doi: 10.1523/JNEUROSCI.4094-07.2007. [DOI] [PMC free article] [PubMed] [Google Scholar]
- 38.Fukuda T, Ewan L, Bauer M, et al. Dysfunction of endocytic and autophagic pathways in a lysosomal storage disease. Ann Neurol. 2006;59:700–8. doi: 10.1002/ana.20807. [DOI] [PubMed] [Google Scholar]
- 39.Fukuda T, Roberts A, Plotz PH, et al. Acid alpha-glucosidase deficiency (Pompe disease) Curr Neurol Neurosci Rep. 2007;7:71–77. doi: 10.1007/s11910-007-0024-4. [DOI] [PubMed] [Google Scholar]
- 40.Hagemans ML, van Schie SP, Janssens AC, et al. Fatigue: An important feature of late-onset Pompe disease. J Neurol. 2007;254:941–45. doi: 10.1007/s00415-006-0434-2. [DOI] [PMC free article] [PubMed] [Google Scholar]
- 41.Nemes A, Soliman OI, Geleijnse ML, Anwar AM, et al. Increased aortic stiffness in glycogenosis type 2 (Pompe’s disease) Int J Cardiol. 2007;120:138–41. doi: 10.1016/j.ijcard.2006.07.215. [DOI] [PubMed] [Google Scholar]
- 42.Braunsdorf WE. Fusiform aneurysm of basilar artery and ectatic internal carotid arteries associated with glycogenosis type 2 (Pompe’s disease) Neurosurg. 1987;21:748–49. doi: 10.1227/00006123-198711000-00030. [DOI] [PubMed] [Google Scholar]
- 43.Healy PJ, Nicholls PJ, Martiniuk F, et al. Evidence of molecular heterogeneity for generalised glycogenosis between and within breeds of cattle. Aust Vet J. 1995;72:309–11. doi: 10.1111/j.1751-0813.1995.tb03561.x. [DOI] [PubMed] [Google Scholar]
- 44.Walvoort HC, Dormans JA, van den Ingh TS. Comparative pathology of the canine model of glycogen storage disease type II (Pompe’s disease) J Inher Metab Dis. 1985;8:38–46. doi: 10.1007/BF01805484. [DOI] [PubMed] [Google Scholar]
- 45.Miyagawa-Tomita S, Morishima M, Nakazawa M, et al. Pathological study of Japanese quail embryo with acid alpha-glucosidase deficiency during early development. Acta Neuropathol. 1996;92:249–54. doi: 10.1007/s004010050515. [DOI] [PubMed] [Google Scholar]
- 46.Kamphoven JH, de Ruiter MM, Winkel LP, et al. Hearing loss in infantile Pompe’s disease and determination of underlying pathology in the knockout mouse. Neurobiol Dis. 2004;16:14–20. doi: 10.1016/j.nbd.2003.12.018. [DOI] [PubMed] [Google Scholar]
- 47.Toussaint D, Danis P. Ocular histopathology in generalized glycogenosis (Pompe’s disease) Arch Ophthalm. 1965;73:342–49. doi: 10.1001/archopht.1965.00970030344009. [DOI] [PubMed] [Google Scholar]
- 48.Goebel HH, Kohlschütter A, Pilz H. Ultrastructural observations on the retina in type II glycogenosis (Pompe’s disease) Ophthalmologica. 1978;176:61–68. doi: 10.1159/000308694. [DOI] [PubMed] [Google Scholar]
- 49.Araoz C, Sun CN, Shenefelt, et al. Glycogenosis type II (Pompe’s disease): Ultrastructure of peripheral nerves. Neurol. 1974;24:739–42. doi: 10.1212/wnl.24.8.739. [DOI] [PubMed] [Google Scholar]
- 50.Origuchi Y, Itai Y, Matsumoto S, et al. Quantitative histological study of the sural nerve in a child with acid maltase deficiency (glycogenosis type II) Pediatr Neurol. 1986;2:346–49. doi: 10.1016/0887-8994(86)90075-5. [DOI] [PubMed] [Google Scholar]
- 51.Schoser BG, Muller-Hocker J, Horvath R, et al. Adult-onset glycogen storage disease type 2: Clinico-pathological phenotype revisited. Neuropathol Appl Neurobiol. 2007;33:544–59. doi: 10.1111/j.1365-2990.2007.00839.x. [DOI] [PubMed] [Google Scholar]
- 52.Brown AM, Ransom BR. Astrocyte glycogen and brain energy metabolism. Glia. 2007;55:1263–71. doi: 10.1002/glia.20557. [DOI] [PubMed] [Google Scholar]
- 53.Van den Hout JM, Kamphoven JH, Winkel LP, et al. Long-term intravenous treatment of Pompe disease with recombinant human alpha-glucosidase from milk. Pediatrics. 2004;113:448–57. doi: 10.1542/peds.113.5.e448. [DOI] [PubMed] [Google Scholar]
- 54.Hagemans MLC, Winkel LPF, Van Doorn PA, et al. Clinical manifestation and natural course of late-onset Pompe’s disease in 54 Dutch patients. Brain. 2005;128:671–77. doi: 10.1093/brain/awh384. [DOI] [PubMed] [Google Scholar]
- 55.Winkel LPF, Hagemans MLC, van Doorn PA, et al. The natural course of non–classic Pompe’s disease: A review of 225 published cases. J Neurol. 2005;252:875–84. doi: 10.1007/s00415-005-0922-9. [DOI] [PubMed] [Google Scholar]
- 56.Kishnani PS, Corzo D, Nicolino M, et al. Recombinant human acid α-glucosidase. Neurol. 2007;68:99–109. doi: 10.1212/01.wnl.0000251268.41188.04. [DOI] [PubMed] [Google Scholar]
- 57.Amalfitano A, Bengur AR, Morse RP, et al. Recombinant human acid alpha-glucosidase enzyme therapy for infantile glycogen storage disease type II: Results of a phase I/II clinical trial. Genet Med. 2001;3:132–38. [PubMed] [Google Scholar]
- 58.Cook AL, Kishnani PS, Carboni MP, et al. Ambulatory electrocardiogram analysis in infants treated with recombinant human acid alpha-glucosidase enzyme replacement therapy for Pompe disease. Genet Med. 2006;8:313–17. doi: 10.1097/01.gim.0000217786.79173.a8. [DOI] [PubMed] [Google Scholar]
- 59.Winkel LP, Van den Hout JM, Kamphoven JH, et al. Enzyme replacement therapy in late-onset Pompe’s disease: A three-year follow-up. Ann Neurol. 2004;55:495–502. doi: 10.1002/ana.20019. [DOI] [PubMed] [Google Scholar]
- 60.van der Beek NA, Hagemans ML, van der Ploeg AT, et al. Pompe disease (glycogen storage disease type II): Clinical features and enzyme replacement therapy. Acta Neurol Belg. 2006;106:828–26. [PubMed] [Google Scholar]
- 61.Klinge L, Straub V, Neudorf U, et al. Safety and efficacy of recombinant acid alpha-glucosidase (rhGAA) in patients with classical infantile Pompe disease: Results of a phase II clinical trial. Neuromuscul Disord. 2005;15:24–31. doi: 10.1016/j.nmd.2004.10.009. [DOI] [PubMed] [Google Scholar]
- 62.Rossi M, Parenti G, Della Casa R, et al. Long-term enzyme replacement therapy for Pompe disease with recombinant human α-glucosidase derived from Chinese hamster ovary cells. J Child Neurol. 2007;22:565–73. doi: 10.1177/0883073807302598. [DOI] [PubMed] [Google Scholar]
- 63.Brady RO. Enzyme replacement for lysosomal diseases. Annu Rev Med. 2006;57:283–96. doi: 10.1146/annurev.med.57.110104.115650. [DOI] [PubMed] [Google Scholar]


